GI Cancer results slides from ESMO 2026 (Madrid, October 23–27), posted since the October 22 embargo lift: 254 slide posts and 62 KOL infographics from 89 accounts, organized by clinical trial — led by HARMONi-GI1, CLARITY-Gastric01, AZUR-1, SANO. Each trial links to its KOL Pulse trial page and conference discussion. Physician posts first; every slide carries a verbatim OCR transcription. Updated October 29, 2026. ← Back to the full ESMO 2026 coverage
This page holds the ESMO 2026 GI Cancer results slides, part of the ESMO 2026 slide library. Other tumor types have their own pages below; pre-congress previews are in the pre-congress archive →
[Slide 1]
16:30 - 18:15 Presidential Symposium II
CHAIRS: GIUSEPPE CURIGLIANO, YELENA JANJIGIAN
Future work
• Who benefits most? Identify biomarkers—gene driver, VEGF and immune signature
• Can we move to earlier? Explore ivonescimab in the perioperative and adjuvant setting
• Can we improve outcomes further? Investigate combinations with targeted therapy and ADCs
• What's next for bispecific antibodies? Emerging approaches targeting DLL4/VEGF, PD-1/TIGIT, and HER2 in late-stage testing; many more on the way.
James J. Harding
James Harding
Invited Discussant LBA8
ALICANTE AUDITORIUM - HALL 6
[Slide 2]
16:30 - 18:15 Presidential Symposium II
CHAIRS: GIUSEPPE CURIGLIANO, YELENA JANJIGIAN
HARMONi GI1: Broadly similar population, with some geographic and etiologic differences
Demographics | ABC-02 GemCis | Topaz-1 GemCis + Durva | Keynote-966 GemCis + Pembro | HARMONI-G1 GemCis +Ivonescimab
Study Population | United Kingdom | Global | Global | China
iCCA | 60% | 56 | 60% | 58%
HBV | NR | 24% | 31% | 59.6%
Global testing planned—NCT07765433 first-line ECOG ACRIN; NCT05615818 second line SAFIR-ABC10
Zhu et al. J Hepatology 2026; Deng et al. Hepatology 2023
Valle et al. NEJM 2010, Oh et al. NEJM Evidence 2022; Kelley et al. Lancet 2023; Vogel et al. ASCO 2022; Chan et al.CCR 2026; Zhou et al. ESMO 2026 LBA #8
James J. Harding
James Harding
Invited Discussant LBA8
ALICANTE AUDITORIUM - HALL 6
[Slide 3]
Presidential Symposium II
CHAIRS: GIUSEPPE CURIGLIANO, YELENA JANJIGIAN
HARMONi-GI1 met primary OS endpoint
[KM curve inset] Ivonescimab + chemo | Durvalumab + chemo
mOS (95% CI), months | 14.9 (12.9, NE) | 12.1 (11.0, 13.4)
Stratified HR (95% CI) | 0.75 (0.61, 0.92)
P-value | 0.0031 (one-side)
The one-sided P-value boundary for significance was [illegible]
12-month rate [illegible] | 18-month rate [illegible]
Number at Risk [illegible]
mOS, median overall survival; HR, hazard ratio; CI, confidence interval; NE, not estimable.
• Balanced arms
• Control arm performance similar to historic
• Similar treatment intensity
• D/C'd (Any, ICI): 12.7%, 3.5% vs 10%, 5.6%
• Median GemCis duration: 5.7 vs 5.5 months
• Post protocol treatment > durvalumab arm
• Ivonescimab 31.8% vs Durvalumab 45.9%
• Interim analysis 81.6% maturity
Zhou et al. ESMO 2026 LBA #8
James J. Harding
James Harding
Invited Discussant LBA8
ALICANTE AUDITORIUM - HALL 6
Survival table
Endpoint: Overall survival
Ivonescimab + chemo | 14.9 | 12.9, NE
Durvalumab + chemo | 12.1 | 11.0, 13.4
HR: 0.75
HR CI: 0.61, 0.92
P: 0.0031 (one-sided)
[Slide 4]
16:30 - 18:15 Presidential Symposium II
CHAIRS: GIUSEPPE CURIGLIANO, YELENA JANJIGIAN
Ivonescimab adds toxicity
• Δ 10% Grade 3/4 TEAE favoring ivonescimab— ↑ Grade 3/4 thrombocytopenia and neutropenia
• Antiangiogenic effect evident—credentials mechanism of action
• HTN Any 15%, Grade ≥ 3 5.6%
• Proteinuria Any: 32.2% vs 11.8%
• Hemorrhage and thrombosis—similar between arms
• Hemorrhage: 9.8% (Gr≥3 1.5%) vs 6.5% (Gr≥3 1.8%)
• VTE: 2.7% vs 1.5% / ATE: 0.3% vs 1.5%
• IrAE comparable to TOPAZ-1/Keynote-966
• QoL data pending
Zhou et al. ESMO 2026 LBA #8
James J. Harding
James Harding
Invited Discussant LBA8
ALICANTE AUDITORIUM - HALL 6
ESMO 2026 presidential 2 | HARMONi-GI1: Ivonescimab beats durvalumab in advanced biliary tract cancer!
Phase III trial (n=682): Ivonescimab (PD-1/VEGF bispecific antibody) + gemcitabine/cisplatin vs durvalumab + gemcitabine/cisplatin in 1L advanced BTC.
📊 Key results:
✅ Median OS: 14.9 vs 12.1 months (HR 0.75; p=0.0031)
✅ Median PFS: 8.4 vs 5.8 months (HR 0.61; p<0.0001)
✅ ORR: 53.8% vs 32.5% (p<0.0001)
✅ Manageable safety profile; no new safety signals.
🔥 25% reduction in risk of death and 39% reduction in risk of progression!
A rare head-to-head phase III victory against an established immunotherapy standard in BTC.
Could PD-1/VEGF bispecific antibodies replace conventional PD-L1 inhibition in first-line BTC? @OncoAlert @myESMO
#ESMO26 #BiliaryTractCancer #Oncology
[Slide 1]
Proffered Paper session
LBA8 - Ivonescimab plus chemotherapy versus durvalumab plus chemotherapy as first-line treatment for advanced biliary tract cancer: A randomized, controlled, double-blinded, phase 3 trial (HARMONi-GI1)
Speakers Jian Zhou (Shanghai, China)
Lecture Time 17:42 - 17:54
Abstract
Background
Durvalumab plus chemotherapy (chemo) is the standard first-line treatment for advanced biliary tract cancer (BTC). In the current phase 3 study conducted in China, we evaluated the efficacy and safety of ivonescimab, a PD-1/VEGF bispecific antibody, plus chemo versus durvalumab plus chemo as first-line treatment for advanced BTC. Here we report the results from the preplanned interim analysis.
[Slide 2]
Results
682 patients were randomized (ivonescimab: 340; durvalumab: 342). Baseline characteristics were balanced between arms. Median follow-up was 14.3 months. The primary endpoint was met. Median OS was significantly improved with ivonescimab plus chemo versus durvalumab plus chemo (14.9 vs. 12.1 months; HR 0.75, 95% CI 0.61-0.92, P = 0.0031). Median PFS was 8.4 vs. 5.8 months (HR 0.61, 95% CI 0.51-0.72, P <0.0001). The ORR was 53.8 % vs. 32.5 % (P <0.0001). Treatment-related adverse events were generally well tolerated, with a manageable safety profile. The most common treatment-emergent adverse events (TEAEs) were haematological toxicity. No new safety signals were identified for ivonescimab.
Conclusions
Ivonescimab plus chemo significantly improved OS, PFS and ORR in patients with advanced BTC compared with durvalumab plus chemo, with a manageable safety profile. These results support ivonescimab plus chemo as a potential new first-line standard of care for advanced BTC.
[Slide 3]
Methods
Eligible patients with unresectable locally advanced or metastatic BTC were stratified by disease status (locally advanced vs. metastatic) and primary tumor location (intrahepatic cholangiocarcinoma vs. extrahepatic cholangiocarcinoma vs. gallbladder cancer), and randomized 1:1 to receive ivonescimab or durvalumab plus gemcitabine and cisplatin (Q3W, 8 cycles), followed by ivonescimab or durvalumab maintenance therapy. The primary endpoint was overall survival (OS). Key secondary endpoints included progression-free survival (PFS) and objective response rate (ORR).
🔥Presidential session at ESMO 2026 🔥
HARMONi-GI1 ph-3: Ivonescimab + CTx vs durvalumab + CTx as 1L for BTC
#ESMO26 #ESMOAmbassadors
👉ORR: 53.8 vs. 32.5 %
👉mPFS: 8.4 vs 5.8 mo
👉mOS: 14.9 vs. 12.1 mo
🧐 Very promising Chinese data, would be great to see data in a global population
@myESMO @ASCO
🔥HARMONi-GI1 ph3 advanced #BTC
➡️ivonescimab/GC v durva/GC mFU 14.3mths; China only & interim
✅ iCCA 58% ORR 53.8v32.5%; mPFS 8.4 v 5.8mths
✅mOS 14.9 v12.1mths HR0.75
➡️AE rate high in both
Control arm OS represents❗️VEGF in BTC ⭐️ looks promising
@myESMO #ESMO26 @OncoAlert https://t.co/8HVkjxvaFq
Slide: LBA8 phase 3 abstract - ivonescimab + chemo vs durvalumab + chemo in 1L BTC (Jian Zhou)
#ESMO26 | HARMONi-GI1| Presidential Session-2
In 1L advanced biliary tract cancer, ivonescimab + chemo vs durvalumab + chemo:
🔹 OS: 14.9 vs 12.1 mo
🔹 PFS: 8.4 vs 5.8 mo
🔹 ORR: 53.8% vs 32.5%
A clinically meaningful improvement in OS and PFS against an active SoC comparator https://t.co/haLYmXJHBw
LBA8 - Ivonescimab plus chemotherapy versus durvalumab plus chemotherapy as first-line treatment for advanced biliary tract cancer: A randomized, controlled, double-blinded, phase 3 trial (HARMONi-GI1)
Speakers Jian Zhou (Shanghai, China)
Lecture Time 17:42 - 17:54
Background
Durvalumab plus chemotherapy (chemo) is the standard first-line treatment for advanced biliary tract cancer (BTC). In the current phase 3 study conducted in China, we evaluated the efficacy and safety of ivonescimab, a PD-1/VEGF bispecific antibody, plus chemo versus durvalumab plus chemo as first-line treatment for advanced BTC. Here we report the results from the preplanned interim analysis.
Methods
Eligible patients with unresectable locally advanced or metastatic BTC were stratified by disease status (locally advanced vs. metastatic) and primary tumor location (intrahepatic cholangiocarcinoma vs. extrahepatic cholangiocarcinoma vs. gallbladder cancer), and randomized 1:1 to receive ivonescimab or durvalumab plus gemcitabine and cisplatin (Q3W, 8 cycles), followed by ivonescimab or durvalumab maintenance therapy. The primary endpoint was overall survival (OS). Key secondary endpoints included progression-free survival (PFS) and objective response rate (ORR).
Results
682 patients were randomized (ivonescimab: 340; durvalumab: 342). Baseline characteristics were balanced between arms. Median follow-up was 14.3 months. The primary endpoint was met. Median OS was significantly improved with ivonescimab plus chemo versus durvalumab plus chemo (14.9 vs. 12.1 months; HR 0.75, 95% CI 0.61-0.92, P = 0.0031). Median PFS was 8.4 vs. 5.8 months (HR 0.61, 95% CI 0.51-0.72, P <0.0001). The ORR was 53.8 % vs. 32.5 % (P <0.0001). Treatment-related adverse events were generally well tolerated, with a manageable safety profile. The most common treatment-emergent adverse events (TEAEs) were haematological toxicity. No new safety signals were identified for ivonescimab.
Conclusions
Ivonescimab plus chemo significantly improved OS, PFS and ORR in patients with advanced BTC compared with durvalumab plus chemo, with a manageable safety profile. These results support ivonescimab plus chemo as a potential new first-line standard of care for advanced BTC.
Great discussion by @HardingJJMD
✅OS interim analysis but finding likely to remain
✅Highest ORR in a phIII
👀Adds some tox
🌐Population slightly different to other trials
#ESMOAmbassadors https://t.co/dQSTtAKqP4
[Slide 1]
HARMONi-GI1 met primary OS endpoint
Overall Survival Rate (%)
Ivonescimab+chemo
Durvalumab+chemo
12-month rate 59.7% 50.7%
18-month rate 44.0% 32.5%
Ivonescimab + chemo | Durvalumab + chemo
mOS (95% CI), months 14.9 (12.9, NE) | 12.1 (11.0, 13.4)
Stratified HR (95% CI) 0.75 (0.61, 0.92)
P-value 0.0031 (one-side)
The one sided P-value boundary for significance was 0.0[illegible]
Time (months)
Number of Risk
mOS, median overall survival; HR, hazard ratio; CI, confidence interval; NE, not estimable.
• Balanced arms
• Control arm performance similar to historic
• Similar treatment intensity
• D/C'd (Any, ICI): 12.7%, 3.5% vs 10%, 5.6%
• Median GemCis duration: 5.7 vs 5.5 months
• Post protocol treatment > durvalumab arm
• Ivonescimab 31.8% vs Durvalumab 45.9%
• Interim analysis 81.6% maturity
Zhou et al. ESMO 2026 LBA #8
James J. Harding
Survival table
Endpoint: Overall survival (interim analysis)
Arm | N | Median | Median CI
Ivonescimab + chemo | 340 | 14.9 mo | 12.9, NE
Durvalumab + chemo | 342 | 12.1 mo | 11.0, 13.4
HR: 0.75 (stratified)
HR CI: 0.61, 0.92
P: 0.0031 (one-side)
12-month rate: 59.7% vs 50.7%
18-month rate: 44.0% vs 32.5%
[Slide 3]
Key Take Aways
• Compelling and convincing efficacy: HARMONi-GI1 demonstrates a clinically meaningful OS benefit with ivonescimab plus gemcitabine and cisplatin.
• Manageable added toxicity: Increased hematologic and VEGF-related adverse events; QoL data awaited.
• Potentially practice-changing: Longer follow-up will clarify durability of benefit, while global phase III testing will assess broader applicability.
James J. Harding
[Slide 4]
Ivonescimab adds toxicity
• Δ 10% Grade 3/4 TEAE favoring ivonescimab— ↑ Grade 3/4 thrombocytopenia and neutropenia
• Antiangiogenic effect evident—credentials mechanism of action
• HTN Any 15%, Grade ≥ 3 5.6%
• Proteinuria Any: 32.2% vs 11.8%
• Hemorrhage and thrombosis—similar between arms
• Hemorrhage: 9.8% (Gr≥3 1.5%) vs 6.5% (Gr≥3 1.8%)
• VTE: 2.7% vs 1.5% / ATE: 0.3% vs 1.5%
• IrAE comparable to TOPAZ-1/Keynote-966
• QoL data pending
Zhou et al. ESMO 2026 LBA #8
James J. Harding
#ESMO26 | HARMONi-GI1
Ivonescimab + chemotherapy improving both OS and PFS over the current standard, durvalumab + chemotherapy, in advanced biliary tract cancer is an important result.
If accessible, the new standard of care. https://t.co/NVeoBrmbZ4 https://t.co/zeEzRRvCD8
Key takeaway points
Ivonescimab is the worldwide first PD-1/VEGF dual-target bispecific antibody and has been approved in China in three lung indications since 2024
Ivonescimab plus chemotherapy significantly improved overall survival (OS), progression-free survival (PFS), and objective response rate (ORR) in advanced biliary tract cancer as first-line treatment compared with durvalumab plus chemotherapy
HARMONi-GI1 supports ivonescimab plus chemotherapy as a new standard of care for first-line BTC
Jian Zhou, MD, PhD
Slide: title slide with author list and affiliations (presenter Jian Zhou, 25 October 2026)
📣 Second Presidential Symposium
#ESMO26
👉🏽 Ivonescimab plus chemotherapy versus durvalumab plus chemotherapy as first-line treatment for advanced biliary tract cancer: A randomized, controlled, double-blinded, phase 3 trial (HARMONi-GI1)
🗣️ Dr. Zhou
📌 PFS 8.4 vs 5.8m HR 0.61
📌 OS 14.9 vs 12.1m HR 0.75
☣️ Most frequent hematologic, AST elevation, proteinuria
☣️ Grade 3 or higher 82 vs 72%
@OncoAlert @myESMO @ASCO @_SEOM @UTMDAnderson @NEJM @brunolarvol
👇🏽👇🏽
MADRID 2026 ESMO congress
Ivonescimab plus chemotherapy versus durvalumab plus chemotheray as first-line treatment for advanced biliary tract cancer: a randomized, controlled, double-blinded, phase 3 trial (HARMONi-GI1)
Jian Zhou¹, Tongsen Zheng², Jia Fan¹, Guoming Shi¹, Caiqi Liu², Xiaoyong Huang¹, Hong Zhao³, He Tian⁴, Jia Luo⁵, Li Peng⁶, Xianglin Yuan⁷, Yong Zha⁸, Xiong Chen⁹, Haitao Zhao¹⁰, Yefu Liu¹¹, Tao Peng¹², Wei Cheng¹³, Jun Zhou¹⁴, Yufeng Yuan¹⁵, Michelle Xia¹⁶
¹Zhongshan Hospital, Shanghai, China; ²Harbin Medical University Cancer Hospital, Harbin, China; ³National Cancer Center/National Clinical Research Center for Cancer/Cancer Hospital, Chinese Academy of Medical Sciences and Peking Union Medical College, Beijing, China; ⁴Shandong Cancer Hospital & Institute, Jinan, China; ⁵Hunan Cancer Hospital, Changsha, China; ⁶The Fourth Hospital of Hebei Medical University, Shijiazhuang, China; ⁷Tongji Hospital Tongji Medical College of HUST, Wuhan, China; ⁸Yunnan Cancer Hospital, Kunming, China; ⁹Mengchao Hepatobiliary Hospital of Fujian Medical University, Fuzhou, China; ¹⁰Peking Union Medical College Hospital, Chinese Academy of Medical Sciences, Beijing, China; ¹¹Cancer Hospital of Dalian University of Technology (Liaoning Cancer Hospital & Institute), Shenyang, China; ¹²The First Affiliated Hospital of Guangxi Medical University, Nanning, China; ¹³People's Hospital of Hunan Province, Changsha, China; ¹⁴Beijing Tsinghua Changgung Hospital, Beijing, China; ¹⁵Zhongnan Hospital of Wuhan University, Wuhan, China; ¹⁶Akeso Biopharma, Inc., Zhongshan, China.
Presenter: Jian Zhou, MD, PhD
25 October 2026
Slide: OS forest plot in prespecified subgroups, ivonescimab + chemo vs durvalumab + chemo
Ivonescimab plus chemotherapy versus durvalumab plus chemotherapy as first-line treatment for advanced biliary tract cancer: A randomized, controlled, double-blinded, phase 3 trial (HARMONi-GI1)
Jian Zhou (Shanghai, China) #ESMO2026 https://t.co/BRNrPS6MYf
Conclusions
• HARMONi-GI1 met its primary endpoint and all key secondary endpoints
• Ivonescimab plus chemotherapy significantly improved OS, PFS and ORR in previously untreated advanced BTC compared with durvalumab plus chemotherapy
➢ mOS: 14.9 vs. 12.1, HR 0.75 (95% CI: 0.61, 0.92), P=0.0031
➢ mPFS: 8.4 vs. 5.8, HR 0.61 (95% CI: 0.51, 0.72), P<0.0001
➢ ORR: 53.8% vs. 32.5%, P<0.0001
• The safety profile was manageable, with no unexpected adverse events, low rate of discontinuation, no increase in grade ≥3 haemorrhage and no increase in irAEs
• HARMONi-GI1 is the first phase 3 trial in BTC to show statistically significant and clinically meaningful improvement in OS over durva+chemo in Chinese population
HARMONi-GI1 supports ivonescimab plus chemotherapy as a new standard of care for first-line BTC
Jian Zhou, MD, PhD
Ivonescimab plus chemotherapy versus durvalumab plus chemotheray as first-line treatment for advanced biliary tract cancer: a randomized, controlled, double-blinde[d] phase 3 trial (HARMONi-GI1)
Jian Zhou1, Tongsen Zheng2, Jia Fan1, Guoming Shi1, Caiqi Liu2, Xiaoyong Huang1, Hong Zhao3, He Tian4, Jia Luo5, Li Peng6, Xianglin Yuan7, Yong Zha8, Xiong Chen9, Haitao Zhao10, Yefu Liu11, Tao Peng12, Wei Cheng13, Jun Zhou14, Yufeng Yuan15, Michelle Xia16
1Zhongshan Hospital, Shanghai, China; 2Harbin Medical University Cancer Hospital, Harbin, China; 3National Cancer Center/National Clinical Research Center for Cancer/Cancer Hospital, Chinese Academy of Medical Sciences and Peking Union Medical College, Beijing, China; 4Shandong Cancer Hospital & Institute, Jinan, China; 5Hunan Cancer Hospital, Changsha, China; 6The Fourth Hospital of Hebei Medical University, Shijiazhuang, China; 7Tongji Hospital Tongji Medical College of HUST, Wuhan, China; 8Yunnan Cancer Hospital, Kunming, China; 9Mengchao Hepatobiliary Hospital of Fujian Medical University, Fuzhou, China; 10Peking Union Medical College Hospital, Chinese Academy of Medical Sciences, Beijing, China; 11Cancer Hospital of Dalian University of Technology (Liaoning Cancer Hospital & Institute), Shenyang, China; 12The First Affiliated Hospital of Guangxi Medical University, Nanning, China; 13People's Hospital of Hunan Province, Changsha, China; 14Beijing Tsinghua Changgung Hospital, Beijing, China; 15Zhongnan Hospital of Wuhan University, Wuhan, China; 16Akeso Biopharma, Inc., Zhongshan, China.
Presenter: Jian Zhou, MD, PhD
25 October 2026
Create a free account, pick the tumor types you cover, and go beyond the tweet — the intelligence pharma teams use to map influence and prepare for engagement:
1) Trial design schema: study design (clean capture) · 2) Slide: OS in 3L+ (clean capture) · 3) Slide: OS subgroup analysis in ITT (forest plot) · 4) Kaplan-Meier survival data: PFS by BICR in ITT and 3L+ (clean capture)
#ESMO26 | CLARITY-Gastric01
Doubling OS from 5 to 10 months with the CLDN18.2-targeted ADC sonesitatug vedotin in ≥3L is impressive (HR 0.47). Benefit even in patients with lower CLDN18.2 expression is encouraging.
However, the primary PFS endpoint was not met in the ITT population. Its role in 2L and efficacy after zolbetuximab remain unclear.
one question: Given that CLDN18.2 expression can change after treatment, should a fresh biopsy have been mandatory at study enrollment? Or does lowering the positivity cutoff to ≥25% reduce the clinical relevance of this discordance, making archival tissue sufficient?
[Slide 1]
Study design: CLARITY-Gastric01 (NCT06346392)
Randomised, open-label, sponsor-blinded, global Phase 3 study comparing the efficacy and safety of sonesitatug vedotin (Sone-Ve) to investigator's choice of therapy in patients with 2L+ advanced gastroesophageal carcinoma (GEC) expressing CLDN18.2
STUDY POPULATION: N=594; 2L+ GEC expressing CLDN18.2 (≥25% tumour cells with any intensity membranous staining)
STRATIFIED BY: • Region • Prior gastrectomy • Treatment line
DOSE SELECTION: R 1:1:1* → Sone-Ve 2.2 mg/kg Q3W (n=267); Investigator's choice of therapy (n=265) [R 1:1]; Sone-Ve 1.8 mg/kg Q3W (n=62): closed to enrolment
MULTIPLE TESTING PROCEDURE: DUAL-PRIMARY — PFS in ITT 0.1% initial alpha; OS in 3L+ 4.9% initial alpha; 2-sided α recycling → OS in ITT
Investigator's choice of therapy — 2L: • Ramucirumab + paclitaxel • Paclitaxel (contraindication to ramucirumab only) • Docetaxel (contraindication to ramucirumab only); 3L+: • Irinotecan • TAS-102 (except China) • Apatinib (China only)
Endpoints — DUAL PRIMARY: • OS (3L+)† • PFS by BICR (ITT [all 2L+])‡; KEY SECONDARY: • OS (ITT); ADDITIONAL SECONDARY / EXPLORATORY: • PFS by BICR (3L+) • ORR and DoR by BICR (ITT, 3L+) • Safety • OS by CLDN18.2 expression (ITT) • PFS, ORR and DoR by Investigator (ITT, 3L+) • OS in prespecified subgroups (ITT, 3L+)
*Patients were randomised 1:1:1 to Sone-Ve 2.2 mg/kg Q3W, Sone-Ve 1.8 mg/kg Q3W, or investigator's choice of therapy. As of January 2025, the optimal Sone-Ve monotherapy dose was determined to be 2.2 mg/kg IV Q3W and the 1.8 mg/kg arm was closed to enrollment. Randomisation continued in a 1:1 ratio Sone-Ve 2.2 mg/kg Q3w or investigator's choice of therapy. †All randomised patients who had received ≥2 prior lines of systemic therapy; ‡All randomised patients who had received ≥1 prior line of systemic therapy. PFS, ORR and DoR determined per RECIST v1.1.
Rui-Hua Xu
CLARITY-Gastric01
[Slide 2]
OS in 3L+
Dual-primary endpoint: OS in 3L+
| Sone-Ve 2.2 mg/kg (n=178) | Investigator's choice of therapy (n=177)
Median OS (95% CI), months | 10.0 (7.2–11.4) | 5.0 (4.2–6.4)
HR (95% CI) | 0.47 (0.36–0.62)
P-value | <0.000001
12-month OS: 38.1% vs 18.1%
No. patients at risk (0–27 mo by 3)
Sone-Ve 2.2 mg/kg | 178 146 95 59 19 7 3 1 0 0
Investigator's choice of therapy | 177 117 58 24 14 6 2 2 1 0
Sone-Ve significantly improved OS versus investigator's choice of therapy in the 3L+ population
The HR and CI were estimated from a stratified Cox proportional-hazards model with ties = Efron. Stratification variables were geographical region, prior gastrectomy and line of therapy. The CI was calculated using a profile likelihood approach. A HR of less than 1 favours Sone-Ve. Tick marks indicate censored observations. CI, confidence interval; HR, hazard ratio.
Rui-Hua Xu
CLARITY-Gastric01
Survival table
Endpoint: OS in 3L+ (dual primary)
Arm | N | Median | Median CI
Sone-Ve 2.2 mg/kg | 178 | 10.0 | 7.2–11.4
Investigator's choice of therapy | 177 | 5.0 | 4.2–6.4
HR: 0.47
HR CI: 0.36–0.62
P: <0.000001
Landmark rates:
12 months: Sone-Ve 2.2 mg/kg 38.1% | Investigator's choice of therapy 18.1%
[Slide 3]
OS subgroup analysis in ITT
Subgroup | Sone-Ve 2.2 mg/kg | Investigator's choice of therapy | Hazard ratio (95% CI)
No. of events/total no. of patients
All patients | 139/267 | 174/265 | 0.58 (0.47–0.73)
Age ≥18–<65 years | 96/191 | 123/192 | 0.60 (0.46–0.78)
Age ≥65 years | 43/76 | 51/73 | 0.64 (0.42–0.96)
Sex Female | 52/117 | 62/106 | 0.58 (0.40–0.84)
Sex Male | 87/150 | 112/159 | 0.64 (0.48–0.85)
Region Japan & S. Korea | 22/55 | 33/54 | 0.52 (0.30–0.89)
Region Other Asia | 59/107 | 83/106 | 0.46 (0.33–0.64)
Region RoW | 58/105 | 58/105 | 0.92 (0.64–1.33)
ECOG PS 0 | 43/88 | 46/92 | 0.80 (0.53–1.22)
ECOG PS 1 | 96/179 | 128/173 | 0.53 (0.40–0.69)
Primary tumour location Gastric | 106/213 | 133/194 | 0.52 (0.40–0.67)
Primary tumour location GEJC/EAC | 33/54 | 41/71 | 1.08 (0.68–1.71)
No. of organ metastases 0–2 | 84/179 | 112/185 | 0.63 (0.47–0.83)
No. of organ metastases 3 | 55/88 | 62/80 | 0.53 (0.37–0.77)
Liver metastasis Yes | 40/66 | 55/74 | 0.60 (0.40–0.90)
Liver metastasis No | 99/201 | 119/191 | 0.62 (0.47–0.81)
Peritoneal metastasis Yes | 87/163 | 108/148 | 0.50 (0.37–0.66)
Peritoneal metastasis No | 52/104 | 66/117 | 0.78 (0.54–1.12)
Prior gastrectomy Yes | 49/110 | 70/111 | 0.45 (0.31–0.65)
Prior gastrectomy No | 90/157 | 104/154 | 0.76 (0.57–1.01)
Line of therapy 2L | 54/89 | 52/88 | 0.88 (0.60–1.30)
Line of therapy 3L+ | 85/178 | 122/177 | 0.47 (0.36–0.62)
Favours Sone-Ve 2.2 mg/kg | Favours Investigator's choice of therapy
OS HR point estimates favoured Sone-Ve versus investigator's choice of therapy across most clinically relevant subgroups in the ITT population
All subgroups were prespecified in the protocol. The analysis was based on the Kaplan-Meier technique and was performed using an unstratified Cox proportional hazards model. The overall HR was calculated using a stratified Cox proportional hazards model, adjusting for Interactive Response Technology strata, including prior gastrectomy, region and line of therapy and using an implemented pooling strategy per the statistical analysis plan with treatment as the only covariate. Ties were handled by the Efron approach. CIs were calculated using a profile likelihood approach. A HR below 1 favours Sone-Ve. Because PFS and OS were the only endpoints that were part of the multiple testing procedure, the widths of the CIs for subgroups have not been adjusted for multiplicity and may not be used in place of hypothesis testing. EAC, oesophageal adenocarcinoma; ECOG PS, Eastern Cooperative Oncology Group performance status; GEJC, gastroesophageal junction adenocarcinoma; RoW, rest of world.
Rui-Hua Xu
CLARITY-Gastric01
[Slide 4]
PFS by BICR in ITT and in 3L+
Dual-primary endpoint: PFS by BICR in ITT
| Sone-Ve 2.2 mg/kg (n=267) | Investigator's choice of therapy (n=265)
Median PFS (95% CI), months | 4.2 (3.5–5.3) | 3.8 (3.0–4.2)
HR (95% CI) | 0.77 (0.62–0.96)
P-value | 0.053193
No. of patients at risk (0–24 by 3): Sone-Ve 267 133 76 39 15 4 3 0 0; Investigator's choice 265 114 45 23 10 2 1 0 0
Secondary endpoint: PFS by BICR in 3L+
| Sone-Ve 2.2 mg/kg (n=178) | Investigator's choice of therapy (n=177)
Median PFS (95% CI), months | 4.1 (3.0–5.3) | 2.7 (2.4–3.0)
HR (95% CI) | 0.56 (0.43–0.74)
No. of patients at risk (0–24 by 3): Sone-Ve 178 82 46 24 7 2 2 0 0; Investigator's choice 177 53 13 5 1 1 0 0 0
In the ITT population, Sone-Ve showed a positive trend for PFS by BICR, but did not meet the threshold for statistical significance
In the 3L+ population, Sone-Ve improved PFS by BICR versus investigator's choice of therapy*
*Not formally tested. The HR for event or death and CI were estimated from a stratified Cox proportional-hazards model with ties = Efron. Stratification variables were geographical region, prior gastrectomy and line of therapy. The CI was calculated using a profile likelihood approach. A HR of less than 1 favours Sone-Ve. Tick marks indicate censored observations. BICR, blinded independent central review.
Rui-Hua Xu
CLARITY-Gastric01
Survival table
Endpoint: PFS by BICR (ITT dual primary; 3L+ secondary)
Arm | N | Median | Median CI
ITT: Sone-Ve 2.2 mg/kg | 267 | 4.2 | 3.5–5.3
ITT: Investigator's choice | 265 | 3.8 | 3.0–4.2
3L+: Sone-Ve 2.2 mg/kg | 178 | 4.1 | 3.0–5.3
3L+: Investigator's choice | 177 | 2.7 | 2.4–3.0
HR: ITT 0.77; 3L+ 0.56
HR CI: ITT 0.62–0.96; 3L+ 0.43–0.74
P: ITT 0.053193 (not significant); 3L+ not formally tested
Summary of results: CLARITY-Gastric01i
Sone-Ve | Investigator's choice
3L+ (n=178) | (n=177)
OS
Number of deaths, n | 85 | 122
Median OS (95% CI) (in months) | 10.0 (7.2–11.4) | 5.0 (4.2–6.4)
HR (95% CI)ii | 0.47 (0.36–0.62)
p-value | p<0.000001
OS rate at 12 months (%) | 38.1 | 18.1
ITT (2L+) (n=267) | (n=265)
OS
Number of deaths, n | 139 | 174
Median OS (95% CI) (in months) | 10.6 (9.1–12.0) | 6.4 (5.8–7.6)
HR (95% CI)ii | 0.58 (0.47–0.73)
p-value | p<0.000004
HR, CLDN18.2 ≥75% (95% CI)ii, iii | 0.59 (0.45–0.78)
HR, CLDN18.2 ≥25–<75% (95% CI)ii, iii | 0.63 (0.42–0.94)
OS rate at 12 months (%) | 42.6 | 27.8
PFS by BICR
Median PFS (95% CI) (in months) | 4.2 (3.5–5.3) | 3.8 (3.0–4.2)
HR (95% CI)ii | 0.77 (0.62–0.96)
p-value | p=0.053193
PFS by investigatoriv
Median PFS (95% CI) (in months) | 4.4 (3.8-5.7) | 3.0 (2.7-4.1)
HR (95% CI)ii | 0.59 (0.48-0.73)
i OS and PFS data cut-off was 31 May 2026
ii Estimated from a stratified Cox proportional-hazards model with ties = Efron. The CI was calculated using a profile likelihood approach
iii Tumour cells with membranous staining at any intensity
iv Exploratory endpoint
Response data: response and disease control in ITT, Rui-Hua Xu
🔥Presidential session at ESMO 2026 🔥
CLARITY-Gastric 01: Ph 3 of sonesitatug vedotin in 2L+ CLDN18.2-positive GEC
#ESMO26 #ESMOAmbassadors
👉ORR: 23 vs 13%
👉mPFS: 4.2 vs 3.8 mo
👉mOS: 10 vs 5 mo
👉No new safety signals
🧐 exciting results, new option for 2L+ CLDN18.2+ pts
@myESMO @ASCO
Response and disease control in ITT
ORR risk difference estimate (95% CI): 10.2 (2.68–17.83)
ORR 23.3% (Sone-Ve) | ORR 13.8% (Investigator's choice) [stacked CR/PR bars]
Disease control rate 70.4% | Disease control rate 55.6%
| Sone-Ve 2.2 mg/kg | Investigator's choice of therapy
Patients with measurable disease at baseline | 189 | 189
Confirmed ORR, n (%) | 44 (23.3) | 26 (13.8)
Complete response, n (%) | 7 (3.7) | 1 (0.5)
Disease control rate, n (%) | 133 (70.4) | 105 (55.6)
Median duration of response, months (95% CI)* | 8.5 (5.8–NC) | 6.8 (2.9–NC)
Sone-Ve demonstrated higher response and disease control rates, and longer duration of response versus investigator's choice of therapy
More participants achieved complete response with Sone-Ve versus investigator's choice of therapy
*Duration of response by BICR is calculated in all randomised patients in each arm (Sone-Ve n=267; Investigator's choice of therapy, n=265). BICR, blinded independent central review; CR, complete response; NC, not calculated; ORR, objective response rate; PR, partial response.
Rui-Hua Xu
CLARITY-Gastric01
CLARITY- Gastric 01 (CG-01) Phase III AZD-0901 (Sone-Ve) in 2L+ met #Claudin 18.2 (+) in #Gastroesophageal #cancer vs. investigators choice (N=594)
Primary endpoints: PFS + OS
🔹OS: 10M vs. 5M (HR = 0.47) 👏
🔹12M OS: 38.1% vs. 18.1%, HR = 0.47 (3rd line)
🔹 12M 42.6% in 2nd line
🔹 ORR: 23.3% vs. 13.8%
🔹PFS: HR = 0.77 was NS in 2L+
🔹PFS: HR = 4.1 vs. 2.7M; HR = 0.56 in 3L+
🔹Need more data in the 2L setting; largest benefit seen in 3L+ setting
#ESMO2026 @OncoAlert #cancerresearch @AstraZeneca
OS by CLDN18.2 expression levels in ITT
CLDN18.2 ≥75% expression
| Sone-Ve 2.2 mg/kg (n=183) | Investigator's choice of therapy (n=194)
Median OS (95% CI), months | 10.6 (8.1–13.5) | 6.4 (5.6–8.0)
HR (95% CI) | 0.59 (0.45–0.78)
No. of patients at risk (0–27 by 3): Sone-Ve 183 152 107 70 31 17 9 4 0 0; Investigator's choice 194 146 85 48 27 9 5 2 0 0
CLDN18.2 ≥25% to <75% expression
| Sone-Ve 2.2 mg/kg (n=83) | Investigator's choice of therapy (n=71)
Median OS (95% CI), months | 10.5 (7.1–12.4) | 6.2 (4.3–8.8)
HR (95% CI) | 0.63 (0.42–0.94)
No. of patients at risk (0–27 by 3): Sone-Ve 83 74 51 37 18 9 5 2 1 0; Investigator's choice 71 51 29 19 10 5 3 3 1 0
OS benefit with Sone-Ve vs investigator's choice of therapy was consistent across CLDN18.2 expression levels
The HR and CI were estimated from a stratified Cox proportional-hazards model with ties = Efron. Stratification variables were geographical region, prior gastrectomy and line of therapy. The CI was calculated using a profile likelihood approach. A HR of less than 1 favours Sone-Ve. Tick marks indicate censored observations.
Rui-Hua Xu
CLARITY-Gastric01
Survival table
Endpoint: OS by CLDN18.2 expression (ITT)
Arm | N | Median | Median CI
≥75%: Sone-Ve 2.2 mg/kg | 183 | 10.6 | 8.1–13.5
≥75%: Investigator's choice | 194 | 6.4 | 5.6–8.0
≥25% to <75%: Sone-Ve 2.2 mg/kg | 83 | 10.5 | 7.1–12.4
≥25% to <75%: Investigator's choice | 71 | 6.2 | 4.3–8.8
HR: ≥75%: 0.59; ≥25-<75%: 0.63
HR CI: ≥75%: 0.45–0.78; ≥25-<75%: 0.42–0.94
ESMO 2026 Presidential2 | CLARITY-Gastric 01:
Phase III: Sonesitatug vedotin vs investigator's choice in previously treated CLDN18.2+ advanced gastroesophageal cancer (n=532).
📊 Key results:
✅ 3L+ median OS: 10.0 vs 5.0 months (HR 0.47; p<0.001)
✅ 2L+ median OS: 10.6 vs 6.4 months (HR 0.58; p<0.001)
⚠️ Median PFS: 4.2 vs 3.8 months (HR 0.77; p=0.05) — did not meet statistical significance threshold.
✅ Grade ≥3 TRAEs: 36.4% vs 44.8%
🔥 53% reduction in risk of death in 3L+!
Notably, OS benefit was observed even with lower CLDN18.2 expression (≥25% to <75%).
A striking OS benefit despite a modest, statistically nonsignificant PFS improvement.
Could this ADC redefine later-line treatment of gastric cancer?
@myESMO @OncoAlert
#ESMO26 #GastricCancer #ADC
[Slide 1]
Proffered Paper session
LBA7 - CLARITY-Gastric 01 (CG-01): A phase 3 study of sonesitatug vedotin (Sone-Ve) in second or later-line (2L+) advanced or metastatic Claudin 18.2 (CLDN18.2)-positive gastroesophageal carcinoma (GEC)
Speakers Rui-Hua Xu (Guangzhou, China)
Lecture Time 17:18 - 17:30
Abstract
Background
CLDN18.2 is a validated therapeutic target in advanced GEC. Sone-Ve, a CLDN18.2-targeting monomethyl auristatin E–based antibody drug conjugate, demonstrated clinical activity in phase 1/2 studies of advanced GEC.
[Slide 2]
Methods
CG-01 is a randomised, open-label, global, phase 3 study of Sone-Ve vs investigator's choice of therapy (INV) after ≥1 prior therapy for GEC expressing CLDN18.2 in ≥25% tumour cells with membranous staining at any intensity. Participants (pts) with 2L+ unresectable, locally advanced/metastatic CLDN18.2-positive GEC (intent-to-treat population: ITT) were initially randomised 1:1:1 to Sone-Ve 1.8 mg/kg, Sone-Ve 2.2 mg/kg or INV. Post-dose selection, pts were randomised 1:1 to Sone-Ve 2.2 mg/kg or INV (2L: ramucirumab + paclitaxel, paclitaxel, or docetaxel; 3L+: irinotecan, trifluridine/tipiracil, or apatinib [China only]). Randomisation was stratified by region, prior gastrectomy and line of therapy. Dual primary endpoints are OS in 3L+ and progression-free survival (PFS) by BICR in ITT. Key secondary endpoint is OS in ITT.
[Slide 3]
Proffered Paper session
| 3L+ Sone-Ve (n=178) | INV (n=177)
Median OS (95% CI), mo | 10.0 (7.2–11.4) | 5.0 (4.2–6.4)
HR (95% CI) | 0.47 (0.36–0.62) |
p-value | <0.001 |
| ITT (2L+) (n=267) | (n=265)
Median OS (95% CI), mo | 10.6 (9.1–12.0) | 6.4 (5.8–7.6)
HR (95% CI) | 0.58 (0.47–0.73) |
p-value | <0.001 |
Median PFS by BICR (95% CI), mo | 4.2 (3.5–5.3) | 3.8 (3.0–4.2)
HR (95% CI) | 0.77 (0.62–0.96) |
p-value | 0.05 |
| SAS* (n=261) | (n=252)
TRAE, n (%) | |
Any | 224 (85.8) | 205 (81.3)
Grade ≥3 | 95 (36.4) | 113 (44.8)
Gastrointestinal toxicity | 29 (11.1) | 16 (6.3)
Haematology | 20 (7.7) | 40 (15.9)
Leading to death | 3 (1.1) | 2 (0.8)
Leading to discontinuation | 8 (3.1) | 11 (4.4)
*SAS, safety analysis set; all pts who received ≥1 dose. TRAE, treatment-related adverse event.
[Slide 4]
Conclusions
CG-01 showed a significant OS benefit with Sone-Ve vs INV in 3L+ and ITT, with a manageable safety profile. These findings support Sone-Ve as a potential 2L+ treatment for a broad patient population with advanced CLDN18.2-positive GEC.
1) Slide: OS in 3L+ (livestream capture, Rui-Hua Xu) · 2) Kaplan-Meier survival data: PFS by BICR and by investigator · 3) Response data: response and disease control in ITT · 4) Safety data: most common adverse events (any grade and grade ≥3)
#ESMO26 🚀 CLARITY-Gastric01 | Phase III
🧬 CLDN18.2+ GEC | Sone-Ve vs SOC
🏆 OS benefit:
🔹 3L+: 10.0 vs 5.0 mo (HR 0.47)
🔹 2L+: 10.6 vs 6.4 mo (HR 0.58)
🎯 ORR: 23.3% vs 13.8%
⚠️ PFS: HR 0.77 (NS)
✅ G≥3 TRAEs: 36.4% vs 44.8%
💡 Potential new SOC in 2L+!
@OncoAlert https://t.co/Rx8rIGBoS8
[Slide 1]
16:30 - 18:15 Presidential Symposium II
CHAIRS: GIUSEPPE CURIGLIANO, YELENA JANJIGIAN
OS in 3L+
Dual-primary endpoint: OS in 3L+
| Sone-Ve 2.2 mg/kg (n=178) | Investigator's choice of therapy (n=177)
Median OS (95% CI), months | 10.0 (7.2–11.4) | 5.0 (4.2–6.4)
HR (95% CI) | 0.47 (0.36–0.62)
P-value | <0.000001
12-month OS: 38.1% vs 18.1%
No. patients at risk (0–27 mo by 3)
Sone-Ve 2.2 mg/kg | 178 146 95 59 19 7 3 1 0 0
Investigator's choice of therapy | 177 117 58 24 14 6 2 2 1 0
Sone-Ve significantly improved OS versus investigator's choice of therapy in the 3L+ population
Rui-Hua Xu
CLARITY-Gastric 01 (CG-01): A phase 3 study of sonesitatug vedotin (Sone-Ve) in second or later-line (2L+) advanced or metastatic Claudin 18.2 (CLDN18.2)-positive gastroesophageal carcinoma (GEC)
ALICANTE AUDITORIUM - HALL 6
Survival table
Endpoint: OS in 3L+ (dual primary)
Arm | N | Median | Median CI
Sone-Ve 2.2 mg/kg | 178 | 10.0 | 7.2–11.4
Investigator's choice of therapy | 177 | 5.0 | 4.2–6.4
HR: 0.47
HR CI: 0.36–0.62
P: <0.000001
Landmark rates:
12 months: Sone-Ve 2.2 mg/kg 38.1% | Investigator's choice of therapy 18.1%
[Slide 2]
16:30 - 18:15 Presidential Symposium II
CHAIRS: GIUSEPPE CURIGLIANO, YELENA JANJIGIAN
PFS by BICR and PFS by investigator in ITT
Dual-primary endpoint: PFS by BICR in ITT
| Sone-Ve 2.2 mg/kg (n=267) | Investigator's choice of therapy (n=265)
Median PFS (95% CI), months | 4.2 (3.5–5.3) | 3.8 (3.0–4.2)
HR (95% CI) | 0.77 (0.62–0.96)
P-value | 0.053193
No. of patients at risk (0–24 by 3): Sone-Ve 267 133 76 39 15 4 3 0 0; Investigator's choice 265 114 45 23 10 2 1 0 0
Exploratory endpoint: PFS by investigator in ITT
| Sone-Ve 2.2 mg/kg (n=267) | Investigator's choice of therapy (n=265)
Median PFS (95% CI), months | 4.4 (3.8–5.7) | 3.0 (2.7–4.1)
HR (95% CI) | 0.59 (0.48–0.73)
No. of patients at risk (0–24 by 3): Sone-Ve 267 151 91 48 20 7 4 1 0; Investigator's choice 265 111 44 23 12 2 1 0 0
PFS assessment by investigator showed a more pronounced treatment effect (HR 0.59) than BICR, consistent with the observed OS benefit
Rui-Hua Xu
CLARITY-Gastric 01 (CG-01): A phase 3 study of sonesitatug vedotin (Sone-Ve) in second or later-line (2L+) advanced or metastatic Claudin 18.2 (CLDN18.2)-positive gastroesophageal carcinoma (GEC)
ALICANTE AUDITORIUM - HALL 6
Survival table
Endpoint: PFS in ITT by BICR (dual primary) and by investigator (exploratory)
Arm | N | Median | Median CI
BICR: Sone-Ve 2.2 mg/kg | 267 | 4.2 | 3.5–5.3
BICR: Investigator's choice | 265 | 3.8 | 3.0–4.2
Investigator-assessed: Sone-Ve 2.2 mg/kg | 267 | 4.4 | 3.8–5.7
Investigator-assessed: Investigator's choice | 265 | 3.0 | 2.7–4.1
HR: BICR 0.77; investigator 0.59
HR CI: BICR 0.62–0.96; investigator 0.48–0.73
P: BICR 0.053193; investigator-assessed exploratory, no p
[Slide 3]
16:30 - 18:15 Presidential Symposium II
CHAIRS: GIUSEPPE CURIGLIANO, YELENA JANJIGIAN
Response and disease control in ITT
ORR risk difference estimate (95% CI): 10.2 (2.68–17.83)
ORR 23.3% (CR, PR) | ORR 13.8% (CR, PR)
Disease control rate 70.4% | Disease control rate 55.6%
| Sone-Ve 2.2 mg/kg | Investigator's choice of therapy
Patients with measurable disease at baseline | 189 | 189
Confirmed ORR, n (%) | 44 (23.3) | 26 (13.8)
Complete response, n (%) | 7 (3.7) | 1 (0.5)
Disease control rate, n (%) | 133 (70.4) | 105 (55.6)
Median duration of response, months (95% CI)* | 8.5 (5.8–NC) | 6.8 (2.9–NC)
Sone-Ve demonstrated higher response and disease control rates, and longer duration of response versus investigator's choice of therapy
More participants achieved complete response with Sone-Ve versus investigator's choice of therapy
*Duration of response by BICR is calculated in all randomised patients in each arm (Sone-Ve n=267; Investigator's choice of therapy, n=265). BICR, blinded independent central review; CR, complete response; NC, not calculated; ORR, objective response rate; PR, partial response.
Rui-Hua Xu
CLARITY-Gastric 01 (CG-01): A phase 3 study of sonesitatug vedotin (Sone-Ve) in second or later-line (2L+) advanced or metastatic Claudin 18.2 (CLDN18.2)-positive gastroesophageal carcinoma (GEC)
ALICANTE AUDITORIUM - HALL 6
[Slide 4]
16:30 - 18:15 Presidential Symposium II
CHAIRS: GIUSEPPE CURIGLIANO, YELENA JANJIGIAN
Most common adverse events
Most common AEs of any Grade (Sone-Ve n=261 | Investigator's choice of therapy n=252)
Nausea 54.4% | 26.6%
Decreased appetite 43.3% | 24.2%
Vomiting 41.0% | 24.6%
Anemia 29.9% | 40.9%
Weight decreased 28.0% | 11.9%
Constipation 24.5% | 13.1%
Fatigue 24.1% | 19.8%
Neutropenia 23.8% | 39.7%
Diarrhea 23.0% | 25.4%
Hypoalbuminemia 21.8% | 14.7%
Most common Grade ≥3 AEs
Neutropenia 10.3% | 25.4%
Decreased appetite 9.6% | 1.6%
Anemia 8.4% | 11.1%
Nausea 6.9% | 2.8%
Neutrophil count decreased 6.9% | 18.7%
Vomiting 6.1% | 2.8%
Fatigue 4.2% | 3.6%
Pulmonary embolism 4.2% | 1.6%
Pneumonia 3.4% | 2.8%
Weight decreased 3.4% | 0.8%
Lymphocyte count decreased 3.1% | 3.2%
Higher rates of GI-related AEs were observed with Sone-Ve versus investigator's choice of therapy
Lower rates of haematologic toxicity were observed with Sone-Ve versus investigator's choice of therapy
Safety was assessed in the Safety Analysis Set, defined as all patients who received ≥1 dose of treatment. [...] Any Grade peripheral neuropathy occurred in 56 (21.5%) patients in the Sone-Ve arm and 36 (14.3%) patients in the investigator's choice of therapy arm; Grade ≥3 peripheral neuropathy occurred in 2 (0.8%) patients in the Sone-Ve arm and 1 (0.4%) patients in the investigator's choice of therapy arm. Any Grade alopecia occurred in 13 (5.0%) of patients in the Sone-Ve arm and 36 (14.3%) in investigator's choice of therapy arm.
Rui-Hua Xu
CLARITY-Gastric 01 (CG-01): A phase 3 study of sonesitatug vedotin (Sone-Ve) in second or later-line (2L+) advanced or metastatic Claudin 18.2 (CLDN18.2)-positive gastroesophageal carcinoma (GEC)
ALICANTE AUDITORIUM - HALL 6
1) Slide: conclusions, Rui-Hua Xu (Presidential Symposium II livestream) · 2) Slide: Al-Batran discussant LBA7: My Conclusions (livestream) · 3) Kaplan-Meier survival data: Al-Batran discussant: OS in third-line and later
Clarity Gastric 01 . New player in Claudine 18.2 sector . Sone-Ve.
Face off with zolbetuximab ? @OncBrothers @OncoAlert @myESMO #ESMO26 https://t.co/NOGn87EK8f
[Slide 1]
16:30 - 18:15 Presidential Symposium II
CHAIRS: GIUSEPPE CURIGLIANO, YELENA JANJIGIAN
Conclusions
CLARITY-Gastric01 is the first global, Phase 3 trial to demonstrate a statistically significant OS benefit and a manageable safety profile with a CLDN18.2 targeting antibody-drug conjugate in patients with previously treated advanced or metastatic CLDN18.2-positive GEC (defined as ≥25% tumour cells with membraneous staining at any intensity)
Sone-Ve showed a statistically significant and clinically meaningful improvement in OS versus investigator's choice of therapy
• Median OS was doubled to 10 months in the 3L+ population and improved by over 4 months to 10.6 months in the ITT (2L+) population
• OS benefit was maintained across CLDN18.2 expression subgroups
PFS by BICR in ITT (HR 0.77) did not reach the threshold for statistical significance
• PFS by BICR in 3L+ was improved with Sone-Ve versus investigator's choice of therapy (HR 0.56)
• Assessment of PFS by investigator in ITT showed a more pronounced treatment effect (HR 0.59) than by BICR
Sone-Ve demonstrated a differentiated and manageable safety profile versus investigator's choice of therapy
Sone-Ve is a potential new standard of care in the 2L+ setting for patients with advanced or metastatic CLDN18.2-positive gastroesophageal carcinoma
2L, second- or later-line; 3L+, third- or later-line; BICR, blinded independent central review; CLDN18.2, Claudin18 isoform 2; HR, hazard ratio; ITT, intent-to-treat; OS, overall survival; PFS, progression-free survival; Sone-Ve, sonesitatug vedotin.
Rui-Hua Xu
CLARITY-Gastric01
ALICANTE AUDITORIUM - HALL 6
[Slide 2]
16:30 - 18:15 Presidential Symposium II
CHAIRS: GIUSEPPE CURIGLIANO, YELENA JANJIGIAN
My Conclusions
Sone-Ve represents an important therapeutic advance in gastroesophageal carcinoma.
• ≥3L: Impressive efficacy in a setting of high unmet need.
• 2L: Potential benefit, but more data needed, particularly versus ramucirumab/paclitaxel.
• Study design: Combining 2L and ≥3L complicates clinical interpretation.
• Safety: Manageable, but GI toxicity remains relevant.
• Future: First-line trials ongoing; curative setting should be a next step
Salah-Eddin Al-Batran
ALICANTE AUDITORIUM - HALL 6
[Slide 3]
16:30 - 18:15 Presidential Symposium II
CHAIRS: GIUSEPPE CURIGLIANO, YELENA JANJIGIAN
OS in ITT
Key secondary endpoint: OS in ITT
Sone-Ve 2.2 mg/kg (n=267) | Investigator's choice of therapy (n=265)
Median OS (95% CI), months: 10.6 (9.1–12.0) | 6.4 (5.8–7.6)
HR (95% CI): 0.58 (0.47–0.73)
P-value: 0.000004
12-month OS: 42.6% (Sone-Ve) | 27.8% (Investigator's choice)
No. of patients at risk (months 0,3,6,9,12,15,18,21,24,27)
Sone-Ve 2.2 mg/kg: 267 | 227 | 159 | 107 | 49 | 26 | 14 | 6 | 1 | 0
Investigator's choice of therapy: 265 | 197 | 114 | 67 | 37 | 14 | 8 | 5 | 1 | 0
Sone-Ve significantly improved OS versus investigator's choice of therapy in the ITT population
The HR and CI were estimated from a stratified Cox proportional-hazards model with ties = Efron. Stratification variables were geographical region, prior gastrectomy and line of therapy. The CI was calculated using a profile likelihood approach. A HR of less than 1 favours Sone-Ve. Tick marks indicate censored observations.
Rui-Hua Xu
CLARITY-Gastric01
ALICANTE AUDITORIUM - HALL 6
Survival table
Endpoint: OS in ITT (key secondary)
Arm | N | Median | Median CI
Sone-Ve 2.2 mg/kg | 267 | 10.6 | 9.1–12.0
Investigator's choice of therapy | 265 | 6.4 | 5.8–7.6
HR: 0.58
HR CI: 0.47–0.73
P: 0.000004
Landmark rates:
12 months: Sone-Ve 2.2 mg/kg 42.6% | Investigator's choice of therapy 27.8%
As co-author, excited to share CLARITY-Gastric01 data. Sone-Ve showed a meaningful survival benefit for pts with previously treated CLDN18.2-positive GC/GEJ cancers, reinforcing CLDN18.2 as a key therapeutic target beyond the frontline setting. #ESMO2026 #GIOncology https://t.co/P1Y1RqW4i2
Background
• CLDN18.2, a tight junction protein that is expressed in 40–80% of gastroesophageal carcinomas depending on [the] threshold for positivity assessed, has emerged as a validated therapeutic target1–3
• In the 2L setting, median OS is <10 months with ramucirumab plus paclitaxel, whereas single chemotherapeu[tic] options in the 3L+ setting are associated with an OS benefit of <6 months4,5
• No CLDN18.2-targeted therapies are approved globally for 2L+ therapy
• Sone-Ve is a first-in-class CLDN18.2-targeted antibody-drug conjugate comprised of a CLDN18.2-directe[d] antibody conjugated to the microtubule-disrupting payload MMAE via a protease cleavable linker6
Here, we present the results of the global Phase 3 CLARITY-Gastric01 trial (NCT06346392) evaluat[ing] Sone-Ve versus investigator's choice of therapy in patients with 2L+ advanced or metastatic CLDN18.2 (≥25% tumour cells with membranous staining at any intensity) gastroesophageal carcinoma
[references illegible]
Rui-Hua Xu
1) Slide: baseline characteristics (ITT), Rui-Hua Xu · 2) Slide: OS subgroup analysis (forest plot) in 3L+, Rui-Hua Xu
🎯 #ESMO26 CLARITY-Gastric01 (ph III): sone-ve (CLDN18.2 ADC) vs TPC in 2L+ gastric/GEJ with CLDN18.2 ≥25% (any intensity)
📈 3L+ OS 10.0 vs 5.0 mo (HR 0.47)
📈 ITT OS 10.6 vs 6.4 mo (HR 0.58); 2L HR 0.88
🧬 Benefit at ≥75% and 25–74% expression
⚠️ Less heme tox, more GI tox https://t.co/0n6cZfKqh5
[Slide 2]
Baseline characteristics
Characteristic | Sone-Ve 2.2 mg/kg (n=267) | Investigator's choice of therapy (n=265)
Median age (range), years | 57 (24 to 82) | 57 (24 to 82)
Male sex, n (%) | 150 (56.2) | 159 (60.0)
Region, n (%)
Japan or South Korea | 55 (20.6) | 54 (20.4)
Other Asia | 107 (40.1) | 106 (40.0)
Rest of world | 105 (39.3) | 105 (39.6)
Primary tumour location, n (%)
Stomach | 213 (79.8) | 194 (73.2)
Gastroesophageal junction/Esophagus | 54 (20.2) | 71 (26.8)
Peritoneal metastasis, Yes, n (%) | 163 (61.0) | 148 (55.8)
CLDN18.2 expression,* n (%)
<25% | 1 (0.4)‡ | 0
≥25–<75% | 83 (31.1) | 71 (26.8)
≥75% | 183 (68.5) | 194 (73.2)
Prior gastrectomy, Yes, n (%) | 98 (36.7) | 93 (35.1)
Line of therapy,† n (%)
2L | 90 (33.7) | 88 (33.2)
3L+ | 177 (66.3) | 177 (66.8)
Prior anti-CLDN18.2 mAb, n (%)
Zolbetuximab | 10 (3.7) | 7 (2.6)
Other | 8 (3.0) | 1 (0.4)
Demographics and baseline disease characteristics were generally balanced across treatment arms in the ITT population
*Expression in tumour cells with membranous staining at any intensity; †Line of therapy data are from the clinical reporting form and the number of patients in the sonesitatug vedotin arm differs from the equivalent data in the IRT due to mis-stratification in the clinical reporting form (IRT: 2L, n=89); ‡One patient had negative CLDN18.2 result but was randomised. IRT, interactive reporting technology software; mAb, monoclonal antibody.
Rui-Hua Xu
CLARITY-Gastric01
[Slide 4]
OS subgroup analysis in 3L+
Subgroup | Sone-Ve 2.2 mg/kg (No. of events/total no. of patients) | Investigator's choice of therapy | Hazard ratio (95% CI)
All patients | 85/178 | 122/177 | 0.47 (0.36–0.62)
Age: ≥18–<65 years | 60/130 | 90/132 | 0.45 (0.32–0.62)
Age: ≥65 years | 25/48 | 32/45 | 0.57 (0.34–0.98)
Sex: Female | 30/79 | 46/72 | 0.42 (0.26–0.66)
Sex: Male | 55/99 | 76/105 | 0.53 (0.37–0.74)
Region: Japan & S. Korea | 13/40 | 25/41 | 0.39 (0.19–0.77)
Region: Other Asia | 38/74 | 58/73 | 0.42 (0.28–0.63)
Region: RoW | 34/64 | 39/63 | 0.61 (0.38–0.97)
ECOG PS: 0 | 24/58 | 33/61 | 0.50 (0.29–0.85)
ECOG PS: 1 | 61/120 | 89/116 | 0.45 (0.32–0.63)
Primary tumour: Gastric | 63/141 | 95/137 | 0.43 (0.31–0.59)
Primary tumour: GEJC/EAC | 22/37 | 27/40 | 0.63 (0.36–1.11)
No. of organ metastases: 0–2 | 49/117 | 73/120 | 0.50 (0.34–0.71)
No. of organ metastases: ≥3 | 36/61 | 49/57 | 0.40 (0.25–0.61)
Liver metastasis: Yes | 27/47 | 41/54 | 0.53 (0.32–0.85)
Liver metastasis: No | 58/131 | 81/123 | 0.46 (0.32–0.64)
Peritoneal metastasis: Yes | 55/117 | 77/100 | 0.31 (0.22–0.45)
Peritoneal metastasis: No | 30/61 | 45/77 | 0.80 (0.50–1.27)
Prior gastrectomy: Yes | 31/78 | 51/79 | 0.33 (0.21–0.52)
Prior gastrectomy: No | 54/100 | 71/98 | 0.61 (0.43–0.87)
Favours Sone-Ve 2.2 mg/kg <- 1 -> Favours Investigator's choice of therapy
OS HR point estimates favoured Sone-Ve versus investigator's choice of therapy across all clinically relevant subgroups in the 3L+ population
All subgroups were prespecified in the protocol. The analysis was based on the Kaplan-Meier technique and was performed using an unstratified Cox proportional hazards model. The overall HR was calculated using a stratified Cox proportional hazards model, adjusting for Interactive Response Technology strata, including prior gastrectomy, region and line of therapy and using an implemented pooling strategy per the statistical analysis plan with treatment as the only covariate. Ties were handled by the Efron approach. CIs were calculated using a profile likelihood approach. A HR below 1 favours Sone-Ve. Because PFS and OS were the only endpoints that were part of the multiple testing procedure, the widths of the CIs for subgroups have not been adjusted for multiplicity and may not be used in place of hypothesis testing. EAC, oesophageal adenocarcinoma; ECOG PS, Eastern Cooperative Oncology Group performance status; GEJC, gastroesophageal junction adenocarcinoma; RoW, rest of world.
Rui-Hua Xu
CLARITY-Gastric01
1) Slide: LBA7 title slide: sonesitatug vedotin in 2L+ Claudin 18.2-positive · 2) Trial design schema: ADCs in PDAC: Claudin 18.2 as a target, sonesitatug
#gastriccancer #pancreaticcancer #esmo2026 #pancan #communityoncology #aonOncology #Drsammikhail Sone-V showing positive data in 2nd/3rd line in gastric/GEJ Claudin positive cancers and now being investigated in others including Pancreas cancer. The more options, the better! https://t.co/OyMGzRQeWJ
[Slide 1]
MADRID 2026 ESMO congress
CLARITY-Gastric01: a Phase 3 study of sonesitatug vedotin (Sone-Ve, AZD0901) in second or later-line advanced or metastatic Claudin 18.2-positive gastroesophageal carcinoma
Rui-Hua Xu,1 Yelena Janjigian,2 Ming-Huang Chen,3 Jeeyun Lee,4 Jun Zhang,5 Elena Elimova,6 Elizabeth Smyth,7 Thorsten Oliver Goetze,8 Weijian Guo,9 Mitsuhiro Furuta,10 Keun-Wook Lee,11 Giang Nguyen,12 Filippo Pietrantonio,13 Maria Carmen Riesco Martínez,14 Anthony Turpin,15 Dani Castillo,16 Jiabu Ye,17 Silver Liu,17 Nicola Valeri,18 Kohei Shitara19
Final Publication Number: LBA7
A copy of these slides [and] plain language summar[y can] be accessed via this qu[ick] response (QR) code
[Slide 2]
ESMO congress
ADCs in PDAC
Claudin 18.2 as a target
Sonesitatug vedotin (Sone-Ve) is an ADC that targets CLDN 18.2 with a MMAE as a payload.
CLARITY-PanTumor01: A phase 2 trial of the claudin 18.2-specific antibody-drug conjugate AZD0901 (CMG901) in patients with CLDN18.2-expressing advanced solid tumors.
NCT06219941
Raufi et al, presented at 2024 ASCO Meeting
[Arm schematic text illegible]
1) Trial design schema: phase 2 study design (dostarlimab, dMMR/MSI-H rectal cancer) · 2) Slide: rationale: NOM of dMMR tumours, Cercek NEJM 2025 (Prof David Tougeron)
AZUR-1 delivers. #ESMO26
Phase 2, single arm. Dostarlimab x 9 cycles (6 months) in untreated stage II/III dMMR/MSI-H rectal cancer, 154 patients.
Cercek's 49-patient NEJM cohort gone global.
No control arm, because randomizing these patients to TNT/TME isn't equitable.
cCR12 (complete response held 12+ months, no further treatment): 68% by investigator. 26% needed additional treatment 10% went to surgery
68% is likely lower than reality since many patients probably just needed more time to radiographically respond. Using PET/Biopsy/ctDNA, especially ctDNA, is incredibly helpful in my practice to identify patients who can avoid TME even if a fibrotic tumor remains as they often do.
FDA already gave accelerated approval (way to steal the ESMO thunder) last week which leads me to my next point.
Obvious new standard of care. You should go to oncology jail if you don't treat MSI-H with IO.
@OncoAlert @TheGutOncLab @Onco_Nexus
[Slide 1]
AZUR-1: Phase 2 Study A single-arm, open label study of dostarlimab monotherapy in participants with untreated stage 2/3 MMR-D/MSI-H locally advanced rectal cancer.
Inclusion criteria1
• Adults aged ≥ 18 years
• Histologically confirmed stage II–III (T3–T4, N0, or T any, N+), locally advanced rectal cancer
• Radiologically and endoscopically evaluable disease
• ECOG PS 0–1
• Tumor that can be categorized as dMMR or MSI-H by local or central assessment
Exclusion criteria1
• Distant metastatic disease
• Prior radiation therapy, systemic therapy, or surgery for the management of rectal cancer
• Tumor-caused symptomatic bowel obstruction
• Participant has any history of interstitial lung disease or pneumonitis
• Any irAE of Grade ≥ 3, immune-related severe neurologic events, exfoliative dermatitis of any grade, or myocarditis from prior immunotherapy
• Malignancy that has progressed or required active treatment ≤ 2 years
Overview of Study Design
Phase 2, open-label, single-arm study1-2 (N = 150)
Dostarlimab 500 mg IV Q3W × 9 cycles → EOT response assessment → < cCR: SoC, +/− surgery (if needed); cCR: Non-operative management
6 weeks | 12 weeks
Disease assessments: • 6 weeks, 12 weeks, EOT, then – Q4 months in Years 1–3 – Q6 months in Years 4–5
Endpoints1
Primary: • Proportion who sustain cCR for 12 months by ICR
Secondary: • Sustained cCR24 by ICR for 24 and 36 months • EFS by INV at 3 years • cCR by INV at 12, 24, and 36 months • ORR by ICR at post-intervention disease assessment • Organ preservation rate at 3 years • DSS and DSS at 5 years • OS and OS at 5 years • Safety (AE, SAE, irAE, study discontinuations, and deaths) • PK parameters • Antidrug antibodies against dostarlimab
[Slide 2]
AZUR-1: the rationale
Non-operative management (NOM) of dMMR tumours
DOSTARLIMAB: BASELINE | 6 WEEKS | 3 MONTHS | 6 MONTHS | FU2 / 14 MONTHS | FU3 / 18 MONTHS | FU4 / 22 MONTHS
ENDOSCOPY | MRI RECTUM | PET/CT
[Waterfall: Tumor Response SD, PR, nCR, cCR; Rectal (100%)]
• 49 patients with rectal adenocarcinoma
• 9 cycles of dostarlimab
• Median follow-up of 30 months
• 100% cCR
• RFS at 2 years was 96%
Prof David Tougeron | ESMO Congress 2026
Cercek A et al. NEJM 2025
LBA87 - Clinical complete response with dostarlimab monotherapy in dMMR/MSI-H locally advanced rectal cancer (LARC): First results from the global registrational AZUR-1 trial
Speakers Andrea Cercek (New York, United States of America, NY)
Lecture Time 11:00 - 11:10
Abstract
Background
Multimodal treatment with chemotherapy, radiation and surgery is a standard of care (SOC) for LARC associated with significant toxicity/morbidity. After TNT, the range of clinical complete response (cCR) is 21–41%. dMMR/MSI-H tumours are exceptionally responsive to PD-1 blockade: in a small study, neoadjuvant dostarlimab treatment led to durable cCRs and eliminated the need for SOC in most patients (pts) with LARC. AZUR-1 (NCT05723562) is a global single-arm trial and the first registrational study evaluating the clinical benefit of dostarlimab monotherapy in pts with dMMR/MSI-H LARC.
Methods
Dostarlimab 500 mg was administered IV every 3 weeks for 9 cycles. Key endpoints include rate of sustained cCR for 12 months (cCR12) following end of treatment (EOT) with dostarlimab alone by investigator (INV) and independent central review (ICR), and composite rate of cCR12 (INV) + pathological CR (pCR).
Results
At data cutoff (DCO, 20 April 2026), 154 pts were enrolled and median follow-up was 26.3 months (range 2–36). Of 144 pts with ≥12 months follow-up, 68% achieved cCR12 (INV). Of 15 pts who underwent surgery after dostarlimab alone, 12 (80%) had pCR, resulting in a cCR12+pCR rate of 76%. Fewer pts were cCR12-evaluable by ICR, primarily due to cCR being confirmed later by ICR after initial EOT evaluation. Of pts evaluable by ICR, 47% (54/116) achieved cCR12, with 38 pts in cCR and being followed for cCR12 at DCO. 98% of pts who achieved cCR remained in cCR for ≥12 months by INV or ICR, with no recurrences to date for pts who achieved cCR or pCR. Overall, 93% of patients are in surveillance with no evidence of disease progression after treatment (dostarlimab ± SOC) and 71% achieved this outcome with dostarlimab alone. The safety profile was acceptable: 88% of pts completed all 9 cycles of dostarlimab and Grade ≥3 immune-mediated AEs occurred in 4 pts.
Conclusions
In this AZUR-1 interim analysis, 68% of pts achieved cCR12 and 76% achieved cCR12+pCR with dostarlimab alone with no disease recurrences to date. These durable responses indicate the potential to eliminate the need for chemotherapy, radiation and surgery, and redefine the curative-intent treatment paradigm for pts with dMMR/MSI-H LARC.
1) Slide: durable cCR swimmer plot (n=100 with >=12 mo follow-up) - Dr Andrea Cercek · 2) Response data: cCR12 by investigator 68% (98/144) waterfall - Dr Andrea Cercek · 3) Response data: assessment of response: clinical complete response definition - Dr Andrea · 4) Trial design schema: trial design - Dr Andrea Cercek
#ESMO26 | AZUR-1
Treating rectal cancer with dostarlimab—without ChT, RT or surgery!
Organ preservation in dMMR/MSI-H locally advanced rectal cancer is exactly the kind of progress we want to see in oncology. The FDA granted accelerated approval for this indication on October 19, 2026. Credit where it’s due: a major advance with a direct impact on patients’ lives👏👏
[Slide 1]
Durable responses were observed in patients who achieved cCR
Patients achieving cCR (INV) after dostarlimab monotherapy among patients with ≥12 months follow-up (n=100)
cCR (n=100)
98% of cCRs were durable with no recurrences
(2 patients with cCR elected for surgery and had pCR)
Legend: Time from enrolment to start of cCR12 follow-up; In follow up with sustained cCR; Ongoing follow up (further response assessment pending); cCR reported prior to EOT; EOT; Patients with cCR who elected for surgery
Months (0-40)
cCR, clinical complete response; cCR12, clinical complete response for ≥12 months; EOT, end of treatment; INV, investigator; pCR, pathological complete response
Dr Andrea Cercek
[Slide 2]
High rate of cCR12 was observed with dostarlimab alone
cCR12 = Patients who achieved cCR after dostarlimab monotherapy and maintained for ≥12 mo with no additional treatment
Legend: cCR with <12 mo follow-up (n=10); cCR with ≥12 mo follow-up (n=98); Non-cCR12 (n=46); Late cCR (n=8)
2 patients who achieved a cCR at EOT response assessment elected for surgery (both pCR) so could not achieve cCR12
Y axis: cCR/pCR, nCR, PR, SD, N/A†, PD
cCR with <12 mo follow-up (n=10) | cCR with ≥12 months follow-up* (n=98) | Non-cCR12 (n=46)
Patients evaluable for cCR12 = 144
cCR12 by INV: 68% (98/144)
*Sufficient follow-up for cCR12 analyses required 12 months of follow-up and adequate disease assessments according to the scheduled assessment plan (i.e., a patient with a cCR may have completed 12 months of follow-up but would still not be cCR12-evaluable if the required disease assessments were not performed). †Patients who were not evaluable (n=4) have been pooled with those who were N/A (n=6): four patients did not reach end of treatment response assessment and did not initiate SOC treatment; six patients did not undergo end of treatment response assessment but were recorded as continuing on study and received SOC. cCR, clinical complete response; cCR12, clinical complete response for ≥12 months; EOT, end of treatment; mo, months; N/A, not available; nCR, near complete response; pCR, pathological complete response; PD, progressive disease; PR, partial response; SD, stable disease; SOC, standard of care.
Dr Andrea Cercek
[Slide 3]
Assessment of response: Clinical complete response (cCR)
Clinical complete response (cCR): concordant examination, endoscopy and MRI
Clinical examination + Endoscopy
✓ Normal digital rectal examination
✓ No visible residual rectal tumor
+
Rectal MRI
✓ No residual diffusion restriction on DWI; scar on T2-weighted imaging
✓ Target lymph nodes decrease to <5 mm in short-axis diameter*
[Images: Endoscopy and MRI, Baseline → Complete response]
*The <5 mm threshold is source-specific and should be applied within the study assessment protocol, not treated as a standalone universal guarantee of nodal sterilization.
cCR, clinical complete response; DWI, diffusion-weighted imaging; MRI, magnetic resonance imaging.
Dr Andrea Cercek
[Slide 4]
AZUR-1 trial design
Global Phase 2 single-arm study of dostarlimab monotherapy for dMMR/MSI-H locally advanced rectal cancer
Patients with dMMR/MSI-H LARC → Dostarlimab treatment → EOT response assessment → Post-dostarlimab management based on INV assessment → Efficacy endpoints for interim analysis
✓ Stage II to III (T3–T4, N0, or T any, N+)
✓ dMMR/MSI-H by local or central assessment
✓ No prior treatment for rectal cancer
✓ No tumour-caused symptomatic bowel obstruction
N=154
Dostarlimab 500 mg IV Q3W x 9 cycles
Endoscopy and MRI/CT 21 days after last dose (+7 days)
cCR → NOM† (surveillance without further treatment)
<cCR → NOM† (surveillance without further treatment) or SOC (ChT/RT/surgery) (per investigator discretion)
iCR/nCR* (second assessment loop)
Primary/secondary: cCR12 by ICR/ cCR12 by INV
Exploratory: cCR12 (INV) + pCR
Note, cCR12 and pCR achieved after dostarlimab alone
*Patients with near CR (nCR; defined as those with significant reduction in tumour burden but with some residual disease) or incomplete CR (iCR; defined as all responses less than nCR that are not progressive disease, including those with PR and SD) will have the option for a second clinical response evaluation 4–8 weeks after the initial evaluation, at the discretion of the investigator and the patient. If the patient reaches cCR, they may enter the nonoperative management period; if the response is less than cCR, patients will either proceed with SOC or surveillance without further treatment per investigator discretion. †Endoscopy, rectal MRI, and CT CAP Q4M in Years 1–2 and Q6M in Years 3–5. cCR12, clinical complete response for ≥12 months; iCR, incomplete clinical response; ICR, independent central review; INV, investigator; nCR, near complete response; NOM, nonoperative management.
Dr Andrea Cercek
[Slide 2]
10:15 - 11:45 Proffered paper: Gastrointestinal tumours, lower digestive
CHAIR: GUILLERMO ARGILES MARTINEZ
High rate of clinical complete responses (cCR) was observed after dostarlimab alone
Legend: cCR (n=102); Late cCR (n=8)*; nCR (n=9); PR (n=15); SD (n=10); N/A (n=10); PD (n=8)
Y axis: cCR, nCR, PR, SD, N/A†, PD
cCR: 66% (n=102) | nCR: 6% (n=9) | PR: 10% (n=15) | SD: 6% (n=10) | N/A: 7% (n=10)† | PD: 5% (n=8)
End of treatment response (N=154)
cCR 71% (110/154)
*8 patients converted from nCR/PR to cCR at any time; †Patients who were not evaluable (n=4) have been pooled with those who were N/A (n=6): four patients did not reach end of treatment response assessment and did not initiate SOC treatment; six patients did not undergo end of treatment response assessment but were recorded as continuing on study and received SOC. cCR, clinical complete response; N/A, not available; nCR, near complete response; pCR, pathological complete response; PD, progressive disease; PR, partial response; SD, stable disease.
Dr Andrea Cercek
ALMERIA AUDITORIUM - HALL 9
[Slide 3]
10:15 - 11:45 Proffered paper: Gastrointestinal tumours, lower digestive
CHAIR: GUILLERMO ARGILES MARTINEZ
High rate of cCR12 + pCR was observed with dostarlimab alone
cCR12 = Patients who achieved cCR after dostarlimab monotherapy and maintained for ≥12 mo with no additional treatment
Legend: cCR with 12 months follow up (n=98); pCR after dostarlimab alone (n=12); nCR (n=3); PR (n=13); SD (n=10); N/A (n=10); PD (n=8); Late cCR (n=8); cCR with <12 months follow up (n=10)
cCR with <12 mo follow-up (n=10) | cCR with ≥12 months follow-up* (n=98) | Non-cCR12 (n=46)
End of treatment response (N=154)
cCR12 (n=98) + pCR (n=12): 76% (110/144)
[Footnotes: N/A pooling and abbreviations, small print]
Dr Andrea Cercek
ALMERIA AUDITORIUM - HALL 9
[Slide 4]
10:15 - 11:45 Proffered paper: Gastrointestinal tumours, lower digestive
CHAIR: GUILLERMO ARGILES MARTINEZ
Safety profile was consistent with prior studies of dostarlimab
Dostarlimab median number of cycles 9 (range 2–9) N=154
AEs (≥10% of patients) | Gr 1–2 | ≥Gr 3
Any dostarlimab-related AE, n (%) | 98 (64) | 15 (10)
Pruritus | 21 (14) | 0
Hypothyroidism | 19 (12) | 0
Fatigue | 16 (10) | 1 (<1)
Immune-mediated AEs (≥2% of patients) | Gr 1–2 | ≥Gr 3
Any immune-mediated AE, n (%) | 32 (21) | 4 (3)||
Hypothyroidism | 12 (8) | 0
Arthralgia | 3 (2) | 0
Hyperthyroidism | 3 (2) | 0
SAEs* | Any causality | Dostarlimab related†
Any treatment-emergent SAE, n (%) | 31 (20) | 8 (5)
SAEs of clinical interest
Intestinal obstruction‡ | 3 (2) | 0
Rectal stenosis | 2 (1) | 0
Intestinal perforation§ | 2 (1) | 0
Among adverse events related to dostarlimab:
• 3 (2%) patients discontinued treatment¶
• No fatal AEs
DCO 20 April 2026.
[Footnotes small print: SAE definition; AEs considered related at investigator discretion; obstruction at primary tumour site in 2 patients with response; perforation includes large intestinal perforation (n=1) and procedural intestinal perforation (n=1); ≥Gr3 immune-mediated includes Grade 3 adrenal insufficiency (n=1), Grade 4 diabetic ketoacidosis (n=1), Grade 3 lichen planus (n=1) and Grade 3 hepatitis (n=1); discontinuations: hepatitis (n=1), amylase increase (n=1) and lichen planus (n=1) - partially legible]
Dr Andrea Cercek
ALMERIA AUDITORIUM - HALL 9
Patient disposition
Assessed for eligibility N=165
Screening failures (n=11) • Ineligible (n=10) • Withdrew (n=1)
Received dostarlimab monotherapy N=154 (full analysis set)
• Completed (n=136)
• Discontinued prematurely (n=18)*
Did not reach response assessment (n=4) • Withdrew (n=3) • Died (n=1)
NOM after dostarlimab 71% (110/154)
Additional SOC treatment after dostarlimab 26% (40/154)
Lost to follow-up post SOC (n=5) • Withdrew (n=1) • Died (n=4)†
On study and in follow-up 94% (145/154)
PD post SOC (n=2)
On study with no evidence of PD after dostarlimab ± SOC 93% (143/154)‡
*Premature discontinuations included adverse event (n=4), physician decision (n=6), PD (n=6), withdrawal by patient (n=1), other (n=1). †One patient refused SOC and died without evidence of having received any additional treatment. ‡Two patients refused SOC, as recommended after EOT disease assessment, had local progression and then received additional treatment (immunotherapy n=1; CRT n=1); no further PD noted during or following additional treatments. CRT, chemoradiotherapy; DCO, data cut-off; EOT, end of treatment; NOM, non-operative management; PD, progressive disease; SOC, standard of care.
Dr Andrea Cercek
Investigator-assessed cCR is achieved earlier than by central review
cCR12 (INV): 98/144 68%
cCR12 (ICR): 54/116 47%
Legend: cCR with <12 mo follow-up | cCR with ≥12 mo follow-up | Non-cCR/pCR
cCR12 by INV 94% mature
cCR12 by ICR 75% mature
*No subsequent systemic treatment or radiotherapy after completing dostarlimab. cCR, clinical complete response; cCR12, clinical complete response for ≥12 months; ICR, independent central review; INV, investigator; mo, months; nCR, near complete response; pCR, pathologic complete response.
Dr Andrea Cercek
1) Response data: title slide: Clinical complete response with dostarlimab monotherapy · 2) Slide: high rate of cCR12 + pCR with dostarlimab alone (76%, 110/144)
🔥 AZUR-1: A new era in organ preservation!
#ESMO2026
✅ A new standard of care for patients with localized dMMR/MSI-H rectal cancer!
✅✅ 154 patients enrolled in the first global, multicenter cohort!
✅✅✅ Dostarlimab monotherapy for 6 months
—cCR (98) + pCR (12/15): 76% 🔥
—98% maintained cCR for >12 months!
👉 FDA accelerated approval granted on October 19, 2026!
Congratulations to @AndreaCercek and colleagues! 👏👏👏
[Slide 1]
Clinical Complete Response With Dostarlimab Monotherapy in dMMR/MSI-H Locally Advanced Rectal Cancer: First Results From the Global Registrational AZUR-1 Trial
Andrea Cercek1, Jean-Baptiste Bachet2, Gunnar Folprecht3, Hideaki Bando4, Jenny Seligmann5, Naureen Starling6, María del Carmen Riesco Martínez7, Pilar García Alfonso8, Denis Smith9, Lisa Salvatore10,11, Encarna Gonzalez Flores12, Emmanuel Mitry13, Eric Chen14, Jaume Capdevila15, Federica Morano16, Susana Roselló Keränen17, Neda Stjepanovic18, Zsolt Szijgyarto19, Luis A. Diaz, Jr1, Jeanine M.L. Roodhart20
1Memorial Sloan Kettering Cancer Center, New York, NY, USA; 2Sorbonne University, Pitié Salpêtrière Hospital, Paris, France; 3Technical University Dresden/Medical Faculty Carl Gustav Carus, Dresden, Germany; 4National Cancer Center Hospital East, Kashiwa-shi, Chiba, Japan; 5University of Leeds, Leeds, UK; 6Royal Marsden NHS Foundation, London, UK; 7Hospital Universitario 12 de Octubre, Madrid, Spain; 8Hospital General Universitario Gregorio Marañón, Faculty of Medicine, Complutense University of Madrid, Instituto de Investigación Sanitaria Gregorio Marañón, Madrid, Spain; 9CHU Haut Lévêque, Pessac, France; 10Università Cattolica del Sacro Cuore, Rome, Italy; 11Comprehensive Cancer Center, Fondazione Policlinico Universitario Agostino Gemelli, IRCCS Rome, Rome, Italy; 12Hospital Universitario Virgen de las Nieves, Instituto de Investigación Biosanitaria IBS, Granada, Spain; 13Institut Paoli-Calmettes, Marseille, France; 14Princess Margaret Cancer Centre, Toronto, Canada; 15Vall Hebron University Hospital and Vall Hebron Institute of Oncology (VHIO), Barcelona, Spain; 16Fondazione IRCCS Istituto Nazionale dei Tumori, Milan, Italy; 17Hospital Clínico Universitario, INCLIVA Biomedical Research Institute, University of Valencia, Valencia, Spain; 18GSK, Baar, Switzerland; 19GSK, London, UK; 20University Medical Center Utrecht, Utrecht University, Utrecht, The Netherlands
[Slide 3]
High rate of cCR12 + pCR was observed with dostarlimab alone
cCR12 = Patients who achieved cCR after dostarlimab monotherapy and maintained for ≥12 mo with no additional treatment
Legend: cCR with 12 months follow up (n=98) | nCR (n=3) | SD (n=10) | PD (n=8) | Late cCR (n=8) | *pCR after dostarlimab alone (n=12) | PR (n=13) | N/A (n=10) | cCR with <12 months follow up (n=10)
cCR with <12 mo follow-up (n=10) | cCR with ≥12 months follow-up* (n=98) | Non-cCR12 (n=46)
End of treatment response (N=154)
cCR12 (n=98) + pCR (n=12): 76% (110/144)
†Patients who were not evaluable (n=4) have been pooled with those who were N/A (n=6): four patients did not reach end of treatment response assessment and did not initiate SOC treatment; six patients did not undergo end of treatment response assessment but were recorded as continuing on study and received SOC. cCR, clinical complete response; cCR12, clinical complete response for ≥12 months; mo, months; N/A, not available; nCR, near complete response; pCR, pathological complete response; PD, progressive disease; PR, partial response; SD, stable disease; SOC, standard of care.
Dr Andrea Cercek
📢 #ESMO26 concomitant paper - Clinical complete response with dostarlimab monotherapy in dMMR/MSI-H locally advanced rectal cancer: first results from the global AZUR-1 trial.
🔗https://t.co/EXvWvz14iN
@AndreaCercek https://t.co/CKD5Kh88Rm
1) Slide: end-of-treatment response: cCR 71% (110/154), Dr Andrea Cercek · 2) Slide: cCR12 + pCR 76% (110/144), Dr Andrea Cercek
AZUR-1 presented by @AndreaCercek @MSKCancerCenter: dostarlimab x 6 months in locally advanced dMMR/MSI-H #rectalcancer (recently FDA approved): 71% clinical complete response (cCR) rate, 100% durable (2 cCR patients had surgery with path complete response (pCR)), overall 76% had cCR at 12 months or pCR #ESMO26 @myESMO #crcsm
[Slide 2]
High rate of clinical complete responses (cCR) was observed after dostarlimab alone
Legend: cCR (n=102) | Late cCR (n=8)* | nCR (n=9) | PR (n=15) | SD (n=10) | N/A (n=10) | PD (n=8)
cCR: 66% (n=102) | nCR: 6% (n=9) | PR: 10% (n=15) | SD: 6% (n=10) | N/A: 7% (n=10)† | PD: 5% (n=8)
End of treatment response (N=154)
cCR 71% (110/154)
[Footnote, small/blurred:] *8 patients converted from nCR/PR to cCR at any time; †Patients who were not evaluable (n=4) have been pooled with those who were N/A (n=6): four patients did not reach end of treatment response assessment and did not initiate SOC treatment; six patients did not undergo end of treatment response assessment but were recorded as continuing on study and received SOC. cCR, clinical complete response; N/A, not available; nCR, near complete response; pCR, pathological complete response; PD, progressive disease; PR, partial response; SD, stable disease.
Dr Andrea Cercek
[Slide 3]
High rate of cCR12 + pCR was observed with dostarlimab alone
cCR12 = Patients who achieved cCR after dostarlimab monotherapy and maintained for ≥12 mo with no additional treatment
Legend: cCR with 12 months follow up (n=98) | pCR after dostarlimab alone (n=12) | nCR (n=3) | PR (n=13) | SD (n=10) | N/A (n=10) | PD (n=8) | ↓ Late cCR (n=8) | cCR with <12 months follow up (n=10)
cCR with <12 mo follow-up (n=10) | cCR with ≥12 months follow-up* (n=98) | Non-cCR12 (n=46)
End of treatment response (N=154)
cCR12 (n=98) + pCR (n=12): 76% (110/144)
[Footnote, small/blurred: patients not evaluable (n=4) pooled with N/A (n=6) ...; abbreviations]
Dr Andrea Cercek
St Bartholomew's Hospital GI Cancer Centre@BartsGI_Cancer
High rate of cCR12 was observed with dostarlimab alone
cCR12 = Patients who achieved cCR after dostarlimab monotherapy and maintained for ≥12 mo with no additional treatment
Legend: cCR with <12 mo follow-up (n=10); cCR with ≥12 mo follow-up (n=98); Non-cCR12 (n=46); Late cCR (n=8)
cCR with <12 mo follow-up (n=10) | cCR with ≥12 months follow-up* (n=98) | Non-cCR12 (n=46)
Patients evaluable for cCR12 = 144
cCR12 by INV: 68% (98/144)
[Footnotes as on the sharper copy: sufficient follow-up definition; N/A pooling (n=4 not evaluable + n=6 N/A); abbreviations]
Dr Andrea Cercek
🚨 ESMO 2026 | SANO Trial (LBA78): 5-Year Result
Active surveillance vs surgery (N=309)
🔹 5-year OS: 50% vs 54% (HR 1.17; 95% CI 0.77–1.77)
🔹 DFS: HR 1.39 (95% CI 0.94–2.06)
🔹 5-year distant metastases: 46% vs 29% (p<0.01)
🔹 43% in the surveillance arm were spared a non-beneficial oesophagectomy.
An important organ-preservation strategy, but the higher distant metastasis rate is concerning.
Would you recommend active surveillance over surgery for a patient achieving complete clinical response?
#ESMO26 #EsophagealCancer #SANO @myESMO @NiuSanford @OncoAlert @OncBrothers
[Slide 1]
Abstract
Proffered Paper session
LBA78 - Active surveillance versus standard surgery after neoadjuvant chemoradiotherapy for oesophageal cancer: Long-term results of a cluster-randomised controlled trial (SANO)
Speakers Sanjiv S. Gangaram-Panday (Rotterdam, Netherlands)
Lecture Time 13:40 - 13:50
Abstract
Background
The Surgery As Needed for Oesophageal cancer (SANO)-trial demonstrated that active surveillance is non-inferior to standard surgery in terms of two-year overall survival in patients with a complete clinical response after neoadjuvant chemoradiotherapy (nCRT). Active surveillance resulted in improved quality of life. Here, we report 5-year outcomes.
[Slide 2]
Methods
From 2017 to 2021, a multicentre stepped-wedge cluster-randomised non-inferiority trial was conducted. Patients with locally advanced oesophageal cancer who achieved complete clinical response (defined as no tumour detected on endoscopic biopsies, -ultrasound, or PET-CT) underwent active surveillance or standard surgery. Cox regression was used to compare 5-year overall and disease-free survival, and the cumulative incidence of distant metastases was estimated using competing risk analysis.
[Slide 3]
Results
A total of 309 patients were included, 198 underwent active surveillance and 111 underwent standard surgery. Median follow-up was 76 months (IQR 67–86). Five-year overall survival was not statistically significantly different between active surveillance and standard surgery (50%, 95%CI 34-57 vs. 54%, 95%CI 46-64; HR 1.17, 95%CI 0.77-1.77) with similar results across histologic subtypes. Disease-free survival was not statistically significantly different (HR 1.39, 95% CI 0.94-2.06). The cumulative incidence of distant metastases at five years was significantly higher in the active surveillance group compared to the standard surgery group (46%, 95%CI 39-53 vs. 29%, 95%CI 21-37; P<.01). Overall, 85 of 198 patients (43%) were spared non-beneficial oesophagectomy, including those with sustained complete clinical response at last follow-up or distant metastases detected within six months after nCRT.
Conclusions
Overall survival at 5 years is not statistically significantly different between active surveillance and standard surgery in patients with oesophageal cancer and a complete clinical response after nCRT, despite a higher incidence of distant metastases in the active surveillance group. These findings support active surveillance as a feasible treatment strategy in these patients.
Slide: LBA78 abstract text: 5-year outcomes active surveillance vs surgery
#ESMO26 | LBA78
Long-term results from SANO: Active surveillance vs standard surgery after nCRT in EC
▪️5y-OS: 50% vs 54%, HR 1.17 (95% CI 0.77-1.77)
▪️DFS: HR 1.39 (95%CI 0.94-2.06)
▪️5y-distant mets: 46% vs 29%, p<0.01
👉Despite no significant OS or DFS differences, the wide CIs and significantly higher distant mets rate highlight important challenges for implementing active surveillance in clinical practice. Looking forward to the presentation!
@myESMO @OncoAlert
Background
The Surgery As Needed for Oesophageal cancer (SANO)-trial demonstrated that active surveillance is non-inferior to standard surgery in terms of two-year overall survival in patients with a complete clinical response after neoadjuvant chemoradiotherapy (nCRT). Active surveillance resulted in improved quality of life. Here, we report 5-year outcomes.
Methods
From 2017 to 2021, a multicentre stepped-wedge cluster-randomised non-inferiority trial was conducted. Patients with locally advanced oesophageal cancer who achieved complete clinical response (defined as no tumour detected on endoscopic biopsies, -ultrasound, or PET-CT) underwent active surveillance or standard surgery. Cox regression was used to compare 5-year overall and disease-free survival, and the cumulative incidence of distant metastases was estimated using competing risk analysis.
Results
A total of 309 patients were included, 198 underwent active surveillance and 111 underwent standard surgery. Median follow-up was 76 months (IQR 67–86). Five-year overall survival was not statistically significantly different between active surveillance and standard surgery (50%, 95%CI 34-57 vs. 54%, 95%CI 46-64; HR 1.17, 95%CI 0.77-1.77) with similar results across histologic subtypes. Disease-free survival was not statistically significantly different (HR 1.39, 95% CI 0.94-2.06). The cumulative incidence of distant metastases at five years was significantly higher in the active surveillance group compared to the standard surgery group (46%, 95%CI 39-53 vs. 29%, 95%CI 21-37; P<.01). Overall, 85 of 198 patients (43%) were spared non-beneficial oesophagectomy, including those with sustained complete clinical response at last follow-up or distant metastases detected within six months after nCRT.
Conclusions
Overall survival at 5 years is not statistically significantly different between active surveillance and standard surgery in patients with oesophageal cancer and a complete clinical response after nCRT, despite a higher incidence of distant metastases in the active surveillance group. These findings support active surveillance as a feasible treatment strategy in these patients.
SANO trial: Active surveillance vs standard surgery after neoadjuvant chemoradiotherapy for oesophageal cancer: Long-term results
#ESMO26 #ESMOAmbassadors
👉 DFS HR: 1.39
👉 OS HR:1.17
👉Distant mets: sHR 2.04
🧐OS not different, supports consideration of active surveillance
@myESMO @ASCO
[Slide 1]
Methods
Design
• Phase III, stepped-wedge, cluster-randomised trial
• Non-inferiority design
Patients
• Locally advanced oesophageal cancer
• nCRT according to the CROSS regimen
• cCR at 12 weeks after nCRT (CRE-2)
[Slide 2]
Cause-specific mortality
Legend: Active surveillance (red); Surgery (blue); death by oesophageal cancer (solid); death by other cause (dashed)
Y axis: Cumulative incidence (%); X axis: Time (months) 0-60
End-of-curve labels at 60 months: 40%, 30%, 15%, 10%
death by oesophageal cancer: sHR 1.67, 95%CI 1.02-2.73, p=0.04
death by other cause: sHR 0.49, 95%CI 0.22-1.09, p=0.08
Number at risk
Active surveillance: 198 178 150 120 106 98
Surgery: 111 97 78 70 63 60
Survival table
Endpoint: Cause-specific mortality (cumulative incidence; competing risks)
Active surveillance | 198
Surgery | 111
HR: sHR 1.67 (death by oesophageal cancer); sHR 0.49 (death by other cause)
HR CI: 1.02-2.73; 0.22-1.09
P: 0.04; 0.08
Landmark rates:
60 mo: Active surveillance - death by oesophageal cancer 40% | Surgery - death by oesophageal cancer 30% | Surgery - death by other cause 15% | Active surveillance - death by other cause 10%
[Slide 3]
Distant dissemination rate
Legend: Active surveillance; Surgery
Y axis: Cumulative incidence (%); X axis: Time (months) 0-60
End-of-curve labels at 60 months: 46% (active surveillance), 29% (surgery)
sHR 2.04, 95%CI 1.25-3.34, p < 0.01
Number at risk
Active surveillance: 198 156 123 98 94 85
Surgery: 111 88 69 63 60 56
Survival table
Endpoint: Distant dissemination (cumulative incidence)
Active surveillance | 198
Surgery | 111
HR: sHR 2.04
HR CI: 1.25-3.34
P: < 0.01
Landmark rates:
60 mo: Active surveillance 46% | Surgery 29%
[Slide 4]
Conclusions
• 5-year overall survival was not statistically significantly different
• Distant metastases were significantly higher with active surveillance
• 43% of patients avoided oesophagectomy
• These findings support the concept of active surveillance after nCRT
Slide: trial conclusions: active surveillance vs surgery after nCRT for oesophageal cancer — Sanjiv
With increase in distant mets , will you offer wait and watch in Esophageal cancer? I won't. #SANO trial. @myESMO #esmo26 @OncoAlert https://t.co/3zTURZhdao https://t.co/aYOWJzxdyh
13:30 - 15:00 Proffered paper 1: Gastrointestinal tumour, upper digestive
CHAIRS: FILIPPO PIETRANTONIO, ELIZABETH SMYTH
Conclusions
• 5-year overall survival was not statistically significantly different
• Distant metastases were significantly higher with active surveillance
• 43% of patients avoided oesophagectomy
• These findings support the concept of active surveillance after nCRT
Sanjiv Gangaram-Panday
Active surveillance versus standard surgery after neoadjuvant chemoradiotherapy for oesophageal cancer: Long-term results of a cluster-randomised controlled trial (SANO)
ALMERIA AUDITORIUM - HALL 9
Kaplan-Meier survival data: overall survival KM curve, active surveillance vs surgery
SANO at 5y: OS 50% vs 54%, but distant mets 46% vs 29% and 43% avoided surgery. There is no universal “best” of course, the Bayesian optimal action depends on patient covariates, their loss/utility weights. Preference-sensitive care, by design.
#ESMO26 https://t.co/zvECsgdudv
[Slide 1]
13:30 - 15:00 Proffered paper 1: Gastrointestinal tumour, upper digestive
CHAIRS: FILIPPO PIETRANTONIO, ELIZABETH SMYTH
Disease-free survival
Legend: Active surveillance / Surgery
HR 1.39, 95% CI 0.94-2.06, p = 0.10
Y-axis: Disease-free survival (%); X-axis: Time (months) 0-60
Number at risk (number censored) (months 0, 12, 24, 36, 48, 60)
Active surveillance: 198 (0) 156 (0) 118 (0) 97 (1) 91 (1) 82 (1)
Surgery: 111 (0) 87 (0) 67 (0) 62 (0) 59 (0) 55 (0)
Sanjiv Gangaram-Panday
Active surveillance versus standard surgery after neoadjuvant chemoradiotherapy for oesophageal cancer: Long-term results of a cluster-randomised controlled trial (SANO)
ALMERIA AUDITORIUM - HALL 9
Survival table
Endpoint: Disease-free survival
Active surveillance | 198
Surgery | 111
HR: 1.39
HR CI: 95% CI 0.94-2.06
P: 0.10
[Slide 2]
13:30 - 15:00 Proffered paper 1: Gastrointestinal tumour, upper digestive
CHAIRS: FILIPPO PIETRANTONIO, ELIZABETH SMYTH
Distant dissemination rate
Legend: Active surveillance / Surgery
sHR 2.04, 95%CI 1.25-3.34, p < 0.01
Y-axis: Cumulative incidence (%); X-axis: Time (months) 0-60
Curve end labels: 46% (active surveillance), 29% (surgery)
Number at risk (months 0, 12, 24, 36, 48, 60)
Active surveillance: 198 156 123 98 94 85
Surgery: 111 88 69 63 60 56
Sanjiv Gangaram-Panday
Active surveillance versus standard surgery after neoadjuvant chemoradiotherapy for oesophageal cancer: Long-term results of a cluster-randomised controlled trial (SANO)
ALMERIA AUDITORIUM - HALL 9
Survival table
Endpoint: Distant dissemination (cumulative incidence)
Active surveillance | 198
Surgery | 111
HR: sHR 2.04
HR CI: 95% CI 1.25-3.34
P: <0.01
Landmark rates:
60 mo (curve end label): Active surveillance 46% | Surgery 29%
[Slide 3]
13:30 - 15:00 Proffered paper 1: Gastrointestinal tumour, upper digestive
CHAIRS: FILIPPO PIETRANTONIO, ELIZABETH SMYTH
Cause-specific mortality
Legend: Active surveillance / Surgery / — death by oesophageal cancer / - - death by other cause
death by oesophageal cancer: sHR 1.67, 95%CI 1.02-2.73, p=0.04
death by other cause: sHR 0.49, 95%CI 0.22-1.09, p=0.08
Y-axis: Cumulative incidence (%); X-axis: Time (months) 0-60
Curve end labels: 40%, 30% (solid lines, death by oesophageal cancer); 15%, 10% (dashed lines, death by other cause)
Number at risk (months 0, 12, 24, 36, 48, 60)
Active surveillance: 198 178 150 120 106 98
Surgery: 111 97 78 70 63 60
Sanjiv Gangaram-Panday
Active surveillance versus standard surgery after neoadjuvant chemoradiotherapy for oesophageal cancer: Long-term results of a cluster-randomised controlled trial (SANO)
ALMERIA AUDITORIUM - HALL 9
Survival table
Endpoint: Cause-specific mortality (cumulative incidence)
Active surveillance | 198
Surgery | 111
HR: death by oesophageal cancer sHR 1.67; death by other cause sHR 0.49
HR CI: 1.02-2.73; 0.22-1.09
P: 0.04; 0.08
Landmark rates:
60 mo (curve end label), death by oesophageal cancer: Active surveillance 40% | Surgery 30%
60 mo (curve end label), death by other cause: Surgery 15% | Active surveillance 10%
[Slide 4]
13:30 - 15:00 Proffered paper 1: Gastrointestinal tumour, upper digestive
CHAIRS: FILIPPO PIETRANTONIO, ELIZABETH SMYTH
Complete clinical responders
Active surveillance (n=198):
• 16% (n=32) developed distant metastases (11% (n=22) within 6 months post-nCRT)
• 51% (n=101) developed locoregional regrowth
• 1% (n=1) developed second primary oesophageal tumour
• 32% (n=64) maintained CCR
Hypothetical 43% avoided oesophagectomy
Sanjiv Gangaram-Panday
Active surveillance versus standard surgery after neoadjuvant chemoradiotherapy for oesophageal cancer: Long-term results of a cluster-randomised controlled trial (SANO)
ALMERIA AUDITORIUM - HALL 9
1) Kaplan-Meier survival data: Overall survival: active surveillance vs surgery · 2) Kaplan-Meier survival data: Disease-free survival: active surveillance vs surgery · 3) Slide: Complete clinical responders in active surveillance arm (per caption)
Sano trial; No significant OS difference does not establish equivalence!!!! Higher 5-year distant metastasis incidence with active surveillance (46% vs 29%; p<0.01) is clinically concerning and deserves attention!!!
@myESMO @OncoAlert #ESMO26 @OncoAlert @Larvol https://t.co/5z1HPV3WXx
Proffered Paper session
LBA78 - Active surveillance versus standard surgery after neoadjuvant chemoradiotherapy for oesophageal cancer: Long-term results of a cluster-randomised controlled trial (SANO)
Speakers Sanjiv S. Gangaram-Panday (Rotterdam, Netherlands)
Lecture Time 13:40 - 13:50
Abstract
Background
The Surgery As Needed for Oesophageal cancer (SANO)-trial demonstrated that active surveillance is non-inferior to standard surgery in terms of two-year overall survival in patients with a complete clinical response after neoadjuvant chemoradiotherapy (nCRT). Active surveillance resulted in improved quality of life. Here, we report 5-year outcomes.
Methods
From 2017 to 2021, a multicentre stepped-wedge cluster-randomised non-inferiority trial was conducted. Patients with locally advanced oesophageal cancer who achieved complete clinical response (defined as no tumour detected on endoscopic biopsies, -ultrasound, or PET-CT) underwent active surveillance or standard surgery. Cox regression was used to compare 5-year overall and disease-free survival, and the cumulative incidence of distant metastases was estimated using competing risk analysis.
1) Kaplan-Meier survival data: Disease-free survival: active surveillance vs surgery · 2) Kaplan-Meier survival data: Distant dissemination rate: active surveillance vs surgery · 3) Kaplan-Meier survival data: Cause-specific mortality: active surveillance vs surgery
🚨 ESMO 2026 | SANO Trial – 5-Year Results
Can surgery be safely omitted after cCR in oesophageal cancer?
📊 DFS: HR 1.39 (p=0.10)
⚠️ Distant metastases: 40% vs 23% (p<0.01)
⚠️ Cancer mortality: sHR 1.67 (p=0.04)
✅ 43% potentially avoided surgery.
Careful patient selection!! https://t.co/d6H5wmysHC
Kaplan-Meier survival data: Overall survival, active surveillance vs surgery
📢 #ESMO26 concomitant paper - Active surveillance vs standard surgery after neoadjuvant chemoradiotherapy for oesophageal cancer: long-term results of a cluster-randomised controlled trial (SANO).
🔗https://t.co/Op3dYBkq7O https://t.co/a77SMOg8Uv
1) Response data: INCB161734 + GEMNabP or mFOLFIRINOX in mPDAC · 2) Slide: INCB161734 + SoC chemotherapy in mPDAC: swimmer plot of duration · 3) Safety data: INCB161734 + mFOLFIRINOX in mPDAC: safety and TRAE · 4) Slide: INCB161734 + GEMNabP or mFOLFIRINOX in mPDAC: conclusions
Safety & efficacy of INCB161734, a oral KRAS G12D inh, in combination with GEMNab or FOLFIRINOX in mPDAC
#ESMO26 #ESMOAmbassadors
👉ORR: 69 vs 89%, no PD
👉mPFS:
👉GI & hemato toxicity, but no skin tox
🧐very impressive, combination with both CTx feasible, ph 3 ongoing
@myESMO @ASCO
[Slide 1]
Antitumour Activity of INCB161734 + SoC Chemotherapy in Patients With mPDAC
INCB161734 1200 mg qd
Response, % (n/N) | GEMNabP (n=26)* | mFOLFIRINOX (n=27)†
ORR‡,§ | 69 (18/26) | 89 (24/27)
ORR‡ (confirmed + pending) | 58 (15/26) | 81 (22/27)
DCR‡,§ | 96 (25/26) | 100 (27/27)
[Waterfall plot] Best Percent Change From Baseline; Chemotherapy regimen: GEMNabP / mFOLFIRINOX; → Ongoing; bars labelled SD / PR / CR; Prior lines¶
• Median duration of efficacy follow-up was 7.2 months for INCB161734 + GEMNabP and 5.6 months for INCB161734 + mFOLFIRINOX||
• Plasma ctDNA analysis demonstrated high rates of rapid molecular responses for INCB161734 + GEMNabP (74%) and mFOLFIRINOX (69%)**
*1 patient receiving INCB161734 + GEMNabP was included in the efficacy evaluable population but was not included in the waterfall plot due to death before the first scan. †1 patient was removed from the efficacy evaluable population due to an early adverse event. ‡Assessed in patients with a baseline scan and at least 1 of the following: ≥1 postbaseline scan or discontinued treatment due to death or PD. §Data include unconfirmed responses. ¶In the advanced/metastatic setting. ||Calculated by the reverse Kaplan-Meier method. **Molecular response: ≥90% reduction in KRAS G12D VAF by week 8, assessed by ddPCR or NGS (Predicine) for all patients with baseline G12D VAF and week 8 data.
CR, complete response; ctDNA, circulating tumour DNA; DCR, disease control rate; ddPCR, droplet digital polymerase chain reaction; GEMNabP, nab-paclitaxel + gemcitabine; mFOLFIRINOX, modified leucovorin calcium, fluorouracil, irinotecan hydrochloride, oxaliplatin; mPDAC, metastatic pancreatic ductal adenocarcinoma; NGS, next-generation sequencing; ORR, objective response rate; PD, progressive disease; PR, partial response; qd, daily; SD, stable disease; SoC, standard of care; VAF, variant allele frequency.
[Slide 2]
Durable Benefit With INCB161734 + SoC Chemotherapy in mPDAC
• PFS at 6 months was 80% for INCB161734 + GEMNabP and 90% for INCB161734 + mFOLFIRINOX
[Swimmer plot] INCB161734 + GEMNabP / INCB161734 + mFOLFIRINOX; Duration of Treatment (Weeks)
Legend: CR, PR, SD, PD, Death, Ongoing
Assessed in patients with a baseline scan and at least one of the following: ≥1 postbaseline scan or discontinued treatment due to death or PD.
CR, complete response; GEMNabP, nab-paclitaxel + gemcitabine; mFOLFIRINOX, modified leucovorin calcium, fluorouracil, irinotecan hydrochloride, oxaliplatin; mPDAC, metastatic pancreatic ductal adenocarcinoma; PD, progressive disease; PFS, progression-free survival; PR, partial response; SD, stable disease; SoC, standard of care.
[Slide 3]
Safety: INCB161734 in Combination With mFOLFIRINOX
| INCB161734 1200 mg qd + mFOLFIRINOX (n=28)
Any TRAE, n (%)* | 28 (100)
TRAE leading to INCB161734
Interruption | 11 (39)
Reduction | 6 (21)
Discontinuation | 0
TRAE leading to chemotherapy (any component)†
Interruption | 22 (79)
Reduction | 16 (57)
Discontinuation | 9 (32)
RDI, median %‡
INCB161734 | 77
mFOLFIRINOX (cycles 1-4) | 67
mFOLFIRINOX† | 53
INCB161734 1200 mg qd + mFOLFIRINOX (n=28)
TRAE, n (%)§ | Any grade | Grade 1/2 | Grade ≥3
Diarrhoea | 19 (68) | 16 (57) | 3 (11)
Nausea | 18 (64) | 17 (61) | 1 (4)
Vomiting | 16 (57) | 14 (50) | 2 (7)
Decreased neutrophil count¶ | 16 (57) | 6 (21) | 10 (36)
Fatigue | 15 (54) | 12 (43) | 3 (11)
Anaemia | 11 (39) | 8 (29) | 3 (11)
Decreased platelet count|| | 9 (32) | 4 (14) | 5 (18)
Peripheral sensory neuropathy | 9 (32) | 9 (32) | 0
Decreased appetite | 7 (25) | 7 (25) | 0
Dysgeusia** | 7 (25) | 7 (25) | NA
• The safety profile of INCB161734 + GEMNabP or mFOLFIRINOX was broadly consistent with the established profiles of the SoC regimens
• No fatal TRAEs were recorded
*Assessed in patients who received ≥1 dose of study drug. †Median duration of treatment was 7.0 months. ‡Chemotherapy dose intensity was derived as the minimum RDI among all chemotherapy components. §Includes any-grade TRAEs that occurred in ≥20% of patients. ¶Includes neutropenia and neutrophil count decreased. ||Includes thrombocytopenia and platelet count decreased. **The maximum possible severity per CTCAE for dysgeusia is grade 2.
CTCAE, Common Terminology Criteria for Adverse Events; GEMNabP, nab-paclitaxel + gemcitabine; mFOLFIRINOX, modified leucovorin calcium, fluorouracil, irinotecan hydrochloride, oxaliplatin; NA, not applicable; qd, daily; RDI, relative dose intensity; SoC, standard of care; TRAE, treatment-related adverse event.
[Slide 4]
Conclusions
• The favourable safety and tolerability profile for INCB161734 1200 mg qd + GEMNabP or mFOLFIRINOX in patients with mPDAC was broadly consistent with the established profiles of the SoC regimens
• GI TRAEs were mostly grade 1/2 and improved during treatment
• The incidence of TRAEs leading to INCB161734 treatment discontinuation was low
• Deep and durable treatment responses were observed
• ORR (DCR) was 69% (96%) for INCB161734 + GEMNabP and 89% (100%) for INCB161734 + mFOLFIRINOX
• 6-month PFS landmark rates were 80% for INCB161734 + GEMNabP and 90% for INCB161734 + mFOLFIRINOX
• Encouraging clinical efficacy supports the ongoing global phase 3 DAWN-303 trial evaluating SoC chemotherapy in combination with INCB161734 or placebo in patients with 1L mPDAC (NCT07522073)
• DAWN-303 is actively enrolling globally
1L, first-line; DCR, disease control rate; GEMNabP, nab-paclitaxel + gemcitabine; GI, gastrointestinal; KRAS, Kirsten rat sarcoma; mFOLFIRINOX, modified leucovorin calcium, fluorouracil, irinotecan hydrochloride, oxaliplatin; mPDAC, metastatic pancreatic ductal adenocarcinoma; ORR, objective response rate; PFS, progression-free survival; qd, daily; SoC, standard of care; TRAE, treatment-related adverse event.
Response data: INCB161734 plus SoC chemotherapy antitumour activity
Every company developing G12X drugs should pay attention to this data at #ESMO26
Zecdarasib (G12Di) plus chemo in 1L metastatic PDAC, phase 1
ORR 89% with mFOLFIRINOX (n=27) ORR 69% with gem/nab-paclitaxel (n=26)
Awesome safety for early DE.
For context, other early 1L PDAC response rates (cross-trial which we would neeeeever do):
Zoldonrasib + FOLFIRINOX: 82% Zoldonrasib + gem/nab-P: 61% Daraxonrasib + gem/nab-P: 59% Daraxonrasib alone: 47%
Chemo clearly still matters. Starting to think about this like Breakwater…
In PDAC, monoallelic inhibitors are extremely effective, just more effective with a little extra oomph behind them.
They will land in adjuvant, neoadjuvant, metastatic and every space you can imagine in the next few years.
Question is do we combo single plus pan or single plus chemo, and what is the added agent (especially in CRC)?
@OncoAlert @TheGutOncLab @Onco_Nexus @Incyte
1) Biomarker data: RAS mutations distribution in PDAC, NSCLC · 2) Response data: INCB161734 +/- cetuximab efficacy (waterfall) · 3) Slide: Safety of INCB161734 +/- cetuximab in metastatic CRC · 4) Slide: Discussant slide: Relevant considerations on INCB161734
KRAS G12D rapidly becoming one of the most exciting targets in GI oncology. INCB161734,oral selective KRAS G12D inhibitor, advance in PDAC and CRC, bringing the field closer to a targeted option for one of the most common KRAS mutations. #GIOnc #ESMO26 #CRC #KRAS https://t.co/sNvXmJ7p5G
Conclusions
• The favourable safety and tolerability profile for INCB161734 1200 mg qd + GEMNabP or mFOLFIRINOX in patients with mPDAC was broadly consistent with the established profiles of the SoC regimens
– GI TRAEs were mostly grade 1/2 and improved during treatment
– The incidence of TRAEs leading to INCB161734 treatment discontinuation was low
• Deep and durable treatment responses were observed
– ORR (DCR) was 69% (96%) for INCB161734 + GEMNabP and 89% (100%) for INCB161734 + mFOLFIRINOX
– 6-month PFS landmark rates were 80% for INCB161734 + GEMNabP and 90% for INCB161734 + mFOLFIRINOX
• Encouraging clinical efficacy supports the ongoing global phase 3 DAWN-303 trial evaluating SoC chemotherapy in combination with INCB161734 or placebo in patients with 1L mPDAC (NCT07522073)
– DAWN-303 is actively enrolling globally
1) Slide: INCB161734 + chemotherapy in mPDAC: patient disposition · 2) Safety data: INCB161734 + GEMNabP in mPDAC: safety · 3) Response data: INCB161734 + SoC chemotherapy in mPDAC
Upper GI #RapidOral session at @myESMO #ESMO26
1-3L PDAC - phase I
iKRAS (INCB161734)+chemo
mFOLFIRINOX and GemNabPaclitaxel cohorts
👀Safety - we can make it work
🤩ORR impressive
DAWN-303 trial opened to recruitment in many sites (incl @Hospital_FJD)
#ESMOAmbassadors https://t.co/4QA4xzOYjP
Trial design schema: Phase 1 INCB161734 plus SoC chemotherapy in KRAS G12D
INCB161734, KRAS G12D inh: data are promising. GI toxicity is quite relevant in this population. Combo w/FFXN seems more appealing : ⬆️ ORR & ⬇️ GI toxicity ❓DAWN-303 ph3 currently ongoing at @QMBCI @OncoAlert #ESMO26 #PDAC #Pancreas https://t.co/zZj754j7p9 https://t.co/cOa9Sx9asm
Phase 1 Evaluation of INCB161734 Plus SoC Chemotherapy in mPDAC (NCT06179160)
Key Eligibility Criteria
• Locally advanced or metastatic PDAC with KRAS G12D mutation*
• ECOG PS 0 or 1
• No prior treatment with a KRAS G12D selective inhibitor
• Dose escalation: ≤1 prior systemic regimen in the metastatic setting†
• Dose expansion: no prior regimen in the metastatic setting†
Key Endpoints
• Safety and tolerability
• Efficacy (ORR, DCR, DOR, and PFS)
Chemotherapy Regimens
GEMNabP: D1, D8, D15 of 28D cycle. Gemcitabine 1000 mg/m², nab-paclitaxel 125 mg/m²
mFOLFIRINOX: D1, D15 of 28D cycle. Oxaliplatin 85 mg/m², leucovorin 400 mg/m², irinotecan 150-180 mg/m², fluorouracil 2400 mg/m²
Dose Escalation‡
INCB161734 1200 mg qd + GEMNabP (n=5)
INCB161734 600 mg qd + GEMNabP (n=12)
INCB161734 1200 mg qd + mFOLFIRINOX (n=7)
INCB161734 600 mg qd + mFOLFIRINOX (n=10)
Selected RDE
Dose Expansion‡
INCB161734 1200 mg qd + GEMNabP (n=21)
INCB161734 1200 mg qd + mFOLFIRINOX (n=21)
Data cut-off date: July 6, 2026. *Determined by local testing. †Neoadjuvant or adjuvant therapy may be counted as 1 line of therapy if recurrence/development of metastatic disease occurred within 6 months of the last dose of therapy; patients who received no standard systemic therapy for PDAC may have received ≤1 cycle of GEMNabP or mFOLFIRINOX before enrolling. ‡Treated until start of new anticancer therapy, disease progression, unacceptable toxicity, death, withdrawal of consent, discontinuation or the end of the study.
Introduction
[Mechanism illustration] INCB161734; binds GTP-bound KRAS (Active) ON; binds GDP-bound KRAS (Inactive) OFF; INC; GTP; GDP; RAF; MEK; ERK; mFOLFIRINOX or GemNabP; PDAC; 39.5%
• PDAC is the sixth leading cause of cancer deaths worldwide1
– 1L chemotherapies for patients with mPDAC have limited benefit2
• PDAC is primarily a KRAS-driven cancer3
– KRAS G12D is the most frequent oncogenic driver, occurring in ~40% of patients
• INCB161734 is a potent and selective ON/OFF oral KRAS G12D inhibitor4
• Phase 1 results demonstrated INCB161734 monotherapy efficacy and manageable safety in patients with KRAS G12D solid tumours, including mPDAC5
• INCB161734 1200 mg qd was tolerable when combined with SoC chemotherapy in patients with mPDAC6
• Here, we report updated efficacy and safety data for INCB161734 in combination with SoC chemotherapy in patients with KRAS G12D mPDAC
1. Sung H, et al. CA Cancer J Clin. 2026;76:e70090. 2. Koopman M, et al. ESMO Gastrointest Oncol. 2025;9:100214. 3. Lee JK, et al. NPJ Precis Onc. 2022;6:91. 4. Farren MR, et al. Presented at: AACR 2024; San Diego, CA, USA. Poster 5900. 5. Desai J, et al. Presented at: ESMO 2025; Berlin, Germany. Oral 9160. 6. Wainberg Z, et al. Presented at: ASCO GI 2026; San Francisco, CA, USA. Oral 654.
Slide: Title slide 3137RO: INCB161734 oral KRAS G12D inhibitor plus chemotherapy
🔹 Gustave Roussy at #ESMO26 🔹
Anoitne Hollebecque rapid oral - Safety and efficacy of INCB161734, a novel oral KRAS G12D inhibitor, in combination with chemotherapy in patients (pts) with advanced/metastatic pancreatic ductal adenocarcinoma (PDAC)
#ESMO https://t.co/EwyrI1Es3x
MADRID 2026 ESMO congress
Safety and Efficacy of INCB161734, a Novel Oral KRAS G12D Inhibitor, in Combination With Chemotherapy in Patients With Advanced/Metastatic Pancreatic Ductal Adenocarcinoma
Antoine Hollebecque,1 Haeseong Park,2 Jason Henry,3 Davide Melisi,4 Lillian L. Siu,5 Philippe Cassier,6 Eileen M. O'Reilly,7 Mitesh J. Borad,8 Lipika Goyal,9 Rasha Cosman,10 Sabine Tejpar,11 Shigehisa Kitano,12 Manuel Hidalgo,13 Shubham Pant,14 Jayesh Desai,15 Amanda McBride,16 Linda Favre-Kontula,17 Feng Zhou,16 Aidan Gilmartin,16 Zev Wainberg18
Presentation number: 3137RO
[Slide 1]
Proffered Paper session
LBA82 - Daraxonrasib, a RAS(ON) multi-selective inhibitor vs chemotherapy in previously treated metastatic pancreatic adenocarcinoma (mPDAC): Additional subgroup analyses from the ph3 RASolute 302 study
Speakers Zev A. Wainberg (Los Angeles, United States of America)
Lecture Time 14:22 - 14:32
Abstract
Background
Multiagent systemic chemo offers limited benefit in mPDAC. Aberrant RAS(ON) signaling drives PDAC; >90% of cases harbor mutant (mut) RAS, and RAS WT PDAC remains dependent on RAS pathway signaling. Daraxonrasib is an oral, RAS(ON) multi-selective, tri-complex inhibitor of active, GTP-bound mut and WT RAS. Daraxonrasib significantly improved OS and PFS vs SOC chemo in pts with previously treated mPDAC overall (with or without an identified tumor RAS mut; mOS 13.2 vs 6.7 mo; HR, 0.40; mPFS 7.2 vs 3.6 mo; HR, 0.49) and in pts with RAS G12 mut mPDAC (OS HR, 0.40; PFS HR, 0.45) with manageable safety in the RASolute 302 primary analysis (NCT06625320). We report additional subgroup analyses from RASolute 302.
[Slide 2]
OS in subgroups
| | n (%) Daraxonrasib n=248 | Chemo n=252 | OS HR (95% CI) |
Tumor RAS mut status
| G12D | 95 (38) | 121 (48) | 0.49 (0.33-0.74) |
| G12V | 102 (41) | 76 (30) | 0.32 (0.19-0.54) |
| G12R | 30 (12) | 31 (12) | 0.61 (0.29-1.30) |
| RAS Q61 | 11 (4) | 11 (4) | 0.37 (0.09-1.44) |
| No RAS mut identified | 9 (4) | 7 (3) | 0.43 (0.09-1.98) |
Conclusions
Daraxonrasib demonstrated OS benefit vs chemo across clinically relevant subgroups including pts with or without an identified tumor RAS mut. Directionally consistent OS benefit across these subgroups further reinforces the potential for daraxonrasib to be a new SOC for eligible pts with mPDAC.
[Slide 3]
Methods
Pts with previously treated mPDAC were randomized 1:1 to daraxonrasib 300 mg PO QD or investigator's choice of SOC chemo (GnP, mFOLFIRINOX, Nal-IRI+5-FU/LV, or FOLFOX). Dual primary endpoints (EPs) were OS and PFS in the RAS G12 mut population; key secondary EPs included OS and PFS in the overall population. Additional analyses evaluated OS in clinically relevant subgroups by locally determined tumor RAS mut status, preselected chemo regimen, and disease setting of prior treatment.
Results
At data cutoff (10 Feb 2026), median follow-up was 8.5 mo (range, 3.2-15.9). OS benefit with daraxonrasib vs chemo was observed across all RAS mut subgroups (Table). Daraxonrasib showed a consistent OS treatment effect across preselected chemo subgroups (HRs, 0.32-0.46). OS data by disease setting of prior treatment will also be presented.
Table: LBA82
1) Response data: ORR by RAS genotype subgroups — Wainberg, ESMO 2026 · 2) Kaplan-Meier survival data: OS by preselected SOC chemotherapy regimen — Wainberg · 3) Kaplan-Meier survival data: OS by disease setting of prior treatment — Wainberg, ESMO
RASolute 302 ph3 study: Daraxonrasib, a RAS(ON) multi-selective inhibitor vs chemotherapy in previously treated mPDAC
#ESMO26 #ESMOAmbassadors
👉 mOS: 13.2 vs 6.7 mo
👉ORR improved in all RAS mutations
👉PFS & OS: small subgroups, favourable for all
🧐great data, consistent benefits for all pts
@myESMO @ASCO
1) Slide: RAS Genotype Distribution (Zev A. Wainberg, ESMO 2026) · 2) Slide: PFS by RAS Genotype Subgroups forest plot (Zev A. Wainberg, ESMO 2026) · 3) Slide: Conclusions (Zev A. Wainberg, ESMO 2026)
#LBA82 subgroup analysis RASolute 302 #PDAC
➡️HR for OS across subtypes 0.32-0.46
➡️G12R 0.61 (0.29-1.30)
➡️RAS WT numbers small (3%) but still OS benefit!
🤔perhaps ORR and mPFS not as pronounced in these populations!
✅std second line treatment
@myESMO #ESMO26 @OncoAlert https://t.co/J43sTtOscN
[Slide 1]
RAS Genotype Distribution
• Consistent with the expected distribution of RAS mutations in PDAC, RAS G12 variants predominated; G13, Q61, and no RAS mutation identified were uncommon
RAS genotypes in PDAC1
Reported real-world prevalence
KRAS G12D (39.9%)
KRAS G12V (28.6%)
KRAS G12R (14.6%)
KRAS G12C (1.7%)
KRAS Q61 (6.3%)
KRAS G13 (0.8%)
NRAS (0.2%)
RAS WT (8%)
RAS genotypes in RASolute 302a
RAS G12D (43.2%)
RAS G12V (35.6%)
RAS G12R (12.2%)
Other RAS G12c (0.8%)
RAS Q61 (4.4%)
RAS G13 (0.6%)
No RAS mutation identifiedb (3.2%)
aLocally determined at a data cutoff of 10 Feb 2026. bPatients with no identified tumor RAS mutation but with other known driver mutations (eg, BRAF V600E, MSI-H/dMMR, NTRK gene fusion) for which there is local regulatory approval must have received appropriate targeted therapy. cOther RAS G12 includes KRAS G12N, KRAS G12A, KRAS G12C, and KRAS G12L mutations.
1. Pant S, et al. J Clin Oncol. 2025;43:777.
Presented by Zev A. Wainberg, MD, MSc
[Slide 3]
PFS by RAS Genotype Subgroups
PFS by BICR | PFS by investigator
Tumor RAS mutational statusa | Events/N Daraxonrasib | Chemo | PFS HR (95% CI)c | Events/N Daraxonrasib | Chemo | PFS HR (95% CI)c
Overall | 127/248 | 130/252 | 0.55 (0.43–0.70) | 135/248 | 149/252 | 0.48 (0.38–0.61)
RAS G12D | 53/95 | 74/121 | 0.48 (0.33–0.69) | 53/95 | 79/121 | 0.43 (0.30–0.62)
RAS G12V | 39/102 | 29/76 | 0.54 (0.33–0.87) | 46/102 | 36/76 | 0.51 (0.33–0.80)
RAS G12R | 19/30 | 16/31 | 0.80 (0.41–1.56) | 22/30 | 17/31 | 0.73 (0.38–1.39)
Other RAS mutationb | 9/11 | 7/14 | 1.29 (0.47–3.51) | 7/11 | 9/14 | 0.57 (0.21–1.56)
RAS Q61 | 9/11 | 5/11 | 1.55 (0.51–4.69) | 7/11 | 7/11 | 0.63 (0.22–1.83)
No RAS mutation identified | 6/9 | 2/7 | 1.92 (0.39–9.52) | 6/9 | 6/7 | 0.62 (0.20–1.94)
[forest plot axis 0.05 0.5 1.0 5 10; Favors Daraxonrasib | Favors Chemo]
PFS results generally favored daraxonrasib versus SOC chemotherapy across RAS genotype subgroups, although treatment-effect estimates differed between BICR and investigator assessments, particularly in smaller subgroups
Data cutoff: 10 Feb 2026.
aLocally determined. Only subgroups with ≥5 patients in at least one treatment arm were included. bOther RAS mutations include RAS Q61 and RAS G13. cHRs and 95% CIs overall and for subgroups were based on the unstratified Cox model with Efron's method of tie handling.
Presented by Zev A. Wainberg, MD, MSc
[Slide 4]
Conclusions
• In the Phase 3 RASolute 302 study, daraxonrasib demonstrated significant improvement in OS in the overall patient population (mOS: 13.2 months vs 6.7 months; HR, 0.40 [95% CI: 0.30–0.53])
• OS improvement was observed across all RAS genotype subgroups, regardless of identified tumor RAS mutational status, as expected based on daraxonrasib's mechanism of action
• ORR and PFS (by BICR and investigator) generally favored daraxonrasib across subgroups
• OS improvement with daraxonrasib was also maintained across preselected standard of care chemotherapy regimens or prior treatment settings, including early metastatic recurrence following perioperative therapy
Consistent OS improvement across key patient subgroups reinforces daraxonrasib as a new standard of care for previously treated mPDAC
Presented by Zev A. Wainberg, MD, MSc
Slide: OS by RAS genotype subgroups, daraxonrasib vs chemo
iKRAS #Daraxonrasib in pretreated #PDAC at @myESMO #ESMO26
‼️Subgroup analysis (careful with statistical power)
👉PFS benefit for G12D, G12V and G12R
👉OS benefit for all but challenging due to small numbers
👉ORR varies
#ESMOAmbassadors https://t.co/labITIowKa
[phone UI overlay: "1 de 1"]
OS by RAS Genotype Subgroups
Tumor RAS mutational status^a | Events/N Daraxonrasib | Chemo | OS HR (95% CI)^c
Overall | 79/248 | 141/252 | 0.42 (0.32–0.55)
RAS G12D | 37/95 | 71/121 | 0.49 (0.33–0.74)
RAS G12V | 22/102 | 39/76 | 0.32 (0.19–0.54)
RAS G12R | 12/30 | 16/31 | 0.61 (0.29–1.30)
Other RAS mutation^b | 3/11 | 10/14 | 0.29 (0.08–1.06)
RAS Q61 | 3/11 | 7/11 | 0.37 (0.09–1.44)
No RAS mutation identified | 4/9 | 4/7 | 0.43 (0.09–1.98)
Axis: 0.05 0.5 1.0 2.0 — Favors Daraxonrasib / Favors Chemo
Daraxonrasib showed OS improvement compared with SOC chemotherapy across all RAS genotype subgroups
Data cutoff: 10 Feb 2026.
^aLocally determined. ^bOther RAS mutations include RAS Q61 and RAS G13. ^cThe size of diamonds is relative to the size of the population in each subgroup. HRs and 95% CIs overall and for subgroups were based on the unstratified Cox model with Efron's method of tie handling.
Presented by Zev A. Wainberg, MD, MSc
Slide: OS by RAS Genotype Subgroups (forest plot), Zev A. Wainberg
Zev Wainberg presents subgroup analyses from phase 3 RASolute 302 study of #daraxonrasib in patients with previously treated metastatic #PDAC at #ESMO26 (part 2) #ESMOAmbassadors @myESMO https://t.co/xcWXBT3xw0
OS by RAS Genotype Subgroups
Events/N
Tumor RAS mutational status(a) | Daraxonrasib | Chemo | OS HR (95% CI)(c)
Overall | 79/248 | 141/252 | 0.42 (0.32-0.55)
RAS G12D | 37/95 | 71/121 | 0.49 (0.33-0.74)
RAS G12V | 22/102 | 39/76 | 0.32 (0.19-0.54)
RAS G12R | 12/30 | 16/31 | 0.61 (0.29-1.30)
Other RAS mutation(b) | 3/11 | 10/14 | 0.29 (0.08-1.06)
RAS Q61 | 3/11 | 7/11 | 0.37 (0.09-1.44)
No RAS mutation identified | 4/9 | 4/7 | 0.43 (0.09-1.98)
[Forest plot axis: 0.05, 0.5, 1.0, 2.0; Favors Daraxonrasib <- | -> Favors Chemo]
Daraxonrasib showed OS improvement compared with SOC chemotherapy across all RAS genotype subgroups
Data cutoff: 10 Feb 2026.
(a)Locally determined. (b)Other RAS mutations include RAS Q61 and RAS G13. (c)The size of diamonds is relative to the size of the population in each subgroup. HRs and 95% CIs overall and for subgroups were based on the unstratified Cox model with Efron's method of tie handling.
Presented by Zev A. Wainberg, MD, MSc
Slide: Baseline Demographics and Disease Characteristics - Zev A. Wainberg
Zev Wainberg presents subgroup analyses from phase 3 RASolute 302 study of #daraxonrasib in patients with previously treated metastatic #PDAC at #ESMO26 (part 1) #ESMOAmbassadors @myESMO https://t.co/bj6gM2WrII
Slide: PFS by RAS genotype subgroups, BICR and investigator (Zev A. Wainberg)
Nice update of the RASolute 302 at #ESMO26
Looking at the outcomes. Although small numbers, are we facing a roadblock with the KRAS G12R variant?
Represents between 12-15%
Could protein degraders be a viable alternative?
#ESMOAmbassadors @myESMO @GrupoTTD https://t.co/bKh7kUhKzk
[Slide 1]
13:30 - 15:00 Proffered paper 1: Gastrointestinal tumour, upper digestive
CHAIRS: FILIPPO PIETRANTONIO, ELIZABETH SMYTH
G-HOPE-001 study design
An open-label, phase 3 study conducted in China and Japan (NCT06238843)
Key inclusion criteria:
- Adults ≥18 years old
- ECOG PS 0-1
- Locally advanced unresectable or metastatic G/GEJA
- CLDN18.2-positive by central or local immunohistochemistry*
- Received and progressed on 2-4 prior therapies which must include fluoropyrimidine, platinum, and a taxane or irinotecan
Key exclusion criteria:
- Positive HER2(†)
- History of treatment with topoisomerase inhibitor-based ADCs
R(‡) 1:1
Arcotatug tavatecan (AT) 6 mg/kg Q3W
Treatment of physician's choice (TPC): Irinotecan, paclitaxel, trifluridine/tipiracil
Treatment continuation until: Completion of 24 months of study treatment; Disease progression and/or lack of clinical benefit(||); Loss of follow-up; Death; Intolerable toxicity; Withdrawal of informed consent
Primary endpoints: PFS by IRRC per RECIST v1.1; OS(§)
Secondary endpoints included: ORR per RECIST v1.1; Safety
*Defined as CLDN18.2 IHC membrane staining intensity ≥2+ in ≥75% of tumour cells. For participants who have previously received any anti-CLDN18.2 therapy, tumour samples were obtained after discontinuation of prior anti-CLDN18.2 therapy. †Defined as IHC 3+, or IHC 2+ and positive by in situ hybridization. ‡Stratification factors include region (China vs. Japan), primary tumour site (stomach vs. gastroesophageal junction) and history of prior gastrectomy (yes vs. no). ||Patients could continue to receive study treatment after disease progression as long as they continued to show clinical benefit. §In Japan the single primary endpoint is OS.
ADC, antibody-drug conjugate; CLDN18.2, claudin18.2; ECOG PS, Eastern Cooperative Oncology Group performance status; G/GEJA, gastric or gastroesophageal junction adenocarcinoma; HER2, human epidermal growth factor receptor 2; IHC, immunohistochemistry; IRRC, independent radiological review committee; ORR, objective response rate; OS, overall survival; PFS, progression-free survival; Q3W, every 3 weeks; R, randomisation; RECIST v1.1, Response Evaluation Criteria in Solid Tumors version 1.1
[Speaker panel] Kohei Shitara - Arcotatug tavatecan (IBI343/TAK-921) versus treatment of physician's choice (TPC) in previously treated, advanced gastric or gastroesophageal junction adenocarcinoma (G/GEJA): First interim analysis of the randomized, open-label, phase 3, G-HOPE-001 ...
ALMERIA AUDITORIUM - HALL 9
[Slide 2]
13:30 - 15:00 Proffered paper 1: Gastrointestinal tumour, upper digestive
CHAIRS: FILIPPO PIETRANTONIO, ELIZABETH SMYTH
Final PFS by IRRC at IA1: primary endpoint
| Arcotatug tavatecan (N=203) | TPC (N=205)
Event, n (%) | 74 (36.5) | 90 (43.9)
Median (95% CI) | 5.5 (4.3, 8.2) | 2.9 (2.6, 3.4)
HR (95% CI) | 0.47 (0.34, 0.65)
P-value (2-sided) | <0.0001
Curve labels at 6 months: 48.5% (AT); 24.0% (TPC)
Y-axis: Progression free survival (%); X-axis: Months (0-15)
At risk (censored) at 0/3/6/9/12/15 months:
Arcotatug tavatecan: 203 (0), 78 (82), 29 (110), 10 (124), 1 (129), 0 (129)
TPC: 205 (0), 43 (92), 7 (111), 2 (113), 1 (114), 0 (115)
- AT demonstrated a statistically significant and clinically meaningful improvement in PFS demonstrating a ~53% reduction in risk of progression or death. Consistent benefit was observed by investigator assessment (HR 0.39; 95% CI, 0.30-0.53).
ITT population. Median and 95% CI are estimated using Kaplan-Meier method. P-value is from the stratified log-rank test; HR and 95% CI are from stratified Cox proportional hazards model.
Median follow-up duration for PFS by IRRC at IA1: AT, 4.2 months (95% CI, 2.9-4.4); TPC, 2.9 months (95% CI, 2.7-3.4).
3L+, third-line or later; CI, confidence interval; CLDN18.2, claudin18.2; G/GEJA, gastric or gastroesophageal junction adenocarcinoma; HR, hazard ratio; IA1, interim analysis 1; IRRC, independent radiological review committee; ITT, intent-to-treat; IA1, interim analysis 1; PFS, progression-free survival; TPC, treatment of physician's choice.
[Speaker panel] Kohei Shitara - Arcotatug tavatecan (IBI343/TAK-921) versus treatment of physician's choice (TPC) in previously treated, advanced gastric or gastroesophageal junction adenocarcinoma (G/GEJA): First interim analysis of the randomized, open-label, phase 3, G-HOPE-001 ...
ALMERIA AUDITORIUM - HALL 9
Survival table
Endpoint: PFS by IRRC at IA1 (primary endpoint, ITT)
Arm | N | Median | Median CI
Arcotatug tavatecan | 203 | 5.5 mo | 4.3, 8.2
TPC | 205 | 2.9 mo | 2.6, 3.4
HR: 0.47
HR CI: 0.34, 0.65
P: <0.0001 (2-sided)
Landmark rates:
6 mo: Arcotatug tavatecan 48.5% | TPC 24.0%
[Slide 3]
13:30 - 15:00 Proffered paper 1: Gastrointestinal tumour, upper digestive
CHAIRS: FILIPPO PIETRANTONIO, ELIZABETH SMYTH
OS at IA2: primary endpoint
| Arcotatug tavatecan (N=230) | TPC (N=230)
Event, n (%) | 122 (53.0) | 159 (69.1)
Median (95% CI) | 10.2 (9.1, 12.3) | 6.9 (5.7, 7.8)
HR (95% CI) | 0.57 (0.45, 0.73)
P-value (2-sided) | <0.0001
Curve labels: 6 months 71.6% (AT), 54.5% (TPC); 12 months 43.2% (AT), 24.7% (TPC)
Y-axis: Overall survival (%); X-axis: Months (0-24)
At risk (censored) at 0/3/6/9/12/15/18/21/24 months:
Arcotatug tavatecan: 230 (0), 218 (0), 149 (16), 88 (52), 43 (78), 14 (98), 7 (103), 1 (107), 0 (108)
TPC: 230 (0), 181 (3), 113 (14), 52 (45), 26 (56), 10 (65), 3 (70), 2 (71), 0 (71)
- AT demonstrated a statistically significant and clinically meaningful improvement in OS vs. TPC for CLDN18.2+ G/GEJA in the 3L+ setting, demonstrating a ~43% reduction in risk of death
ITT population. Median and 95% CI are estimated using Kaplan-Meier method. Median follow-up duration for OS at IA2: AT, 11.1 months (95% CI, 9.8, 12.1); TPC, 11.2 months (95% CI, 9.9, 12.7).
3L+, third-line or later; AT, arcotatug tavatecan; CI, confidence interval; CLDN18.2, claudin18.2; G/GEJA, gastric or gastroesophageal junction adenocarcinoma; HR, hazard ratio; IA2, interim analysis 2; ITT, intent-to-treat; OS, overall survival; TPC, treatment of physician's choice.
[Speaker panel] Kohei Shitara - Arcotatug tavatecan (IBI343/TAK-921) versus treatment of physician's choice (TPC) in previously treated, advanced gastric or gastroesophageal junction adenocarcinoma (G/GEJA): First interim analysis of the randomized, open-label, phase 3, G-HOPE-001 ...
ALMERIA AUDITORIUM - HALL 9
Survival table
Endpoint: OS at IA2 (primary endpoint, ITT)
Arm | N | Median | Median CI
Arcotatug tavatecan | 230 | 10.2 mo | 9.1, 12.3
TPC | 230 | 6.9 mo | 5.7, 7.8
HR: 0.57
HR CI: 0.45, 0.73
P: <0.0001 (2-sided)
Landmark rates:
6 mo: Arcotatug tavatecan 71.6% | TPC 54.5%
12 mo: Arcotatug tavatecan 43.2% | TPC 24.7%
[Slide 4]
13:30 - 15:00 Proffered paper 1: Gastrointestinal tumour, upper digestive
CHAIRS: FILIPPO PIETRANTONIO, ELIZABETH SMYTH
Conclusions
- The phase 3 G-HOPE-001 study evaluating AT vs. TPC in patients with CLDN18.2+ G/GEJA in the 3L+ setting reached prespecified primary endpoints with statistically significant and clinically meaningful improvements in both PFS and OS:
- PFS: At IA1, median 5.5 vs. 2.9 months (HR 0.47; 95% CI 0.34, 0.65; p<0.0001); at IA2, median 7.1 vs. 3.1 months (descriptive)
- OS: At IA2, median 10.2 vs. 6.9 months (HR 0.57; 95% CI 0.45, 0.73; p<0.0001)
- AT demonstrated a favourable safety profile, with manageable GI and haematological toxicities that were consistent with findings from prior studies
- These results support arcotatug tavatecan (AT), a novel Fc-silenced CLDN18.2-targeted ADC, as an effective treatment option in the 3L+ setting for patients with CLDN18.2-positive, HER2-negative G/GEJA
3L+, third-line or later; ADC, antibody-drug conjugate; AT, arcotatug tavatecan; CI, confidence interval; CLDN18.2, claudin18.2; Fc, fragment crystallizable; G/GEJA, gastric or gastroesophageal junction adenocarcinoma; GI, gastrointestinal; HER2, human epidermal growth factor receptor 2; HR, hazard ratio; IA1, interim analysis 1; IA2, interim analysis 2; OS, overall survival; PFS, progression-free survival; TPC, treatment of physician's choice.
[Speaker panel] Kohei Shitara - Arcotatug tavatecan (IBI343/TAK-921) versus treatment of physician's choice (TPC) in previously treated, advanced gastric or gastroesophageal junction adenocarcinoma (G/GEJA): First interim analysis of the randomized, open-label, phase 3, G-HOPE-001 ...
ALMERIA AUDITORIUM - HALL 9
1) Slide: OS at IA2 (primary endpoint) · 2) Slide: PFS by IRRC updates at IA2 · 3) Response data: ORR by IRRC at IA2 (presenter Kohei Shitara)
G-HOPE-001 phs-3: Arcotatug tavatecan vs TPC in previously treated G/GEJA: First interim analysis
#ESMO26 #ESMOAmbassadors
🇨🇳🇯🇵, 2600 prescreened, 430 included
👉ORR: 37 vs 7.7%
👉 mPFS: 7.1 vs 3.1 mo
👉 mOS: 10.2 vs 6.9 mo
🧐CLDN-2 ADC, strong signal of efficacy, acceptable safety
@myESMO @ASCO
Background
Arcotatug tavatecan is a novel CLDN18.2-targeted ADC comprising an Fc-silenced antibody designed to reduce on target, off-tumor toxicity and conjugated to an exatecan-derived TOPO I inhibitor payload for selective delivery to tumor cells. Here, we report the prespecified first interim analysis (IA1) of the G-HOPE-001 study.
Methods
Patients (pts) with unresectable or metastatic G/GEJA, CLDN18.2 IHC ≥2+ in ≥75% of tumor cells who had progressed on 2-4 prior regimens were randomized 1:1 to arcotatug tavatecan 6mg/kg Q3W or TPC (irinotecan, paclitaxel or trifluridine/tipiracil) until progression or unacceptable toxicity. Stratification factors were regions, primary tumor site and prior gastrectomy. Primary endpoints were IRRC-assessed PFS per RECIST v1.1 and OS. The prespecified IA1 included the PFS final analysis and an OS futility analysis, with a data cutoff of February 13, 2026.
Results
In IA1, 408 pts from China and Japan (male: 62.0%, median age: 58.0, ECOG PS 1: 71.6%, primary tumor at stomach: 81.6%, primary tumor resection: 43.6%) were randomized to arcotatug tavatecan (N=203) and TPC (N=205) arms. IRRC-assessed median PFS was 5.5 months vs 2.9 months (HR: 0.47 [95% CI: 0.34-0.65], p-value <0.0001). With 34.8% of events, median OS was 9.9 months vs 7.4 months (HR: 0.63 [95% CI: 0.45-0.89]). IRRC-assessed ORR was 23.6% in arcotatug tavatecan and 5.3% in TPC. Grade ≥3 (G3+) TEAEs occurred in 45.8% pts with arcotatug tavatecan vs 57.9% pts with TPC. Common gastrointestinal TEAEs (≥10%) with arcotatug tavatecan vs TPC were nausea (38.9% vs 40.6%), vomiting (22.2% vs 28.4%) and diarrhea (12.8% vs 34.5%). Interstitial lung disease was not observed. TRAEs leading to treatment discontinuation occurred in 1.0% of pts in each arm. No TRAE led to death.
Conclusions
Arcotatug tavatecan demonstrated a statistically significant and clinically meaningful improvement in PFS with a manageable safety profile versus TPC for CLDN18.2+ G/GEJA in the 3L+ setting. OS results will be evaluated at the prespecified IA2.
1) Slide: IBI343 background slide — ESMO GI 2024 (Dr Jia (Jenny) Liu) · 2) Slide: Nature Medicine article header: IBI343 phase 1 trial · 3) Slide: Overall safety summary at IA2 (arcotatug tavatecan vs TPC)
From presenting Phase 1 data at #ESMOGI24 → @NatureMedicine publication in 2025 → seeing positive Phase 3 results from G-HOPE-001 in CLDN18.2 positive 3L+ G/GEJA presented by @KoheiShitara at #ESMO26!
Wonderful to have been part of the development journey of arcotatug tavatecan (IBI343), a CLDN18.2-targeting ADC!
📊 OS HR 0.57 (10.2 vs 6.9 mo)
📊 PFS HR 0.45 (7.1 vs 3.1 mo)
💊 Grade ≥3 treatment-related AEs: 47.4% vs 55.9%; dose reductions: 17.8% vs 35.1% compared with chemotherapy.
Congratulations to all investigators and the Innovent & Takeda teams!
Looking forward to exploring rational combinations to further improve patient outcomes!
#ADC #GastricCancer @myESMO @OncoAlert @oncodaily
[Slide 1]
ESMO GASTROINTESTINAL CANCERS Annual Congress | MUNICH GERMANY 26-29 JUNE 2024
BACKGROUND
Nonmalignant cells: Polarity; Apical membrane; Claudin 18.2; Basolateral membrane; Basement membrane
Cancer cells
CLDN18.2 expressed aberrantly on tumor cell surface - promising therapeutic target
Nakayama et al, Nat Rev Clin Oncol 2024
[ADC structure diagram: Asn297; spacer1; spacer2]
Fully human anti-CLDN18.2 Ab with IgG1 Fc silenced | Site specific conjugation and cleavable linker | Exatecan (topoisomerase inhibitor) payload DAR 4
IBI343 ADC Profile targeting CLDN 18.2
• Promising in vivo safety: Fc-silent with no ADCC-mediated GI toxicity
• Promising in vivo efficacy: Strong on-target killing effect & "bystander killing effect"
ESMO GASTROINTESTINAL CANCERS 2024 Dr Jia (Jenny) Liu
[Slide 2]
nature medicine | Search | Log in
Content | About | Publish
articles > article
Download PDF
Article | Open access | Published: 16 July 2025
CLDN18.2-targeting antibody–drug conjugate IBI343 in advanced gastric or gastroesophageal junction adenocarcinoma: a phase 1 trial
Jia Liu, Jianwei Yang, Yuping Sun, Jifang Gong, Jinbo Yue, Yueyin Pan, Meili Sun, Rongfeng Song, Xiuying Xiao, Andrea Tazbirkova, Jian Ruan, Zhenyang Liu, Zimin Liu, Zhihua Li, Lili Sheng, Yanru Qin, Jieer Ying, Xianjun Yu, Jian Zhang, Yiping Mou, Chuangxin Lu, Ping Chen, Suyi Li, Jie Li, Xiujuan Qu, Ting Deng, Juan Du, Aiping Zhou, [author list continues]
[Slide 4]
Overall safety summary at IA2
| | Arcotatug tavatecan (N=230) | TPC (N=222) |
Median (range) treatment duration, months | 5.0 (0.7–18.8) | 2.0 (0.5–14.3)
Any TEAEs, n (%) | 226 (98.3) | 216 (97.3)
Treatment-related | 222 (96.5) | 208 (93.7)
Any Grade ≥3 TEAEs, n (%) | 134 (58.3) | 139 (62.6)
Treatment-related | 109 (47.4) | 124 (55.9)
Any TESAEs, n (%) | 90 (39.1) | 84 (37.8)
Treatment-related | 51 (22.2) | 53 (23.9)
Any TEAEs leading to dose interruption, n (%) | 109 (47.4) | 114 (51.4)
Any TEAEs leading to dose reduction, n (%) | 41 (17.8) | 78 (35.1)
Any TEAEs leading to drug discontinuation, n (%) | 8 (3.5) | 5 (2.3)
Treatment-related | 4 (1.7) | 3 (1.4)
Any TEAEs leading to death, n (%) | 8 (3.5) | 5 (2.3)
Treatment-related | 1 (0.4)* | 0
• Treatment-related Grade ≥3 TEAEs and TEAEs leading to dose reduction or interruption were less frequent with AT vs. TPC
• Incidence of TESAEs was similar between arms, and treatment-related drug discontinuations were uncommon
Includes participants who received ≥1 dose of study drug. Events were graded according to Common Terminology Criteria for Adverse Events version 5.0.
*Sudden death of unknown cause
AT, arcotatug tavatecan; IA2, interim analysis 2; TEAE, treatment emergent adverse ev[obscured by black bar]choice.
[Slide 1]
Proffered Paper session
LBA77 - Arcotatug tavatecan (IBI343/TAK-921) versus treatment of physician's choice (TPC) in previously treated, advanced gastric or gastroesophageal junction adenocarcinoma (G/GEJA): First interim analysis of the randomized, open-label, phase 3, G-HOPE-001 study
Speakers Kohei Shitara (Kashiwa, Japan, Chiba)
Lecture Time 13:30 - 13:40
[Abstract]
Background
Arcotatug tavatecan is a novel CLDN18.2-targeted ADC comprising an Fc-silenced antibody designed to reduce on target, off-tumor toxicity and conjugated to an exatecan-derived TOPO I inhibitor payload for selective delivery to tumor cells. Here, we report the prespecified first interim analysis (IA1) of the G-HOPE-001 study.
[Slide 2]
Results
In IA1, 408 pts from China and Japan (male: 62.0%, median age: 58.0, ECOG PS 1: 71.6%, primary tumor at stomach: 81.6%, primary tumor resection: 43.6%) were randomized to arcotatug tavatecan (N=203) and TPC (N=205) arms. IRRC-assessed median PFS was 5.5 months vs 2.9 months (HR: 0.47 [95% CI: 0.34-0.65], p-value <0.0001). With 34.8% of events, median OS was 9.9 months vs 7.4 months (HR: 0.63 [95% CI: 0.45-0.89]). IRRC-assessed ORR was 23.6% in arcotatug tavatecan and 5.3% in TPC. Grade ≥3 (G3+) TEAEs occurred in 45.8% pts with arcotatug tavatecan vs 57.9% pts with TPC. Common gastrointestinal TEAEs (≥10%) with arcotatug tavatecan vs TPC were nausea (38.9% vs 40.6%), vomiting (22.2% vs 28.4%) and diarrhea (12.8% vs 34.5%). Interstitial lung disease was not observed. TRAEs leading to treatment discontinuation occurred in 1.0% of pts in each arm. No TRAE led to death.
Conclusions
Arcotatug tavatecan demonstrated a statistically significant and clinically meaningful improvement in PFS with a manageable safety profile versus TPC for CLDN18.2+ G/GEJA in the 3L+ setting. OS results will be evaluated at the prespecified IA2.
[Slide 3]
Methods
Patients (pts) with unresectable or metastatic G/GEJA, CLDN18.2 IHC ≥2+ in ≥75% of tumor cells who had progressed on 2-4 prior regimens were randomized 1:1 to arcotatug tavatecan 6mg/kg Q3W or TPC (irinotecan, paclitaxel or trifluridine/tipiracil) until progression or unacceptable toxicity. Stratification factors were regions, primary tumor site and prior gastrectomy. Primary endpoints were IRRC-assessed PFS per RECIST v1.1 and OS. The prespecified IA1 included the PFS final analysis and an OS futility analysis, with a data cutoff of February 13, 2026.
[Slide 1]
G-HOPE-001 trial: design and IA1 result
An open-label, phase 3 study conducted in China and Japan (NCT06238843)
Key inclusion criteria:
• ECOG PS 0–1
• Locally advanced unresectable or metastatic G/GEJA
• CLDN18.2 IHC 2+/3+ in ≥75% TC
• 3L+
• Prior zolbetuximab and irinotecan allowed
Key exclusion criteria:
• Positive HER2ᵃ
• History of treatment with topoisomerase inhibitor-based ADCs
R‡ 1:1
Arcotatug tavatecan (AT) 6 mg/kg Q3W
Treatment of physician's choice (TPC): irinotecan, paclitaxel, trifluridine/tipiracil
‡Stratification factors include region (China vs. Japan), primary tumour site (stomach vs. gastroesophageal junction) and history of prior gastrectomy (yes vs. no)
Cross-over not allowed
Dual primary endpoint PFS met!
Events maturity: 40%
[Embedded KM curve: Progression-free survival (%) vs Months; inset table (Arcotatug tavatecan vs TPC: Event n (%), Median (95% CI), HR (95% CI), P-value) - values too small/blurry to read reliably: illegible]
HR 0.47,
absolute gain +2.6 months (median)/+25% (@6mos)
Filippo Pietrantonio, MD
Survival table
Endpoint: PFS (dual primary endpoint), IA1
Arcotatug tavatecan
TPC
HR: 0.47
[Slide 2]
Overall survival: the other dual primary endpoint
OS at IA2, median follow-up ≈ 11 mos
Events maturity: 61%
[KM curve: Overall survival vs months 0-24; landmark labels on curve at 6 and 12 months, partly blurry: AT ~71.6% / TPC ~56.6% at 6 mo; AT 43.7% / TPC 24.7% at 12 mo]
Arcotatug tavatecan (N=230) TPC (N=230)
Event, n (%) 122 (53.0) 159 (69.1)
Median (95% CI) 10.2 (9.1, 12.3) 6.9 (5.7, 7.8)
HR (95% CI) 0.57 (0.45, 0.73)
P-value (2-sided) <0.0001
HR 0.57,
absolute gain +3.3 months (median)
PFS may be sufficient for regulatory purposes in some settings, but OS and quality of life remain the only endpoints that matter to patients, especially in the 3L+ setting
Filippo Pietrantonio, MD
Survival table
Endpoint: OS (dual primary endpoint), IA2
Arm | N | Median | Median CI
Arcotatug tavatecan | 230 | 10.2 mo | 9.1, 12.3
TPC | 230 | 6.9 mo | 5.7, 7.8
HR: 0.57
HR CI: 0.45, 0.73
P: <0.0001 (2-sided)
Landmark rates:
12 months: Arcotatug tavatecan 43.7% | TPC 24.7%
1) Trial design schema: study design (screenshot) · 2) Slide: primary endpoint: 3-year DFS (screenshot) · 3) Slide: 3-year OS in the ITT population · 4) Slide: DFS by prespecified subgroup (forest plot, ITT)
#ESMO26 | IROCAS
I think we can finally put this debate to rest
In high-risk stage III colon cancer, intensifying adjuvant chemotherapy with mFOLFIRINOX failed to improve DFS over mFOLFOX6
We need to rethink our approach to treatment escalation in the adjuvant setting. Simply adding more conventional cytotoxic agents is not the answer.
1) Slide: (PRODIGE 52) Annals of Oncology article header and author list · 2) Slide: Annals of Oncology abstract - Results and Conclusion
Malheureusement, les essais cliniques ne donnent pas toujours les résultats espérés.
J’ai eu la chance de participer à l’étude internationale de phase III IROCAS (PRODIGE 52), à laquelle je croyais beaucoup, dont les résultats viennent d’être présentés à l’ #ESMO2026 et publié dans @Annals_Oncology
L’objectif était simple : améliorer les chances de guérison des patients opérés d’un cancer du côlon de stade III à haut risque de récidive.
Nous espérions qu’en ajoutant une troisième molécule de chimiothérapie, l’irinotécan, au traitement standard FOLFOX, nous pourrions guérir davantage de patients.
Malheureusement, ce n’est pas le cas.
Chez 795 patients, la survie sans récidive à 3 ans est quasiment identique :
➡️ 65,6 % avec FOLFIRINOX (3 molécules)
➡️ 66,3 % avec FOLFOX (2 molécules)
Et davantage de diarrhées sévères et de fatigue avec le FOLFIRINOX.
Une déception, évidemment, pour tous ceux qui ont participé à cet essai.
Mais c’est aussi cela, la recherche clinique : accepter que nos hypothèses soient parfois démenties par les résultats.
Faire plus ne signifie pas toujours faire mieux.
Et démontrer qu’un traitement plus lourd n’apporte pas de bénéfice, c’est aussi faire progresser la médecine.
[Slide 1]
ORIGINAL ARTICLE · Articles in Press, October 25, 2026
Download Full Issue
A randomised phase III trial of adjuvant treatment intensification with mFOLFIRINOX versus mFOLFOX6 in high-risk stage III colon cancer: Results of the international IROCAS study.
J. Bennouna 1 · T. André 2 · E. Martin 3 · C. Cremolini 4 · S. Gill 5 · T. Asmis 6 · P. Kavan 7 · E. Mitry 8 · S. Hiret 3 · L. Mineur 9 · P. Artru 10 · C. Perret 11 · O. Bouché 12 · Y. Touchefeu 13 · B. Goldenberg 14 · O. Dupuis 15 · S. Lonardi 16 · B. Chibaudel 17 · H. Castanié 18 · C. Coutzac 19 · L. Bauguion 20 · E. Guardiola 21 · A. Benmaziane 22 · J. Barrière 23 · E. Chen 24 · V. Simmet 25 · G. Allegrini 26 · F. Marmorino 4 · V. Pezzella 27 · L. Monard 27 · L. Campion 3 · C. O'Callaghan 28 · J. Taieb 29 Show less
Affiliations & Notes
[Slide 2]
Results
Between May 2017 and June 2023, 795 patients were assigned to mFOLFIRINOX (n=398) or mFOLFOX6 (n=397). Median age was 59 years (range 19–75); 39.7% were women, 52.8% had pT4 disease, 72.2% had pN2 disease, and 25.3% had both. At a median follow-up of 55 months (IQR 42.6–65.9), 284 DFS events had occurred: 146 with mFOLFIRINOX and 138 with mFOLFOX6. Three-year DFS was 65.6% versus 66.3%, respectively (hazard ratio [HR] 1.07, 95% confidence interval [CI] 0.84–1.36; P=0.61). Although Overall survival (OS) data remain immature, 3-year OS was 91.2% versus 86.7% (HR 0.85, 95% CI 0.61–1.21; P=0.37); no significant treatment-by-subgroup interaction was observed. Grade ≥3 adverse events occurred in 62.2% and 62.1% of patients, respectively. Grade ≥3 diarrhoea (15.6% versus 3.8%) and fatigue (7.3% versus 1.8%) were more frequent with mFOLFIRINOX, whereas grade ≥3 neutropenia was less frequent (18.0% versus 23.9%). G-CSF use was 37.8% versus 19.1%.
Conclusion
Adjuvant mFOLFIRINOX triplet chemotherapy did not improve DFS compared with standard doublet mFOLFOX6 in patients with high-risk stage III colon cancer. These findings do not support empirical chemotherapy intensification and highlight the need for novel adjuvant strategies.
1) Kaplan-Meier survival data: disease-free survival KM curve, mFOLFIRINOX · 2) Kaplan-Meier survival data: overall survival KM curve, mFOLFIRINOX
#ESMO26 ❌ IROCAS | Phase III
📖 Simultaneous publication in Annals of Oncology!
👥 795 pts | High-risk stage III CC (T4/N2)
💊 mFOLFIRINOX vs mFOLFOX6
📉 3-y DFS: 65.6% vs 66.3% (HR 1.07; p=.61)
⚠️ More G≥3 diarrhea with mFOLFIRINOX
💡 No benefit from ACT intensification!
🔗 https://t.co/QyuTW6ID2b
@OncoAlert
1) Slide: An international randomised phase III trial of adjuvant treatment · 2) Slide: Livestream screenshot of presented slide · 3) Slide: Livestream screenshot of presented slide
#ESMO26 @myESMO
IROCAS / CCTGCO.27
Unicancer 🇫🇷 Italy 🇮🇹
@CDNCancerTrials 🇨🇦
@BennounaJaafar
Phase 3 RCT mFOLFIRINOX v FOLFOX in high risk stage 3 CC, n=795
53% T4, 72%N2
⛔️3y DFS improvement - 65 v 66%
⛔️3y OS improvement -91% v 87%
📌 c/w prior signal in DYNAMIC3 ctDNA+
➡️ FOLFOX remains SOC - no change since 2004 findings from MOSAIC!
We need to think differently about hi risk stage 3 CC…
IROCAS now published in @Annals_Oncology
🔗 https://t.co/syndVqrSI0
@oncoalert
[Slide 1]
#LBA29 IROCAS : An international randomised phase III trial of adjuvant treatment intensification with mFOLFIRINOX versus mFOLFOX6 in high-risk stage III colon cancer
J. Bennouna1, T. André2, E. Martin3, C. Cremolini4, S. Gill5, T. Asmis6, P. Kavan7, E. Mitry8, S. Hiret3, L. Mineur9, P. Artru10, C. Perret11, O. Bouché12, Y. Touchefeu13, B. Goldenberg14, O. Dupuis15, S. Lonardi16, B. Chibaudel17, H. Castanié18, C. Coutzac19, L. Bauguion20, E. Guardiola21, A. Benmaziane22, J. Barrière23, E. Chen24, V. Simmet25, G. Allegrini26, F. Marmorino4, V. Pezzella27, L. Monard27, L. Campion3, C. O'Callaghan28, J. Taieb29
[Affiliations, small print: Hôpital Foch, Suresnes, France; Hôpital Saint Antoine, Paris, France; ICO Paul Papin/René Gauducheau, Nantes, France; University of Pisa, Pisa, Italy; BC Cancer, Vancouver, Canada; ... UNICANCER, Paris, France; Queen's University, Kingston, Canada; Hôpital Européen Georges Pompidou, Paris, France]
25 October 2026
[Slide 3]
Baseline demographic and clinicopathological characteristics
Characteristics, n (%) | mFOLFIRINOX (n=398) | mFOLFOX6 (n=397)
Age, years, median (range) | 57 (19-74) | 59 (24-75)
- age >70 years | 22 (5.5) | 27 (6.8)
Sex, male | 240 (60.3) | 239 (60.2)
ECOG PS 0 | 326 (81.9) | 329 (82.9)
Pathological T stage
- pT1-3 | 188 (47.2) | 187 (47.1)
- pT4a ; pT4b | 177 (44.5) ; 33 (8.3) | 171 (43.1) ; 39 (9.8)
Pathological N stage
- pN1 (1-3 positive lymph nodes) | 112 (28.1) | 109 (27.5)
- pN2a (4-6 positive lymph nodes) ; pN2b (≥ 7 positive lymph nodes) | 164 (41.2) ; 122 (30.7) | 157 (39.5) ; 130 (32.7)
- pN2, not otherwise specified | 0 | 1(0.3)
High-risk pathological features
- pT4 | 210 (52.8) | 210 (52.9)
- pN2 | 286 (71.9) | 288 (72.5)
- pT4 and pN2 | 100 (25.1) | 101 (25.4)
Primary tumour location – n (%)
- Right-sided ; Left-sided | 176 (44.2) ; 222 (55.8) | 177 (44.6) ; 220 (55.4)
Tumour perforation at diagnosis, Yes | 70 (17.6) | 70 (17.6)
Time from surgery to randomization,weeks, median (range) | 6.6 (3.0-8.9) | 6.4 (3.0-9.4)
Two patients randomised to mFOLFIRINOX were subsequently found on pathological review to have pT1-3N1 disease
Prof. Jaafar Bennouna
Slide: Annals of Oncology article header (Bennouna et al.)
🚨 More chemotherapy ≠ Better outcomes!
#ESMO26 | IROCAS Phase III
Concomitantly published in Annals of Oncology.
795 patients with high-risk stage III colon cancer (T4/N2).
💊 3-year DFS:
mFOLFIRINOX: 65.6%
mFOLFOX6: 66.3%
HR 1.07 | P=0.61
⚠️ Grade ≥3 diarrhoea: 15.6% vs 3.8%
🎯 Verdict: Adding irinotecan failed to improve DFS despite greater GI toxicity.
High risk does not automatically justify more chemotherapy.
@myesmo @ESMO_open @ASCO @oncoalert
#ESMO26 #ColorectalCancer
ORIGINAL ARTICLE · Articles in Press, October 25, 2026
Download Full Issue
A randomised phase III trial of adjuvant treatment intensification with mFOLFIRINOX versus mFOLFOX6 in high-risk stage III colon cancer: Results of the international IROCAS study.
J. Bennouna 1 · T. André 2 · E. Martin 3 · ... · L. Campion 3 · C. O'Callaghan 28 · J. Taieb 29 ... Show more
Affiliations & Notes
Article Info
Slide: Post-hoc analysis FOLFOXIRI vs FOLFOX/CAPOX (DYNAMIC-III context, ASCO 2025 slide of Jeanne Tie)
IROCAS trial presented #ESMO26
Have we hit a wall in high risk pathological or ctDNA+ st III CRC (data from DYNAMIC-III?
👉intensifying with irinotecan doesn't work We need to better understand the cancer biology behind these results? #ESMOAmbassadors @myESMO @GrupoTTD @_SEOM https://t.co/yRPoOzAdpF
#ESMO26 🧬 PRABITAS | Phase III
👥 970 pts | Refractory mCRC
💊 FTD/TPI + BEV: biweekly vs conventional
⏳ mOS: 11.3 vs 10.3 mo
✅ Non-inferior OS (HR 0.93; p<0.0001)
📈 mPFS: 3.9 vs 3.9 mo
⚠️ G≥3 neutropenia: 13% vs 39%
💉 G-CSF use: 3% vs 13%
🚀 Similar efficacy, less toxicity!
@OncoAlert
Biweekly vs conventional trifluridine/tipiracil plus bevacizumab for refractory mCRC: The pragmatic ph 3 PRABITAS trial
#ESMO26 #ESMOAmbassadors
👉ORR: 2 vs 2%
👉 mPFS: 3.9 vs 3.9 mo
👉 mOS: 10.3 vs 11.3 mo
🧐similar efficacy, less toxicity, supports biweekly schedule
@myESMO @ASCO
Articles
14-day versus 28-day trifluridine–tipiracil plus bevacizumab for refractory metastatic colorectal cancer (PRABITAS): a pragmatic, multicentre, open-label, randomised, phase 3, non-inferiority trial in Japan
Tomoki Sakakida*, Hiroya Taniguchi*, Masako Asayama*, ... on behalf of the PRABITAS investigators†
Summary
Background Trifluridine–tipiracil (FTD–TPI) plus bevacizumab is the standard treatment for refractory metastatic colorectal cancer. However, the conventional schedule is frequently associated with haematological and gastrointestinal toxicity, which is clinically significant and relevant to patients. A simplified 14-day schedule has been proposed to reduce toxicity, but whether this treatment preserves survival has not been established in a randomised trial. We therefore aimed to assess whether the 14-day schedule is non-inferior to the conventional schedule for overall survival.
Methods PRABITAS was a pragmatic, multicentre, open-label, randomised, phase 3, non-inferiority trial conducted in 178 hospitals in Japan. Patients with refractory metastatic colorectal cancer were randomly assigned (1:1) using a minimisation algorithm, stratified by Eastern Cooperative Oncology Group performance status, RAS mutational status, and institution, to FTD–TPI (35 mg/m² orally twice daily) plus bevacizumab (5 mg/kg intravenously) on either a conventional 28-day (FTD–TPI on days 1–5 and 8–12; bevacizumab on days 1 and 15) or 14-day schedule (FTD–TPI on days 1–5; bevacizumab on day 1). Eligibility criteria were broadened compared with those of conventional explanatory trials, and trial procedures were aligned with routine clinical practice. The primary endpoint was overall survival, analysed in the intention-to-treat population, with a prespecified non-inferiority margin of 1·25. Safety was assessed in all patients who received at least one dose. Missing data were not imputed. This trial is registered with the Japan Registry of Clinical Trials, jRCTs041230120, and is closed to enrolment.
Findings Between Dec 26, 2023, and May 20, 2025, we randomly assigned 972 patients, of whom 970 (99%) constituted the intention-to-treat population after two were excluded because they were randomly assigned before site approval (486 [50%] to the 28-day treatment group, 292 [60%] men and 194 [40%] women; and 484 [50%] to the 14-day treatment group, 264 [55%] men and 220 [45%] women). Median follow-up was 17·9 months (IQR 14·3–22·6). Median overall survival was 10·3 months (95% CI 9·5–11·6) in the 28-day group and 11·3 months (10·2–12·5) in the 14-day group (stratified hazard ratio 0·93 [95% CI 0·80–1·08]). The 12-month overall survival rates were 44·0% (95% CI 39·5–48·5) in the 28-day group and 47·5% (42·9–52·0) in the 14-day group. Neutropenia grade 3 or worse was reduced in the 14-day group (13% vs 39%; absolute difference 25 percentage points [95% CI 20–31]), as was anorexia grade 2 or worse (15% vs 26%; absolute difference 11 percentage points [6–16]). Two treatment-related deaths occurred in the 14-day group and none in the 28-day group.
Interpretation A 14-day schedule of FTD–TPI plus bevacizumab was non-inferior to the conventional 28-day schedule for overall survival, while reducing haematological and gastrointestinal toxicity. These findings support this simplified schedule as the new standard for FTD–TPI plus bevacizumab in refractory metastatic colorectal cancer.
Funding Japan Society for the Promotion of Science KAKENHI Grant-in-Aid for Challenging Research (Pioneering).
Published Online October 24, 2026 https://doi.org/10.1016/S0140-6736(26)01782-4
See Online/Comment https://doi.org/10.1016/S0140-6736(26)02034-9
Comment
Optimising late-line treatment administration in metastatic colorectal cancer: an even brighter SUNLIGHT
... In 2023, the SUNLIGHT study6 was the first randomised trial to show benefit of a combination over an established late-line treatment, showing that the addition of bevacizumab to FTD–TPI significantly improved overall survival, from 7·5 months to 10·8 months (hazard ratio [HR] 0·61 [95% CI 0·49–0·77; p<0·001), ...
Tomoki Sakakida and colleagues12 addressed this question in the investigator-initiated, open-label, randomised, phase 3, non-inferiority PRABITAS trial, conducted across 252 Japanese institutions. The study compared the conventional 28-day schedule of FTD–TPI plus bevacizumab with a 14-day schedule consisting of FTD–TPI on days 1–5 and bevacizumab on day 1. The primary endpoint was overall survival in the intention-to-treat population, with a prespecified non-inferiority margin of 1·25 for the upper boundary of the 95% CI of the HR.
Sakakida and colleagues randomly assigned 972 patients (after two were excluded) with refractory metastatic colorectal cancer to the 28-day treatment group (486 [50%]) or the 14-day treatment group (484 [50%]). 556 (57%) patients were men and 414 (43%) were women. ... Baseline characteristics were balanced across groups, with a median age of 68 years (IQR 59–74) and RAS-mutated tumours in 576 (59%) patients.
After a median follow-up of 17·9 months (IQR 14·3–22·6), median overall survival was 10·3 months (9·5–11·6) within the 28-day treatment group and 11·3 months (10·2–12·5) in the 14-day treatment group (stratified HR 0·93 [95% CI 0·80–1·08]), showing the non-inferiority of the latter. No differences between groups were observed in terms of progression-free survival and objective response rate.
As for safety findings, neutropenia of grade 3 or worse decreased from 39% to 13%, febrile neutropenia from 5% to 1%, and G-CSF use from 13% to 3%.
Published Online October 24, 2026 https://doi.org/10.1016/S0140-6736(26)02034-9
Slide: 14-day versus 28-day trifluridine–tipiracil plus bevacizumab for refractory
#ESMO26 📢 PRABITAS | Phase III
📖 Simultaneous publication in The Lancet!
👥 970 pts | FTD/TPI + BEV
🔀 14-day vs 28-day schedule
✅ OS noninferior: 11.3 vs 10.3 mo (HR 0.93)
📉 G≥3 neutropenia: 13% vs 39%
💡 Same survival, less toxicity!
🔗 https://t.co/5ZiuaXhNVL
@OncoAlert
📊 PRABITAS - Phase 3, The Lancet
A better way to deliver a bad treatment.
Phase 3 non-inferiority trial
🎯 Refractory mCRC, 178 Japanese hospitals
🔀 Lonsurf (FTD-TPI) + bev: 14-day vs standard 28-day schedule
👥 970 patients
➖ OS 11.3 vs 10.3 mo, HR 0.93: non-inferior
📉 Grade ≥3 neutropenia 13% vs 39%
📉 Grade ≥2 anorexia 15% vs 26%
⚠️ 2 treatment-related deaths in the 14-day arm
This is the regimen that I already use in practice. However, I must still say that this is the trial I wish we had more of: academic, pragmatic, about 1,000 patients, and asking how to give a drug we already use.
The 14-day schedule keeps survival and drops severe neutropenia from 39% to 13%.
In the refractory setting, where every clinic visit and every treatment delay due to neutropenia costs valuable quality time, that matters.
That said, I hope we will have better options than Lonsurf in the near future.
#mCRC #CRC
https://t.co/Tfng5cZ0eP
28-day schedule
14-day schedule
Overall survival (%)
Time (months)
HR 0·93 (95% CI 0·80–1·08)
Number at risk (censored)
28-day schedule
14-day schedule
Figure 2: Kaplan–Meier estimates of overall survival in the intention-to-treat population
Vertical lines indicate censored data. HRs were estimated from stratified Cox proportional-hazards models with Eastern Cooperative Oncology Group performance status (0 vs 1 vs 2) and RAS mutation status (wild-type vs mutant) as strata. Median survival times and 95% CIs were estimated by the Brookmeyer–Crowley method; 95% CIs for HRs were obtained from the stratified Cox model. The prespecified non-inferiority margin was HR 1·25.
HR=hazard ratio.
Survival table
Endpoint: OS (ITT)
28-day schedule | 486
14-day schedule | 484
HR: 0.93
HR CI: 0.80–1.08
#ESMO26 LBA31 PRABITAS Phase 3 Trial
A pragmatic phase 3 non-inferiority trial comparing biweekly vs conventional FTD/TPI + bevacizumab in refractory mCRC.
Efficacy: • OS: 11.3 vs 10.3 mo (HR 0.93, 95% CI 0.80–1.08) • PFS: 3.9 vs 3.9 mo (HR 0.93, 95% CI 0.81–1.06)
Safety: • Grade ≥3 neutropenia: 13% vs 39% • Febrile neutropenia: 1% vs 5%
Biweekly FTD/TPI + bevacizumab demonstrated non-inferior OS with reduced toxicity compared with the conventional schedule.
Our institution, Kansai Medical University Hospital, participated in this study. I am pleased to have contributed as a co-author.
Simultaneously published in The Lancet!
https://t.co/O0yd2m1dqc
#PRABITAS #mCRC #ColorectalCancer @OncoAlert
7 slide posts · 4 physiciansAdjuvant gemcitabine + cisplatin vs standard of care · Resected biliary tract cancer (Phase 3, NCT02170090, Universitätsklinikum Hamburg-Eppendorf)All posts →
1) Trial design schema: Screenshot of presented study design slide · 2) Kaplan-Meier survival data: Screenshot of presented DFS KM slide · 3) Kaplan-Meier survival data: Screenshot of presented OS KM slide · 4) Slide: Screenshot of presented safety table slide
ACTICCA-1 trial: Adj. GemCis vs standard of care after curative intent resection of BTC
#ESMO26 #ESMOAmbassadors
👉 DFS at 2yrs: 52 vs 44%
👉mDFS: 23.3 vs 20.6
👉 mOS: 58 vs 48 mo
👉expected toxicity for the doublet
🧐 Trend for OS benefit, not an option for all, but may be considered as option for selected pts
@myESMO @ASCO
[Slide 1]
Study Design
ACTICCA-1 is an investigator-initiated, randomised, controlled, phase 3 study.
Key inclusion criteria
- Age 18 years or older
- Histologically confirmed CCA or muscle-invasive gallbladder cancer
- Mixed tumour types and ampullary cancers excluded
- Macroscopically complete resection with curative intent (R0 and R1)
- ECOG 0 or 1
- Adequate renal, haematological, and liver function
- Start of adjuvant treatment within 6 to 16 weeks after surgery
R 1:1
Stratification
- Tumour location
- N0 vs. N1
- R0 vs. R1
Group A CisGem (ABC 02): 8 cycles cisplatin 25 mg/m2 and gemcitabine 1000 mg/m2 on day 1 and 8 of a 21 days cycle
CT or MRI q 3 months for 2 years, imaging q 6 months for 3 additional years
Group B Capecitabine (BILCAP): 8 cycles capecitabine 1.250 mg/m2 BID on days 1 through 14 of a 21 days cycle
Primary endpoint
- Disease-free survival (DFS), i.e. recurrence or death due to any cause
Secondary endpoints
- Overall survival (OS)
- Cumulative Recurrence
- Safety (CTCAE version 4.03)
- Quality of life (QoL) monitored with EORTC QLQ-C30 and BIL 21
ACTICCA-1 was conducted in 67 hepatobiliary sites in Australia, Austria, Denmark, Germany, Italy, New Zealand, The Netherlands, and the United Kingdom.
Henning Wege, LBA21, ACTICCA-1
[Slide 2]
Primary Endpoint (DFS)
[KM: Disease-free survival probability vs Time since randomization (years)]
Group A CisGem / Group B Capecitabine
DFS rate at 24 months 52% vs. 44%
- Median DFS 25.7 vs. 17.9 months
- Log rank p=0.097
- Cox HR 0.82 (95% CI 0.67-1.01), p=0.058
- Non-constant treatment effect (Schoenfeld residuals)
Number at risk:
Group A 297 191 140 110 75 35
Group B 294 169 122 101 72 30
Henning Wege, LBA21, ACTICCA-1
Survival table
Endpoint: Disease-free survival (primary)
Group A CisGem | 297 | 25.7 months
Group B Capecitabine | 294 | 17.9 months
HR: 0.82 (Cox)
HR CI: 0.67-1.01 (95% CI)
P: Cox p=0.058; log rank p=0.097
Landmark rates:
24 months: Group A CisGem 52% | Group B Capecitabine 44%
[Slide 3]
Secondary Endpoints (OS & Recurrence)
RMST OS (3 years) Δ 1.44 months, p=0.076
[KM: Overall survival probability vs Time since randomization (years)]
Number at risk: Group A 297 193 101 2; Group B 294 177 98 1
Median OS 58.1 vs. 48.2 months, Cox HR 0.82, p=0.103
Cumulative incidence of recurrence or disease-related death (Aalen-Johansen estimates)
[Curve: Cumulative incidence vs Time since randomization (years)]
Group A CisGem / Group B Capecitabine
Henning Wege, LBA21, ACTICCA-1
Survival table
Endpoint: Overall survival (secondary)
Group A CisGem | 297 | 58.1 months
Group B Capecitabine | 294 | 48.2 months
HR: 0.82 (Cox)
P: 0.103
[Slide 4]
Safety (Selected Events) Graded via CTCAE version 4.03
Group A CisGem, N=297 | Group B Capecitabine, N=294 | Total, N=591
All events (%), G3/4 (%) 1967 (74.7), 348 (23.2) | 1662 (69.5), 158 (14.3) | 3629 (72.1), 506
Severe 130 | 113 | 243
Related 51 | 47 | 98
Haematology (%), G3/4 577 (25.9), 234 | 180 (6.5), 18 | 757 (16.2), 252
Anaemia 114 | 21 | 135
Neutropenia 233 | 29 | 262
Gastrointestinal (%), G3/4 361 (11.8), 11 | 452 (15.0), 40 | 813 (13.4), 51
Diarrhoea 65 | 139 | 204
Nausea 91 | 85 | 176
Stomatitis 18 | 23 | 41
Skin (%), G3/4 105 (3.0), 1 | 353 (16.0), 44 | 458 (9.5), 45
Alopecia 29 | 9 | 38
PPES 4 | 262 | 266
General (%), G3/4 294 (9.1), 20 | 214 (12.2), 6 | 508 (10.7), 26
Fatigue 167 | 112 | 279
PPE = Palmar-plantar erythrodysestesia syndome
Henning Wege, LBA21, ACTICCA-1
Much anticipated ACTICCA-1
➡️adj cis/gem v cape #BTC
➡️mod ITT n=591
➡️no diff in DFS at 24mth 52% v 44%
RMST at 3 yrs ⬆️DFS by 2.6mth
➡️28% iCCA -no maj subgroup diff
➡️mOS 58.1 v 48.2 p=0.1
❎No change to std ?an option, NB need as backbone 1st line!
@myESMO @OncoAlert #ESMO26 https://t.co/zvbwqujcD1
[Slide 3]
Secondary Endpoints (OS & Recurrence)
RMST OS (3 years) Δ 1.44 months, p=0.076
Y-axis: Overall survival probability; X-axis: Time since randomization (years) 0–6
Group A 297 193 101 2
Group B 294 177 99 1
Median OS 58.1 vs. 48.2 months, Cox HR 0.82, p=0.103
Cumulative incidence of recurrence or disease-related death (Aalen-Johansen estimates)
Y-axis: Cumulative incidence; X-axis: Time since randomization (years) 0–5
Group A CisGem; Group B Capecitabine
Henning Wege, LBA21, ACTICCA-1
Survival table
Endpoint: Overall survival (secondary endpoint)
Group A CisGem | 297 | 58.1 months
Group B Capecitabine | 294 | 48.2 months
HR: 0.82 (Cox)
P: 0.103 (Cox); RMST OS (3 years) Δ 1.44 months, p=0.076
1) Slide: app entry: trial presentation (Background) · 2) Slide: abstract full text (Methods, Results, Conclusions)
Data from #ACTICCA1 (LBA) available - long time awaited
#Adjuvant in #BiliaryMalignancies
CisGem vs Capecitabine
🤔DFS HR 0.82, 95%CI 0.67-1.01
🤔DFS RMST first 3y p=0.01
🤔OS p=0.076
👀Full presentation 24/10/2026 10:25am
📝See you there
@myESMO #ESMO26 #ESMOAmbassadors https://t.co/R86l6FaHNI
[Slide 1]
Presentation
Adjuvant chemotherapy with gemcitabine and cisplatin compared to standard of care after curative intent resection of cholangiocarcinoma and gallbladder carcinoma (ACTICCA-1 trial)
Saturday, 24 Oct 2026
10:25 - 10:35
Alicante Auditorium - Hall 6
Save | Note
Info
Background
Despite surgery and adjuvant capecitabine, about 50% of biliary tract cancer (BTC) patients recur or die within two years. Gemcitabine and cisplatin (GC) has been the established chemotherapy regimen in advanced BTC, providing a strong rationale for its evaluation in the adjuvant setting.
[Slide 2]
Background
Despite surgery and adjuvant capecitabine, about 50% of biliary tract cancer (BTC) patients recur or die within two years. Gemcitabine and cisplatin (GC) has been the established chemotherapy regimen in advanced BTC, providing a strong rationale for its evaluation in the adjuvant setting.
Methods
ACTICCA-1 is a randomized, phase III investigator-initiated trial. Patients were enrolled at 60 sites across 7 countries between September 2017 and January 2023 and randomized to adjuvant GC (arm A) or capecitabine (arm B), both for 24 weeks. The primary endpoint is disease-free survival (DFS) in the full analysis set (FAS). Secondary endpoints include overall survival, safety and tolerability of chemotherapy, quality of life, and patterns of disease recurrence.
Results
At the data cut-off date of Dec 31, 2025, 591 patients had been randomized. Median follow-up was 4.8 years. Median age was 63, 46.9% were female, and median interval between surgery and enrolment was 67 days. The location was intrahepatic in 28.3%, perihilar in 19%, distal in 36.5%, and gallbladder in 16.2%. N+ was 47.9%. DFS favoured arm A compared to arm B (median 2.14 vs. 1.49 years, log rank p=0.097). As pre-defined in the statistical analysis plan (SAP), due to violation of the proportional hazard assumption Cox model (HR 0.82, 95% CI 0.67-1.01) was not feasible and restricted mean survival time (RMST) was analysed. Patients in arm A experienced on average 2.6 additional DFS months compared to arm B (RMST in the first 3 years p=0.01) and a strong trend in overall survival (p=0.076). Toxicity showed a slightly higher rate of severe adverse events (130 vs. 113 with 51 vs. 47 treatment related) and adverse events rate (74.4% vs. 69.5% of patients) in arm A compared to B. Further endpoints will be displayed at the meeting.
Conclusions
GC is an adjuvant treatment option for BTC.
Clinical trial identification
NCT02104882; 2012-005078-70.
Legal entity responsible for the study
University Medical Center Hamburg Eppendorf.
Full presentation by #DrWege at @myESMO #ESMO26 on #ACTICCA1 1/2
My thoughts coming later 😉
#ESMOAmbassadors https://t.co/a587O1laHX https://t.co/sUdyIeEgcv
1) Kaplan-Meier survival data: Kaplan-Meier curve for primary endpoint · 2) Kaplan-Meier survival data: overall survival KM curve
#ESMO26 🧬 ACTICCA-1 | Phase III
📖 Simultaneous publication in Annals of Oncology!
👥 591 pts | Resected BTC
💊 CisGem vs capecitabine
❌ Primary DFS endpoint not met
📈 DFS: 25.7 vs 17.9 mo (p=.097)
⏳ OS: 58.1 vs 48.2 mo (NS)
⚠️ Higher toxicity with CisGem
🔗 https://t.co/TFsVErq6sp
1) Mechanism of action: Camupepimut (ELI-002 7P) Mechanism of Action - Eileen M. O'Reilly · 2) Slide: Phase 2: Primary Endpoint DFS in ITT not met - Eileen M. O'Reilly · 3) Slide: exploratory: DFS/RFS by mKRAS T cell response (Phase 1 and Phase 2) - Eileen M. O'Reilly · 4) Biomarker data: pre-specified DFS analysis: ctDNA positive vs negative - Eileen M.
AMPLIFY-7P ph 2 study: Seven-valent mKRAS-specific lymph node targeted amphiphile immunotherapy versus observation in resected PDAC)
#ESMO26 #ESMOAmbassadors
👉 Targeting lymph nodes to activate T-cells
👉T-cells response in 99% of pts
👉poor outcome in ctDNA pos pts
🧐promising data, specifically in pts with Tcell response
@myESMO
EileenO’Reilly presents AMPLIFY-7P randomized phase 2 study of adjuvant camupepimut in patients with resected #KRAS-mutant #PDAC at #ESMO26 #ESMOAmbassadors @myESMO https://t.co/WAM8MlkrIs
Proffered paper on #PDAC by @EileenMOReilly at @myESMO #ESMO26 - AMPLIFY-7P
Randomized phase II trial
Stage II-III KRAS-mutated respected PDAC - adjuvant Camupepimut (ELI-002 7P)
Phase-III ongoing based on promising prespecified DFS at 6m data
#ESMOAmbassadors https://t.co/gAyooiQgVQ
1) Trial design schema: randomised phase II trial design - chemo +/- SBRT in high-risk · 2) Kaplan-Meier survival data: Lancet Oncology Figure 3B - Kaplan-Meier overall survival · 3) Slide: Lancet Oncology article title and author list (AGITG)
🚨📣 big news at #ESMO26: 🧵1/MASTERPLAN RCT shows adding SABR to perioperative chemotherapy for high-risk localized #pancreatic cancer ⬆️⬆️ median overall survival to 22.0 months vs 14.0 months (HR 0.45). #PancreaticCancer #RadOnc @TROGfightcancer in press @TheLancetOncol - https://t.co/KhPO4dgZd4
3136RO - Randomised phase II study of mFOLFIRINOX ± SBRT in patients with high risk, borderline resectable or locally advanced pancreatic cancer: Results of the AGITG MASTERPLAN trial
Speakers Andrew Oar (Southport, Australia)
Lecture Time 17:14 - 17:19
Abstract
Background
Stereotactic body radiotherapy (SBRT) delivers high-dose, precision radiotherapy (RT). Despite advances in chemotherapy (CT) for pancreatic cancer (PC), locoregional recurrences (LRR) are frequent and contribute to morbidity/mortality.
Methods
Eligible pts had operable disease with ≥1 high risk feature (>4 cm, extrapancreatic extension, or node positive), or BRPC, or LAPC. High-risk operable and BRPC pts were classified as potentially operable PC (POPC), while LAPC/medically inoperable pts as inoperable PC (IPC). Staging followed AGITG guidelines with central radiology review. CT was clinician choice: mFOLFIRINOX or gem/nab-paclitaxel. Pts were randomised 2:1 to 3mths of CT+SBRT (I) or to 3mths CT alone (C). SBRT was 40Gy in 5 fractions with fiducial marker guidance and real time RT quality assurance. After CT±SBRT, pts were evaluated for surgery. Following resection pts received 3mths adjuvant CT. Pts unsuitable for resection, continued CT for further 3mths. The primary endpoint was 12mth LRR. Secondary endpoints included resection rate, margin status, toxicity per CTCAE (v5.0), progression-free survival (PFS), and overall survival (OS).
Results
Across 14 sites 75 pts were enrolled with 1 ineligible, including 48 POPC and 26 IPC. 12mth LRR rates were 20.2 % (95% CI: 9.9-33.2%) v 52.0% (95% CI: 30.3-69.9%) in I and C respectively (p=0.022). In POPC, 12mth LRR rates were 19.7% (95% CI: 7.8–35.6) (I) v 52.9% (95% CI: 25.9–74.1) (C) (p=0.031), and in IPC 21.4% (95% CI: 4.8–45.8) (I) v 50.0% (95% CI: 11.4-80.2) (C) (p=0.16). Overall Grade 3+ toxicity occurred in 70.2% (I) and 64.0% (C) (p=0.27). Median PFS was 11.9 v 6.3 mths (p=0.002) and median OS 22.0 v 14.0 mths (p=0.006) in I and C, respectively. Table: 3136RO
Clinicodemographics and outcomes
| | C=Control (n=25) | I=Investigational (n=49) | P value |
| Demographics | | | |
| Median age (IQR) | 66 (55-70) | 65 (58-70) | 0.89 |
| % Male | 72% | 51% | 0.08 |
| Baseline Ca19.9 (median, IQR) | 340 (60-977) | 180 (34-1152) | 0.60 |
| Staging | - | - | |
| Operable with ≥1 high-risk feature | 3 (12%) | 1 (2.0%) | - |
| BRPC | 14 (56%) | 30 (61%) | - |
| IPC | 8 (32%) | 18 (37%) | 0.69 |
| cN0 | 60% | 71% | 0.32 |
| Treatment | | | |
| CT regimen | - | - | - |
| mFOLFIRINOX | 23 (92%) | 44 (90%) | - |
| Gemcitabine/nab-paclitaxel | 2 (8%) | 3 (6%) | 1.0 |
| Withdrawal prior to chemotherapy | 0 (0%) | 2 (4%) | |
| SBRT commenced | NA | 39 (80%) | NA |
| Surgical Outcomes (POPC only; n=48) | C=Control (n=17) | I=Investigational (n=31) | |
| Resection performed n (%) | 10 (59%) | 21 (68%) | 0.54 |
| R0 resection (>1mm) | 4/10 (40%) | 13/21 (62%) | 0.44 |
Conclusions
SBRT improved LRR and PFS without additional toxicity. A significant OS signal was observed in this cohort. Further research to optimise the role of SBRT is required.
THE LANCET Oncology
ARTICLES · Online first, October 23, 2026
Perioperative chemotherapy and stereotactic body radiotherapy versus perioperative chemotherapy alone in patients with high-risk, localised pancreatic cancer (MASTERPLAN): an open-label, phase 2, multicentre, randomised trial of the Australasian Gastro-Intestinal Trials Group
Andrew Oar, MBBS a · Prof Andrew Kneebone, MBBS b,c · Katrin M Sjoquist, PhD d · David Espinoza, MBioStat d · Mark Lee, MBBS e,f · Prof Hien Le, MBBS g,h · et al.
Show more
Kaplan-Meier survival data: PFS and OS KM curves - chemo + SBRT vs chemo alone
AGITG MASTERPLAN ph II study: mFOLFIRINOX ± SBRT in patients with high risk, borderline resectable or locally advanced PDAC
#ESMO26 #ESMOAmbassadors
👉 Local recurrence: 20 vs 52%
👉 mPFS: 11.3 vs 6.3 mo
👉 mOS: 22 vs 14 mo
🧐Provides evidence for SBRT
@myESMO @ASCO https://t.co/5aMsLSWNWZ
Slide: Safety and surgical outcomes (SBRT + chemo vs chemo, localised PDAC)
Rapid oral in #PDAC at @myESMO #ESMO26
Adding #SBRT to chemotherapy (mFOLFIRINOX (~90%) or GemNab (~10%))
Mixed population of resectable, borderline resectable and locally advanced
Better local control? OS signal?
Still unclear topic… 🤔
#ESMOAmbassadors https://t.co/zSBgts2i5r
Slide: HERIZON GEA-301 summary and conclusions (Kohei Shitara)
5. HERIZON-GEA-01: Zanidatamab ± tislelizumab + chemo vs trastuzumab + chemo in 1L HER2+ advanced Gastric/GEJ
- Zani + chemo: mOS 22.9 vs 19.6 mo (HR 0.76; p=0.0088)
- Zani + TIS + chemo: mOS 27.0 vs 19.6 mo (HR 0.65); ~40% alive at 3 yrs
- SoC for HER2+ in 1L
6/8 https://t.co/QpVwE1SbWF https://t.co/7cLJhcxVin
Summary and Conclusions
Zanidatamab Demonstrated Superiority Over Trastuzumab
• At this FFA, zanidatamab + CT demonstrated a statistically significant and clinically meaningful improvement in OS (HR, 0.76) vs trastuzumab + CT
• All primary endpoints have been met, showing PFS and OS benefits for both zanidatamab-containing regimens
Sustained Long-Term Survival With Zanidatamab + Tislelizumab + CT
• With longer follow-up, zanidatamab + tislelizumab + CT sustained a robust OS benefit over trastuzumab + CT, with an improved HR vs IA1 (HR, 0.65 vs 0.72)¹ and a 40% 3-year OS rate vs 23% with trastuzumab + CT
• Adding tislelizumab to zanidatamab + CT provided a meaningful trend toward further OS benefit irrespective of PD-L1 status
Long-Term Safety and Tolerability
• The safety profiles remained manageable with no new safety signals, supporting the tolerability of prolonged treatment
These results solidify zanidatamab with chemotherapy ± tislelizumab as the new standard of care in 1L HER2-positive mGEA, replacing trastuzumab-based regimens
[QR code] A copy of the presentation can be accessed via the QR code. Copies of this slide deck obtained through QR code are for personal use only and may not be reproduced without written permission from the author of the slides
1L, first-line; CT, chemotherapy; FFA, final formal analysis; HER2, human epidermal growth factor receptor 2; HR, hazard ratio; IA1, first interim analysis of OS; mGEA, advanced or metastatic gastro-oesophageal adenocarcinoma; OS, overall survival; PD-L1, programmed death-ligand 1; PFS, progression-free survival.
1. Shitara K, et al. N Engl J Med. 2026;394:2002-14.
Kohei Shitara, MD
Slide: LBA79 abstract: second interim OS analysis (zanidatamab + CT +/- tislelizumab, 1L HER2+ mGEA)
#ESMO26 | HERIZON-GEA-01 – Updated OS
Her2 positive gastric/ge cancer
At 35.3 months of follow-up, zanidatamab + CT now shows a significant OS benefit over trastuzumab + CT: 22.9 vs 19.6 months (HR 0.76; p=0.0088).
With the addition of tislelizumab, median OS increased to 27 months, but the additional benefit was statistically borderline (HR 0.81; p=0.0502).
Considering toxicity, we need to carefully analyze which patients should receive the triplet regimen.
LBA79 - Zanidatamab (zani) + chemotherapy (CT) ± tislelizumab (TIS) for first-line (1L) HER2-positive (HER2+) advanced/metastatic gastroesophageal adenocarcinoma (mGEA): Second interim analysis (IA) from HERIZON-GEA-01
Speakers Kohei Shitara (Kashiwa, Japan, Chiba)
Lecture Time 16:15 - 16:20
[Abstract button]
Background
In the primary analysis of progression-free survival (PFS) and first IA (IA1) of overall survival (OS) of the phase 3 HERIZON-GEA-01 trial (NCT05152147), zani + CT ± TIS significantly prolonged PFS and, with TIS, provided a significant OS benefit (HR 0.72) vs trastuzumab (tras) + CT (Shitara, et al. NEJM. 2026), supporting the US approval of these regimens in 1L HER2+ mGEA. Here, we present the planned second IA of OS (IA2).
Methods
Patients (pts) with untreated HER2+ mGEA were randomized 1:1:1 to zani (1800 mg [<70 kg]/2400 mg [≥70 kg] IV every 3 weeks [Q3W]) + CT (capecitabine/oxaliplatin or 5-FU/cisplatin) ± TIS (200 mg IV Q3W) or tras + CT. PFS (by blinded independent central review) and OS were primary endpoints. At IA2, formal OS comparisons were tested in sequence: zani + CT vs tras + CT, then zani + CT + TIS vs zani + CT.
Results
914 pts were randomized. With a median follow-up of 35.3 mo (data cutoff: 15 July 2026; 9.4 mo longer than IA1), zani + CT significantly improved OS vs tras + CT (HR 0.76 [95% CI: 0.62–0.93]; P = 0.0088; median OS, 22.9 mo [95% CI: 19.9–27.6] vs 19.6 mo [95% CI: 16.9–22.2]). A 4-mo longer median OS was observed with zani + TIS + CT (27.0 mo [95% CI: 23.7–32.2]) vs zani + CT (HR 0.81 [95% CI: 0.65–1.00]), although the difference was not statistically significant (P = 0.0502). The OS benefit of zani + TIS + CT vs tras + CT observed at IA1 (HR 0.72) was sustained at IA2 with an improved HR (0.65 [95% CI: 0.52–0.80]). Estimated 36-mo OS was 39.8% for zani + CT + TIS, 31.5% for zani + CT, and 22.9% for tras + CT. Median duration of treatment was 46.6 (40.5 for zani) wks with zani + CT + TIS, 31.1 (30.1 for zani) wks with zani + CT, and 30.0 (28.2 for tras) wks with tras + CT. The safety profiles were consistent with IA1.
Conclusions
At IA2, zani + CT led to a statistically significant and clinically meaningful OS improvement vs tras + CT. With longer follow-up, zani + CT + TIS showed improved OS benefit over tras + CT and there was a meaningful trend for OS improvement vs zani + CT. Unchanged safety profiles support the tolerability of prolonged treatment. These results continue to support zani combined with CT ± TIS as a new HER2-directed 1L standard of care in HER2+ mGEA.
HERIZON-GEA-01 at #ESMO26:
Zanidatamab + chemotherapy improved PFS and OS versus trastuzumab-based therapy in 1L HER2+ advanced GEA. The triplet regimen with tislelizumab achieved a median OS of 27 months and a 3-year OS rate of 40%.
@OncoAlert #HER2Positive https://t.co/U7iPdH0TRg
Slide: HERIZON-GEA-301 PFS in ITT (final formal analysis): zani + tisle + CT vs zani +
@OncoAlert @myESMO A meaningful advance in 1L treatment, with the incremental benefit of immunotherapy and long-term tolerability remaining key considerations. https://t.co/Vz5UOqah1p
1) Slide: Patient disposition, IA2 (Kohei Shitara) · 2) Slide: Zanidatamab + CT vs trastuzumab + CT, OS in the ITT population · 3) Slide: Zanidatamab + Tislelizumab + CT vs Zanidatamab + CT, OS in the ITT
🚨 #ESMO26 | HORIZON-GEA-01
Updated OS confirms zanidatamab + CT benefit vs trastuzumab + CT (HR 0.76).
Adding tislelizumab: mOS 27.0 months (HR 0.65 vs control), with no new safety signals.
A new standard in 1L HER2+ mGEA? #GIOnc @OncoAlert @myESMO @KoheiShitara https://t.co/IZRVwfzh6b
Biomarker data: final OS: NIVO+IPI vs NIVO across all lines, centrally confirmed
For the final act of CheckMate 8HW, we finally have the significant OS data the doubters have been asking for.
What happens when you have a great treatment and an even better one for a study (and almost everyone crosses over)? You have to wait a really, really long time for OS. Also, some thoughts on splitting the alpha I won’t get into here.
Nivo/ipi vs nivo alone vs chemo, MSI-H/dMMR mCRC. Final OS analysis.
Response rate 72% with nivo/ipi, 58% with nivo alone.
Median OS still not reached.
OS HR 0.66 for nivo/ipi over nivo, statistically significant.
77% of nivo/ipi patients alive at 5 years.
Three out of four patients alive at five years. In metastatic colorectal cancer. 🤯
Not even going to talk about the chemo arm. It's clearly worse, and there is never a time to give chemo in MSI-H unless someone has extreme, active autoimmune disease. “Debulking” is absolute nonsense.
Bottom line: the doubters got their OS. Nivo/ipi is the first-line standard for MSI-H mCRC.
Next steps: how do we decide length of therapy, and how do we manage oligometastatic progression?
#ESMO26 @OncoAlert @TheGutOncLab @OncoAlert
14:45 - 16:15 Rapid oral: Gastrointestinal tumours, lower digestive
CHAIRS: LISA SALVATORE, KAI-KEEN SHIU, RONA YAEGER
CheckMate 8HW
Overall survival: NIVO+IPI vs NIVO across all lines
Centrally confirmed MSI-H/dMMR | NIVO + IPI (n = 296) | NIVO (n = 286)
Events (%) | 78 (26) | 111 (39)
Median OS, mo 95% CI | NR (NE-NE) | NR (NE-NE)
HR (95% CI) | 0.61 (0.46-0.82)
P value | 0.0009a
Landmarks (NIVO+IPI / NIVO): 12 mo 90% / 83%; 24 mo 85% / 72%; 36 mo 81% / 69%; 48 mo 77% / 65%; 60 mo 74% / 62%
No. at risk (months 0, 3, 6 ... 81)
NIVO+IPI 296 279 273 267 264 260 257 255 251 247 245 239 238 226 216 209 199 186 176 166 151 141 114 78 62 31 3 0
NIVO 286 275 263 252 238 228 220 213 207 202 201 199 195 185 176 170 163 151 141 134 122 115 94 57 49 17 3 0
• In patients with centrally confirmed MSI-H/dMMR mCRC, NIVO + IPI demonstrated statistically significant OS benefit vs NIVO across all lines (HR, 0.61, 95% CI, 0.46-0.82, P = 0.0009)
– These data are consistent with those observed in the all-randomized population by local testing (HR, 0.64, [95% CI, 0.51-0.81])
– OS results were consistent across most prespecified subgroups
Median follow-up for all randomized patients with centrally confirmed MSI-H/dMMR mCRC was 68.1 (range, 37.6-81.4) months. aStatistical boundary for significance, 0.0058.
Sara Lonardi
Final overall survival results from CheckMate 8HW: Nivolumab plus ipilimumab versus nivolumab or chemotherapy in MSI-H/dMMR metastatic colorectal cancer
ALICANTE AUDITORIUM - HALL 6
Survival table
Endpoint: OS (centrally confirmed MSI-H/dMMR, NIVO+IPI vs NIVO, all lines)
Arm | N | Median | Median CI
NIVO + IPI | 296 | NR | NE-NE
NIVO | 286 | NR | NE-NE
HR: 0.61
HR CI: 0.46-0.82
P: 0.0009
Landmark rates:
12 mo: NIVO + IPI 90% | NIVO 83%
24 mo: NIVO + IPI 85% | NIVO 72%
36 mo: NIVO + IPI 81% | NIVO 69%
48 mo: NIVO + IPI 77% | NIVO 65%
60 mo: NIVO + IPI 74% | NIVO 62%
1) Trial design schema: study design slide (ESMO 2026 final OS) · 2) Kaplan-Meier survival data: OS Kaplan-Meier: NIVO+IPI vs NIVO across all lines · 3) Response data: efficacy summary table: PFS and ORR with extended follow-up · 4) Slide: summary slide (ESMO 2026 final OS)
Final OS results from CheckMate 8HW: Nivo plus ipi vs nivo or CTx in MSI-H/dMMR mCRC
#ESMO26 #ESMOAmbassadors
👉ORR 72% 58%
👉mOS: NR --> NI vs N HR 0.66
👉5-yr for Nivo/Ipi: 77%
🧐Convincing, Nivo + Ipi as SOC in 1L MSI CRC
@myESMO @ASCO https://t.co/ni6wO1FZAW
[Slide 1]
CheckMate 8HW
Study design: CheckMate 8HW
• CheckMate 8HW is a randomized, multicenter, open-label phase 3 trial^a
Key eligibility criteria:
• Histologically confirmed unresectable or metastatic CRC
• MSI-H/dMMR status by local testing
• Immunotherapy-naïve
• ECOG PS 0 or 1
Stratification factors:
• Prior lines of treatment (0 vs 1 vs ≥ 2)
• Primary tumor location (right vs left)
R 2:2:1
n = 353: NIVO 240 mg Q2W for 6 doses, followed by NIVO 480 mg Q4W^b
n = 354: NIVO 240 mg + IPI 1 mg/kg Q3W for 4 doses,^c followed by NIVO 480 mg Q4W^b
n = 132: Investigator's choice of chemo^d (mFOLFOX6 and FOLFIRI ± bevacizumab or cetuximab)
Treatment until disease progression, unacceptable toxicity, withdrawal of consent (all arms), or a maximum treatment duration of 2 years (NIVO and NIVO + IPI arms only)
Dual primary endpoints in patients with centrally confirmed MSI-H/dMMR status^e:
• PFS by BICR^f (NIVO + IPI vs chemo in 1L)
• PFS by BICR^f (NIVO + IPI vs NIVO across all lines)
Key secondary endpoints in patients with centrally confirmed MSI-H/dMMR status^e:
• PFS by BICR^f (NIVO + IPI vs NIVO in 1L)
• ORR
• OS
Other key endpoints in all treated patients
• Safety
• At data cutoff (May 28, 2026), median follow-up^g for all randomized patients was 68.1 (range, 37.6–81.4) months across all lines and 63.0 (range, 37.6–80.2) months in the 1L population
• The final OS analysis was initiated based on achieving 3 years of minimum follow-up
^aClinicalTrials.gov. NCT04008030. ^bPatients with ≥ 2 prior lines are randomized only to the NIVO or NIVO + IPI arms. ^cPatients can continue NIVO treatment upon early IPI discontinuation. ^dPatients receiving investigator's choice of chemo are eligible to receive NIVO + IPI upon progression (crossover treatment). ^eConfirmed using either immunohistochemistry and/or polymerase chain reaction-based tests. ^fEvaluated using RECIST v1.1. ^gTime between randomization and data cutoff across all 3 treatment arms.
4
[Slide 2]
CheckMate 8HW
Overall survival: NIVO+IPI vs NIVO across all lines
Landmark labels: NIVO+IPI 90% (12 mo), 85% (24), 81% (36), 77% (48), 74% (60); NIVO 83% (12), 72% (24), 69% (36), 65% (48), 62% (60)
Centrally confirmed MSI-H/dMMR | NIVO + IPI (n = 296) | NIVO (n = 286)
Events (%) | 78 (26) | 111 (39)
Median OS, mo 95% CI | NR (NE-NE) | NR (NE-NE)
HR (95% CI) | 0.61 (0.46-0.82)
P value | 0.0009^a
Months: 0 3 6 9 12 15 18 21 24 27 30 33 36 39 42 45 48 51 54 57 60 63 66 69 72 75 78 81
No. at risk
NIVO+IPI 296 279 273 267 264 260 257 255 251 247 245 239 238 226 216 209 199 186 176 166 151 141 114 78 62 31 3 0
NIVO 286 275 263 252 238 228 220 213 207 202 201 199 195 185 176 170 163 151 141 134 122 115 94 57 49 17 3 0
• In patients with centrally confirmed MSI-H/dMMR mCRC, NIVO + IPI demonstrated statistically significant OS benefit vs NIVO across all lines (HR, 0.61, 95% CI, 0.46-0.82, P = 0.0009)
— These data are consistent with those observed in the all-randomized population by local testing (HR, 0.64, [95% CI, 0.51-0.81])
— OS results were consistent across most prespecified subgroups
Median follow-up for all randomized patients with centrally confirmed MSI-H/dMMR mCRC was 68.1 (range, 37.6-81.4) months. ^aStatistical boundary for significance, 0.0058.
7
Survival table
Endpoint: OS (centrally confirmed MSI-H/dMMR, all lines)
Arm | N | Median | Median CI
NIVO + IPI | 296 | NR | NE-NE
NIVO | 286 | NR | NE-NE
HR: 0.61
HR CI: 0.46-0.82
P: 0.0009
Landmark rates:
12 mo: NIVO + IPI 90% | NIVO 83%
24 mo: NIVO + IPI 85% | NIVO 72%
36 mo: NIVO + IPI 81% | NIVO 69%
48 mo: NIVO + IPI 77% | NIVO 65%
60 mo: NIVO + IPI 74% | NIVO 62%
[Slide 3]
CheckMate 8HW
Efficacy summary: PFS and ORR with extended follow-up
Patients with centrally confirmed MSI-H/dMMR | All lines: NIVO + IPI (n = 296) | All lines: NIVO (n = 286) | 1L: NIVO + IPI (n = 171) | 1L: NIVO (n = 170)
Median PFS, mo (95% CI) | NR (71.7-NE) | 39.3 (23.0-58.7) | NR (64.3-NE) | 60.8 (32.8-NE)
HR (95% CI) | 0.60 (0.47-0.77) [all lines] | 0.68 (0.48-0.96) [1L]
ORR, n (%) | 213 (72) | 165 (58) | 127 (74) | 104 (61)
CR rate, n (%) | 117 (40) | 89 (31) | 70 (41) | 55 (32)
DCR, n (%) | 249 (84) | 218 (76) | 145 (85) | 137 (81)
• NIVO + IPI continued to show clinical benefit in PFS, and higher ORR rates compared with NIVO across all treatment lines at extended follow-up (descriptive analyses)
• Based on descriptive analysis, 1L NIVO + IPI continued to demonstrated clinically meaningful improvements in PFS (HR, 0.21, 95% CI, 0.14-0.32) and higher ORR (74% vs 27%) and CR (41% vs 7%) rates vs chemo, respectively
Median follow-up for all randomized patients was 68.1 (range, 37.6-81.4) months across all lines and 62.8 (range, 37.6-80.2) months in the 1L setting.
9
[Slide 4]
CheckMate 8HW
Summary
• CheckMate 8HW delivers 2 firsts in MSI-H/dMMR mCRC
— The first significant OS benefit for an IO regimen over chemo in 1L (HR, 0.37, P < 0.0001)
— The first significant OS benefit for dual IO over monotherapy across all lines (HR, 0.61, P = 0.0009)
• The 1L NIVO + IPI vs NIVO comparison shows a durable, clinically meaningful, and consistent OS benefit (HR, 0.66, P=0.0432), with 5-year OS rates (77% vs 66%), despite not satisfying its prespecified survival statistical threshold (P = 0.0058)
• With longer follow-up, descriptive analyses showed consistent PFS and ORR benefit with NIVO + IPI across all comparisons and treatment lines
• The safety profile of NIVO + IPI remained stable with longer follow-up, with low frequency of grade 3/4 toxicity despite numerically higher incidence of any-grade TRAEs with the combination, confirming tolerability alongside efficacy
• These results reinforce the durable, long-term clinical benefit of NIVO + IPI across all efficacy endpoints tested, supporting it as a global 1L standard of care in MSI-H/dMMR mCRC
11
Kaplan-Meier survival data: final overall survival: nivolumab + ipilimumab
Final OS in CheckMate 8HW #ESMO26
▪️NIVO + IPI significantly improved OS vs NIVO across all lines
▪️In 1L, a clinically relevant trend toward improved OS was observed, although not statistically significant
🔗https://t.co/OBJWAiqJ9W
@myESMO @Annals_Oncology @OncoAlert https://t.co/U1dDrPHCBP
A
Centrally confirmed MSI-H/dMMR NIVO+IPI (n = 296) NIVO (n = 286)
Total censored patients, n 218 175
Median OS, months 95% CI NR NE-NE NR NE-NE
HR (95% CI) 0.61 (0.46-0.82) P = 0.0009 (Threshold for significance P < 0.006)
Overall survival probability (%)
Months
No. at risk NIVO+IPI / NIVO
B
1L centrally confirmed MSI-H/dMMR NIVO+IPI (n = 171) NIVO (n = 170)
Total censored patients, n 132 114
Median OS, months 95% CI NR NE-NE NR NE-NE
HR (95% CI) 0.66 (0.44-0.99) P = 0.0432 (Threshold for significance P < 0.006)
Survival table
Endpoint: Overall survival (centrally confirmed MSI-H/dMMR, all lines; panel A)
Arm | N | Median | Median CI
NIVO+IPI | 296 | NR | NE-NE
NIVO | 286 | NR | NE-NE
HR: 0.61
HR CI: 0.46-0.82
P: 0.0009 (threshold for significance P < 0.006)
Panel A printed landmarks NIVO+IPI vs NIVO: 12 mo 90% vs 83%; 24 mo 85% vs 72%; 36 mo 81% vs 69%; 48 mo 77% vs 65%; 60 mo 74% vs 62%
Panel B (1L, NIVO+IPI n=171 vs NIVO n=170): median NR vs NR; HR 0.66 (0.44-0.99), P = 0.0432 (threshold P < 0.006, not met); 12 mo 90% vs 88%; 24 mo 85% vs 78%; 36 mo 84% vs 73%; 48 mo 80% vs 70%; 60 mo 77% vs 66%
1) Biomarker data: final OS: NIVO+IPI vs chemo in 1L MSI-H/dMMR mCRC KM curve · 2) Kaplan-Meier survival data: final OS: NIVO+IPI vs NIVO in 1L KM curve (ESMO 2026)
Final overall survival results from the CheckMate 8HW in MSI-H/dMMRmCRC
#ESMO26 @OncoAlert https://t.co/Bl7IAeSxpH
1) Biomarker data: 924eP e-poster on screen with authors: IPD meta-analysis of ICI · 2) Biomarker data: 924eP e-poster close-up: KM-derived IPD meta-analysis of dual
Presenting our latest research at #ESMO26! Comparing dual checkpoint blockade, anti-PD-(L)1 monotherapy, and chemoimmunotherapy in dMMR/MSI-H metastatic colorectal cancer using Kaplan–Meier-derived individual patient data. #ColorectalCancer #Immunotherapy https://t.co/vUgjHWJkHL
[Slide 2]
Dual Checkpoint Blockade, Anti–PD1/PDL1 Monotherapy and Chemoimmunotherapy in dMMR/MSI-H Metastatic Colorectal Cancer: A Kaplan–Meier-Derived Individual Patient Data Meta-Analysis (Abstract 924eP)
Matheus de Oliveira Andrade1,2; Gabriela B. E. Silva2; Lucas M. Delgado4; Anderson R. Simoes5; Rafael L. Nohmi6; Rhenan H. Silva2; Barbara Ferreira7; Gustavo Dos Santos Fernandes1
Background
Immune checkpoint inhibitors (ICIs) have transformed the treatment landscape of mismatch repair-deficient/microsatellite instability-high (dMMR/MSI-H) metastatic colorectal cancer (mCRC). The relative efficacy of dual checkpoint blockade, anti–PD1/PDL1 monotherapy, and chemoimmunotherapy strategies remains uncertain.
Methods
A systematic review and meta-analysis was conducted by searching PubMed, Embase, Cochrane, and major conference proceedings for randomized controlled trials (RCTs) evaluating ICIs in patients with dMMR/MSI-H mCRC. Pooled Kaplan–Meier-derived individual patient data analyses were performed. Outcomes included progression-free survival (PFS), overall survival (OS), and adverse events (AEs). An exploratory frequentist network meta-analysis was performed among patients with BRAF V600E mutation.
Results (included studies): KEYNOTE-177 (Phase III; I: 153, C: 154; Pembrolizumab vs CT; First line; BRAF V600E 35/153) | COMMIT (Phase III; I: 41, C: 41; Atezolizumab vs Folfox+Atezolizumab+bevacizumab; First line; I: 10/41, C: 9/41) | CHECKMATE 8HW André 2024 (Phase III; I: 202, C: 101; Nivolumab+ipilimumab vs CT; 52/202) | CHECKMATE 8HW André 2025 (I: 354, C: 353; Nivolumab+ipilimumab vs Nivolumab; First and later lines; I: 85/353, C: 106/354) | SAMCO-PRODIGE (Phase II; I: 61, C: 61; Avelumab vs CT; 2nd line; 25/61)
Dual checkpoint blockade achieved the most favorable survival outcomes across evaluated regimens, supporting nivolumab plus ipilimumab as a potentially preferred therapeutic strategy for patients with dMMR/MSI-H mCRC.
PFS (pooled KM):
Anti-PD1 + Anti-CTLA4 vs. CT: HR 0.34, 95% CI 0.27-0.41, p<0.001
Anti-PD1 + Anti-CTLA4 vs. Anti-PD1/PDL1: HR 0.68, 95% CI 0.56-0.81, p<0.001
Anti-PD1 + Anti-CTLA4 vs. CT+Anti-PDL1+bevacizumab: HR 0.51, 95% CI 0.34-0.76, p=0.001
Anti-PD1/PDL1 vs. CT: HR 0.60, 95% CI 0.51-0.71, p<0.001
Pooled KM curve of PFS including all studies (CheckMate 8HW ITT, KEYNOTE-177, SAMCO, and COMMIT) comparing nivolumab plus ipilimumab, anti-PD-1/PD-L1 monotherapy, CT plus atezolizumab and bevacizumab, and CT.
OS (pooled KM):
Anti-PD1 + Anti-CTLA4 vs. CT: HR 0.32, 95% CI 0.23-0.44, p<0.001
Anti-PD1 + Anti-CTLA4 vs. Anti-PD1/PDL1: HR 0.49, 95% CI 0.36-0.65, p<0.001
Anti-PD1 + Anti-CTLA4 vs. CT+Anti-PDL1+bevacizumab: HR 0.54, 95% CI 0.29-0.99, p=0.045
Anti-PD1/PDL1 vs. CT: HR 0.65, 95% CI 0.52-0.81, p<0.001
Pooled KM curve of OS including all studies (CheckMate 8HW ITT, KEYNOTE-177, SAMCO, and COMMIT) comparing nivolumab plus ipilimumab, anti-PD-1/PD-L1 monotherapy, CT plus atezolizumab and bevacizumab, and CT.
Exploratory frequentist NMA among patients with BRAF V600E mutation (league table, PFS HRs): ICI-ICI vs CT-ICI-AA 0.37 (0.09-1.53); ICI vs CT-ICI-AA 0.23 (0.06-0.88); ICI vs ICI-ICI 0.62 (0.39-0.98); CT vs CT-ICI-AA 0.11 (0.03-0.48); CT vs ICI-ICI 0.30 (0.14-0.62); CT vs ICI 0.48 (0.27-0.86)
Grade ≥3 AEs and treatment discontinuation rate: [forest plot values too small to transcribe reliably]
Author contact: matheusandrade.ext@americasmed.com.br; @AndradeMO_MD
1) Trial design schema: DEWI Phase II: Study design - Thierry · 2) Slide: DEWI Phase II: Study Schedule - Thierry André · 3) Slide: DEWI interim analysis (15 Jan 2026): cCR at 1 year in 25 pts · 4) Slide: DEWI analysis at data cutoff 1 Sep 2026: 43 pts, cCR at 1 year
#ESMO26 🧬 DEWI | Phase II
👥 43 pts | Localized dMMR/MSI-H GEA
💊 Dostarlimab → Watch & Wait if cCR
🎯 1-y cCR with organ preservation: 67.4% (29/43)
✅ No relapse or death among 29 W&W pts
🏥 Surgery: 14/43 (32.5%)
⚠️ Follow-up: 14.9 mo
💡 Promising organ-preserving strategy!
@OncoAlert @OncobitesTv
[Slide 1]
16:15 - 17:45 Rapid oral 1: Gastrointestinal tumour, upper digestive
CHAIRS: MARIA IGNEZ BRAGHIROLI, FENG WANG, LUCJAN WYRWICZ
DEWI Phase II: Study design
KEY ELIGIBILITY CRITERIA
• ECOG PS of 0-1,
• Age ≥18 years,
• Pts aged >70 years: G8 score of ≥14 and/or fit for surgery,
• Non-metastatic dMMR/MSI-H gastric or GEJ adenocarcinoma, cT2-T4, Nx, M0 after:
- CT of the thorax-abdomen-pelvis (TAP-CT),
- Echo-endoscopy (EUS),
- Optional coelioscopy.
PRIMARY OBJECTIVE
• To evaluate clinical complete response (cCR) at 1 year, defined as the proportion of Pts who, at 1 year after the start of treatment with dostarlimab, are:
- alive,
- without tumor resection,
- free of disease progression (on endoscopy & Thoraco-Abdo-Pelv CT scan)
- with negative biopsies
- with complete or near complete at endoscopy (Grade 3 or 4)
STATISTICAL ANALYSES: Interim Safety/Futility Analysis
• Current design: Simon two-stage,
• Planned design: Fleming three-stage,
• One-sided type I error: 0.54%, power: 95%,
• A total of 80 evaluable Pts with cCR status available at 1 year are required.
• A cCR rate at 1 year of 50% (P1) is expected.
• Interim analysis: planned after 25 Pts first pts included with 1 year of follow-up. The study will continue if ≥8 Pts (33.3%) achieve cCR at 1 year.
ClinicalTrials.gov identifier: NCT06059495
EU CT Number: 2023-506102-39-00
Thierry André
Thierry André — Watch-and-wait (W&W) strategy for dostarlimab in localized deficient dMMR/MSI-H gastroesophageal adenocarcinoma (GEA): Results from the first interim analysis of the GERCOR-GONO DEWI phase II study
ALMERIA AUDITORIUM - HALL 9
[Slide 2]
16:15 - 17:45 Rapid oral 1: Gastrointestinal tumour, upper digestive
CHAIRS: MARIA IGNEZ BRAGHIROLI, FENG WANG, LUCJAN WYRWICZ
DEWI Phase II: Study Schedule
cCR=clinical complete response; W&W=watch-and-wait; PD=disease progression
Inclusion -> DOSTARLIMAB 500 mg IV q3w, 4 cycles: C1-C4, W1-W4-W7-W10
Week 12 Evaluation:
(1) Biopsy(es) with or without tumoral cells and tumoral regression at endoscopy (stage 2-3) and without PD, W&W -> DOSTARLIMAB 500 mg IV q3w*, 4 cycles: C5-C8, W13-W15-W18-W21 -> Week 24 Evaluation:
cCR -> DOSTARLIMAB 1000 mg IV q6w*, 4 cycles: C9-C12 -> cCR: W&W / If PD STOP DOSTARLIMAB**
No cCR -> SURGERY with TGR 1a, 1b, 2 (Becker) / SURGERY with TGR 3 (Becker) -> If PD STOP DOSTARLIMAB**
(2) cCR, W&W -> DOSTARLIMAB 1000 mg IV q6w*, 2 cycles: C5-C6, W13-W19 -> Week 24 Evaluation:
cCR -> DOSTARLIMAB 1000 mg IV q6w*, 4 cycles: C7-C10, W25-W31-W37-W43 -> cCR: W&W / If PD STOP DOSTARLIMAB**
No cCR -> SURGERY proposed -> If surgery**
(3) Local/loco regional PD and biopsy(es) with tumoral cells -> SURGERY with TGR 1a, 1b, 2 (Becker) -> DOSTARLIMAB 1000 mg IV q6w*, 6 cycles: C5-C10 -> If PD STOP DOSTARLIMAB**
SURGERY with TGR 3 (Becker) -> STOP DOSTARLIMAB**
First Pt included: Jan 22, 2024
Thierry André
Thierry André — Watch-and-wait (W&W) strategy for dostarlimab in localized deficient dMMR/MSI-H gastroesophageal adenocarcinoma (GEA): Results from the first interim analysis of the GERCOR-GONO DEWI phase II study
ALMERIA AUDITORIUM - HALL 9
[Slide 3]
16:15 - 17:45 Rapid oral 1: Gastrointestinal tumour, upper digestive
CHAIRS: MARIA IGNEZ BRAGHIROLI, FENG WANG, LUCJAN WYRWICZ
Interim Analysis (15 Jan 2026): 25 Pts with 1 year follow-up and completed 12-Month evaluation (12M)
[Pie chart:] cCR at 1 year n=14 (61%); Surgery n=9 (36%); Not treated n=1; Not evaluated at 1 Y n=1
TRG Becker (n=9)
TRG 1a: no residual tumor 0
TGR 2: 10% to 50% residual tumor cells 3 (33%)
TRG 3: >50% residual tumor cells 6 (67%)
•25 Pts enrolled; 1 Pt excluded (Biermer disease, no dostarlimab treatment).
•23 Pts reached 1 year evaluation: 14/23 (61%) achieved cCR.
•1 Pt after the interim analysis achieved cCR at 1 year
• Overall cCR rate: 15/24 (62,5%).
•9/24 Pts underwent surgery.
•Median cumulative dostarlimab dose during the first 6 months: 4,000 mg.
Interim endpoint met: ≥8 Pts (33.3%) achieved cCR at 1 year; study to continue.
Thierry André
Thierry André — Watch-and-wait (W&W) strategy for dostarlimab in localized deficient dMMR/MSI-H gastroesophageal adenocarcinoma (GEA): Results from the first interim analysis of the GERCOR-GONO DEWI phase II study
ALMERIA AUDITORIUM - HALL 9
[Slide 4]
16:15 - 17:45 Rapid oral 1: Gastrointestinal tumour, upper digestive
CHAIRS: MARIA IGNEZ BRAGHIROLI, FENG WANG, LUCJAN WYRWICZ
At Analysis with data cutoff on 1 Sep 2026: 43 Pts treated and with 1 year follow-up and completed 1 year evaluation
Median follow-up: 14.9 months (Q1=14 months, Q3=15.7 months)
[Pie chart:] cCR at 1 year with organ preservation n=29; Surgery n=14 (32.5%)
TRG Becker (n=14)
TRG 1a: no residual tumor 1 (7%)
TGR 2: 10% to 50% residual tumor cells 6 (43%)
TRG 3: >50% residual tumor cells 7 (50%)
Among the 29 Pts in cCR under a Watch-and-Wait approach with organ preservation
- Median treatment duration: 10 months (range, 3-11).
- All Pts in cCR at M6 remained in cCR at 1 year.
- No relapse and no death.
- One patient refuse Watch and Wait in CCR.
Thierry André
Thierry André — Watch-and-wait (W&W) strategy for dostarlimab in localized deficient dMMR/MSI-H gastroesophageal adenocarcinoma (GEA): Results from the first interim analysis of the GERCOR-GONO DEWI phase II study
ALMERIA AUDITORIUM - HALL 9
1) Slide: DEWI interim analysis (15 Jan 2026): cCR at 1 year in 25 pts - Thierry André · 2) Slide: DEWI phase II: Safety and Outcomes (interim, 15 Jan 2026) · 3) Slide: DEWI analysis at data cutoff 1 Sep 2026: 43 pts, cCR at 1 year with organ · 4) Slide: DEWI: Conclusion and Future Directions - Thierry André
W&W strategy for dostarlimab in localized deficient dMMR/MSI-H GC/GEJC: Results from the first interim analysis of the GERCOR-GONO DEWI phase II study
#ESMO26 #ESMOAmbassadors
👉 25pts enrolled, 33% of pts achieved cCR at 1yr
👉 1 pts with PD
🧐Study continues
@myESMO @ASCO https://t.co/nrNaUYfkDC
Context: at the interim analysis (15 Jan 2026) the presented slide reports cCR at 1 year in 14/23 patients (61%), overall 15/24 (62.5%); the interim endpoint was cCR at 1 year in at least 8 patients (33.3%) (GERCOR-GONO DEWI, ESMO 2026).
[Slide 1]
Interim Analysis (15 Jan 2026): 25 Pts with 1 year follow-up and completed 12-Month evaluation (12M)
[Pie chart:] cCR at 1 year n=14 (61%); Surgery n=9 (36%); Not treated n=1; Not evaluated at 1 Y n=1
TRG Becker (n=9)
TRG 1a: no residual tumor 0
TGR 2: 10% to 50% residual tumor cells 3 (33%)
TRG 3: >50% residual tumor cells 6 (67%)
•25 Pts enrolled; 1 Pt excluded (Biermer disease, no dostarlimab treatment).
•23 Pts reached 1 year evaluation: 14/23 (61%) achieved cCR.
•1 Pt after the interim analysis achieved cCR at 1 year
• Overall cCR rate: 15/24 (62,5%).
•9/24 Pts underwent surgery.
•Median cumulative dostarlimab dose during the first 6 months: 4,000 mg.
Interim endpoint met: ≥8 Pts (33.3%) achieved cCR at 1 year; study to continue.
Thierry André
[Slide 2]
DEWI phase II: Safety and Outcomes
Planned Interim Analysis (15 Jan 2026): 25 Pts with at least 1 year follow-up
Median follow-up = 14.06 months in Feb 2026
SAFETY (N=24)
•Grade 3-4 dostarlimab-related AEs: 21%.
•Treatment interruption for SAE (n=5, 4 Pts had surgery and one had cCR after 8 dostarlimab doses as administered intravenously)
•Surgery performed in 9/24 Pts:
• 4 fistulas including 2 esophagogastric anastomotic fistulas
• 1 postoperative death related to a fistula complications.
DISEASE CONTROL AND OVERALL SURVIVAL
•1 Pts with metastatic disease progression (sus clav nodes after surgery)
•1 death: 1 postoperative death related to a fistula complications.
[Slide 3]
At Analysis with data cutoff on 1 Sep 2026: 43 Pts treated and with 1 year follow-up and completed 1 year evaluation
Median follow-up: 14.9 months (Q1=14 months, Q3=15.7 months)
[Pie chart:] cCR at 1 year with organ preservation n=29; Surgery n=14 (32.5%)
TRG Becker (n=14)
TRG 1a: no residual tumor 1 (7%)
TGR 2: 10% to 50% residual tumor cells 6 (43%)
TRG 3: >50% residual tumor cells 7 (50%)
Among the 29 Pts in cCR under a Watch-and-Wait approach with organ preservation
- Median treatment duration: 10 months (range, 3-11).
- All Pts in cCR at M6 remained in cCR at 1 year.
- No relapse and no death.
- One patient refuse Watch and Wait in CCR.
Thierry André
[Slide 4]
Conclusion and Future Directions
• Interim analysis met primary endpoint.
• About 2/3 of patients in this preliminary results with 43 patients are in CCR at 1 year with organ preservation without relapse or death.
• Additional cohort of 20 surgery-unfit Pts (elderly and/or with comorbidities) currently enrolled, 1-year cCR analysis planned in 202.
• Target enrollment: 89 surgery-fit and 39 surgery-unfit Pts.
• Translational studies (ctDNA and transcriptomic profiling) is ongoing to identify predictive biomarkers to support early selection for surgery versus watch-and-wait management.
Thierry André
🚨 #ESMO26 | DEWI phase II
Dostarlimab + watch & wait in localized dMMR/MSI-H GEJ cancer:🔹 67.4% (29/43) achieved cCR at 1 year with organ preservation. 🔹 No relapse or death in the W&W.
🌟 A potentially practice-changing, surgery-sparing strategy! #GIOnc @OncoAlert https://t.co/opHQN8rARY
1) Response data: Clinical complete response: residual · 2) Kaplan-Meier survival data: at 5 years: active · 3) Biomarker data: MSI-H/dMMR gastric: NEONIPIGA · 4) Biomarker data: INFINITY and DEWI organ preservation
#ESMO26 | Gastric Cancer
- Can immunotherapy enable organ preservation?
- Interesting results in MSI-H/dMMR tumors from INFINITY & DEWI.
- cCR ≠ cure. ctDNA may help assess residual risk.
The challenge: identifying who could safely avoid surgery.
@OncoAlert #GastricCancer https://t.co/jRaaXTP6PN
Slide: DEWI phase II interim analysis (15 Jan 2026): baseline characteristics, n=24
Organ preservation beyond the rectum? 👀
DEWI phase II at #ESMO26!
Dostarlimab in localised dMMR/MSI-H gastroesophageal adenoCA:
👉 29/43 (67%) cCR at 1 yr organ prev
👉 All pts in cCR @ 6m --> cCR @ 1yr
👉 No relapse/death among 29 pts on W&W; med FU 14.9 m #ESMOAmbassadors https://t.co/wPwU4fn9rB
[Slide 1]
14:45 - 16:15 Rapid oral: Gastrointestinal tumours, lower digestive
CHAIRS: LISA SALVATORE, KAI-KEEN SHIU, RONA YAEGER
Combination of Temab-A + Bev in Patients With 3L+ CRC in the First-in Human Study (NCT05029882)
Key Inclusion Criteria (Part 7)
• Adult patients with metastatic CRC, irrespective of c-Met protein expression level
• Progression on fluoropyrimidine, oxaliplatin, and irinotecan, and if applicable, anti-EGFR or anti-VEGF monoclonal antibody, or other targeted therapy
• Measurable disease per RECIST v1.1
• ECOG PS 0–1
• Hemoglobin ≥ 8 g/dL (with no RBC transfusion in the past 14 days)
Key Exclusion Criteria (Part 7)
• BRAF V600E mutation
• dMMR+/MSI-H
• Prior regorafenib or FTD-TPI treatment
Part 7: Temab-A and Bev Combination Therapy
Safety Lead-In (Part 7a): DL1 (1.6 mg/kg; n=7) | DL2 (2.4 mg/kg; n=8) | Backfill DL3 (2.0 mg/kg; n=5)
Temab-A + Bev 7.5 mg/kg IV Q3W
Dose Optimization (Part 7b): R (1:1:1) N=66
Arm 1a Temab-A 2.0 mg/kg Q3W + Bevb (n=22)
Arm 2 Temab-A 2.4 mg/kg Q3W + Bevb (n=22)
Arm 3 Comparator (SOC)c FTD-TPI + Bevd (n=22)
Primary Objective (Part 7)
• Evaluate the safety, efficacy, and pharmacokinetics of Temab-A in combination with Bev vs FTD-TPI + Bev in patients with 3L+ CRC
Data cutoff date: 02March2026. aOne patient withdrew and was not treated. b7.5 mg/kg Q3W. cTwo patients withdrew and were not treated. d5.0 mg/kg Q2W.
3L+, third-line and beyond; Bev, bevacizumab; CRC, colorectal cancer; DL, dose level; dMMR, deficient DNA mismatch pair; ECOG PS, Eastern Cooperative Oncology Group performance status; EGFR, epidermal growth factor receptor; FTD-TPI, trifluridine/tipiracil; IV, intravenous; MSI-H, microsatellite instability-high; Q3W, every 3 weeks; R, randomization; RBC, red blood cells; RECIST, Response Evaluation Criteria in Solid Tumors; SOC, standard of care; Temab-A, telisotuzumab adizutecan; VEGF, vascular endothelial growth factor.
Michael Cecchini
Long-term follow-up of telisotuzumab adizutecan (ABBV-400, Temab-A) in combination with bevacizumab (Bev) vs standard of care (SOC) in patients (pts) with 3L+ colorectal cancer (CRC): Updated results of a phase 1 study
ALICANTE AUDITORIUM - HALL 6
[Slide 2]
14:45 - 16:15 Rapid oral: Gastrointestinal tumours, lower digestive
CHAIRS: LISA SALVATORE, KAI-KEEN SHIU, RONA YAEGER
TRAEs Were Primarily Hematologic and Gastrointestinal and Were Manageable
Most common TRAEsa
Temab-A 2.4 mg/kg + Bev (n=30): Grade ≥3 | Grade 1-2 || FTD-TPI + Bev (n=20): Grade 1-2 | Grade ≥3
Patients (%)
Anemia | 53 | 13 || 15 | 15
Neutropenia | 33 | 20 || 30 | 30
Thrombocytopenia | 10 | 23 || 30 | 5
Nausea | – | 57 || 50 | –
Fatigue | 7 | 37 || 35 | –
Vomiting | – | 40 || 25 | –
Decreased appetite | – | 30 || 20 | –
Diarrheab | – | 20 || 30 | 5
Management of TRAEs | Temab-A 2.4 mg/kg + Bev (n=30) | FTD-TPI + Bev (n=20)
Median treatment duration, months (range) | 6.1 (1.4–19.8) | 4.9 (0.9–14.0)
Treatment discontinuation, n (%) | 1 (3) | 1 (5)
Dose reduction, n (%) | 15 (50) | 6 (30)
Dose interruption, n (%) | 22 (73) | 9 (45)
• There were no TRAEs leading to death
• Adjudicated ILD/pneumonitis rate was 3% (Grade 3: n=1) among 30 patients who received 2.4 mg/kg Temab-A + Bev
Data cutoff date: 02March2026.
aAny grade reported in ≥20% of patients. bAll events of diarrhea with Temab-A were Grade 1.
Bev, bevacizumab; FTD-TPI, trifluridine/tipiracil; ILD, interstitial lung disease; Temab-A, telisotuzumab adizutecan; TRAE, treatment-related adverse event.
Michael Cecchini
Long-term follow-up of telisotuzumab adizutecan (ABBV-400, Temab-A) in combination with bevacizumab (Bev) vs standard of care (SOC) in patients (pts) with 3L+ colorectal cancer (CRC): Updated results of a phase 1 study
ALICANTE AUDITORIUM - HALL 6
[Slide 3]
14:45 - 16:15 Rapid oral: Gastrointestinal tumours, lower digestive
CHAIRS: LISA SALVATORE, KAI-KEEN SHIU, RONA YAEGER
Temab-A 2.4 mg/kg + Bev Shows Promising Efficacy Over FTD-TPI + Bev With a Median PFS of 6.8 Months
Median follow-up: 18.2 months (range 0.4–22.8)
PFS | Temab-A 2.4 mg/kg + Bev (n=30) | FTD-TPI + Bev (n=20)
Events, n (%) | 27 (90.0) | 18 (90.0)
Median PFS, months (95% CI) | 6.8 (5.4–9.5) | 4.2 (1.8–6.3)
HR (95% CI) | 0.48 (0.26–0.89)
Legend: Temab-A 2.4 mg/kg + Bev | FTD-TPI + Bev
Y-axis: Probability; X-axis: Time (Months) 0–20
Patients at Risk
Temab-A 2.4 mg/kg | 30 | 30 | 28 | 26 | 25 | 21 | 19 | 12 | 12 | 11 | 4 | 4 | 4 | 4 | 3 | 2 | 1 | 1 | 1 | 1 | 0
FTD-TPI | 20 | 19 | 15 | 12 | 11 | 9 | 7 | 4 | 4 | 2 | 1 | 1 | 1 | 1 | 0 | 0 | 0 | 0 | 0 | 0 | 0
Data cutoff date: 02March2026.
Bev, bevacizumab; FTD-TPI, trifluridine/tipiracil; HR, hazard ratio; PFS, progression-free survival; Temab-A, telisotuzumab adizutecan.
Michael Cecchini
Long-term follow-up of telisotuzumab adizutecan (ABBV-400, Temab-A) in combination with bevacizumab (Bev) vs standard of care (SOC) in patients (pts) with 3L+ colorectal cancer (CRC): Updated results of a phase 1 study
ALICANTE AUDITORIUM - HALL 6
Survival table
Endpoint: PFS
Arm | N | Median | Median CI
Temab-A 2.4 mg/kg + Bev | 30 | 6.8 months | 5.4–9.5
FTD-TPI + Bev | 20 | 4.2 months | 1.8–6.3
HR: 0.48
HR CI: 0.26–0.89
[Slide 4]
14:45 - 16:15 Rapid oral: Gastrointestinal tumours, lower digestive
CHAIRS: LISA SALVATORE, KAI-KEEN SHIU, RONA YAEGER
Conclusions
Temab-A 2.4 mg/kg + Bev showed sustained clinically meaningful improvements in efficacy outcomes, including ORR (30%), median PFS (6.8 months), and median OS (14.7 months; HR=0.62)
The safety profile was manageable with low discontinuation rates; hematologic adverse events were managed with dose interruptions and reductions
The regimen is being evaluated in the global randomized Phase 3 trial AndroMETa-CRC-560 (NCT07525206)
For additional information, refer to the manuscript published concurrently in Annals of Oncology
Thank you to the patients, study sites, and investigators who participated in this clinical trial.
AbbVie funded this study and participated in the study design, research, analysis, data collection, interpretation of data, reviewing, and approval of the publication. All authors had access to relevant data and participated in the drafting, review, and approval of this publication. No honoraria or payments were made for authorship. Medical writing support was provided by Marianne Pons, PhD, and Phillip Giannopoulos, PhD, CMPP of Bio Connections, LLC, and funded by AbbVie.
Bev, bevacizumab; CRC, colorectal cancer; HR, hazard ratio; ORR, objective response rate; OS, overall survival; PFS, progression-free survival; Temab-A, telisotuzumab adizutecan.
Copies of this presentation obtained through Quick Response (QR) Code are for personal use only and may not be reproduced without permission from ESMO or the author of this presentation. Scan QR code to download an electronic version of this presentation.
To submit a medical question, please visit www.abbviemedinfo.com
Michael Cecchini
Long-term follow-up of telisotuzumab adizutecan (ABBV-400, Temab-A) in combination with bevacizumab (Bev) vs standard of care (SOC) in patients (pts) with 3L+ colorectal cancer (CRC): Updated results of a phase 1 study
ALICANTE AUDITORIUM - HALL 6
Kaplan-Meier survival data: Screenshot of presented KM
TEMAB-A (ABBV-400) is an ADC focused on on cmet with topo 1 payload in a ph I trial of ABBV-400 + bev vs. TAS-102 + bev in previously treated metastatic #colorectal #cancer. @OncoAlert @oncodaily #ESMO2026
Median follow-up: 18.2 M
Median OS 14.7M and HR = 0.62
Proceeding onto Ph 3 trial: NCT06614192
@Cecchini_OncMD
Long-term follow-up of Temab-A with Bev vs SOC in 3L+ CRC: Updated results of a ph 1
#ESMO26 #ESMOAmbassadors
👉 mPFS: 6.8 vs 4.2 mo
👉 mOS: 14.7 vs 10.2 mo
👉 manageable safety
🧐Promising, ph-3 ongoing
@myESMO @ASCO https://t.co/wPzOVvO83s
A Randomized Phase 1 Study of Telisotuzumab Adizutecan (ABBV-400, Temab-A) in Combination With Bevacizumab Versus Trifluridine-Tipiracil With Bevacizumab in Patients With Metastatic Colorectal Cancer
Michael Cecchini, Marcia Cruz-Correa, Sae-Won Han, Kanwal Raghav, Ana Landa-Magdalena, John Strickler, Aitana Calvo, Antoine Hollebecque, Takako Eguchi Nakajima, Gali Perl, Vikram Jain, Zoë Hunter, Edward M. Chan, Martha Blaney, Rui Li, Athan Vasilopoulos, Apurvasena Parikh, Manish R. Sharma
BACKGROUND
- Temab-A is an ADC composed of the c-Met-directed antibody, telisotuzumab, conjugated to a novel topoisomerase 1 inhibitor
- Increased expression of c-Met protein is common in CRC and carries a poor prognosis
[Schematic: Validated c-Met-targeted antibody (telisotuzumab); Potent Top1i payload (adizutecan); Stable linker - Minimizes free-payload toxicity; Antitumor effect of Temab-A does not rely on c-Met signaling, unlike c-Met protein-targeting TKIs and mAbs]
STUDY DESIGN
First in human, phase 1 study of combination Temab-A and bevacizumab in c-Met unselected patients with 3L+ CRC (NCT05029882)
Safety lead-in and randomized dose optimization
- Median 3 prior lines of therapies
- ~90% prior bevacizumab in Temab-A arms
Safety Lead-In (Part 7a): DL1 (1.6 mg/kg; n=7) -> DL2 (2.4 mg/kg; n=8); Backfill DL3 (2.0 mg/kg; n=5); Temab-A + Bev 7.5 mg/kg IV Q3W
Dose Optimization (Part 7b): R (1:1:1) N=66 -> Arm 1: Temab-A 2.0 mg/kg Q3W + Bev (n=22); Arm 2: Temab-A 2.4 mg/kg Q3W + Bev (n=22); Arm 3 Comparator (SOC): TFD-TPI + Bev (n=22)
KEY RESULTS - Selected dose: Temab-A 2.4 mg/kg + Bev; Median follow-up: 18.2 months
Safety and Tolerability
[Butterfly chart, Patients (%), Temab-A 2.4 mg/kg + Bev (n=30) vs FTD-TPI + Bev (n=20), Grade ≥3 / Grade 1-2: Anemia, Neutropenia, Thrombocytopenia, Nausea, Fatigue, Vomiting, Decreased appetite, Diarrhea - bar values small; see notes]
| Temab-A 2.4 mg/kg + Bev (n=30) | FTD-TPI + Bev (n=20)
Median treatment duration, months (range) | 6.1 (1.4-19.8) | 4.9 (0.9-14.0)
Treatment discontinuation, n (%) | 1 (3) | 1 (5)
Dose reduction, n (%) | 15 (50) | 6 (30)
Dose interruption, n (%) | 22 (73) | 9 (45)
- No TRAEs leading to death
- Adjudicated ILD/pneumonitis rate was 3% (Grade 3: n=1) in patients treated with 2.4 mg/kg Temab-A + Bev
Efficacy
ORR 30% vs 0% with FTD-TPI + Bev
MEDIAN PFS 6.8 months vs 4.2 months with FTD-TPI + Bev (HR: 0.48)
MEDIAN OS 14.7 months vs 10.2 months with FTD-TPI + Bev (HR: 0.62)
- c-Met protein expression was detected in the tumors of all patients
- Longer survival observed with Temab-A + Bev over FTD-TPI + Bev across c-Met protein expression levels
Temab-A 2.4 mg/kg + Bev showed sustained clinically meaningful improvements in efficacy outcomes, and the safety profile was manageable with low discontinuation rates; hematologic adverse events were managed with dose interruptions and reductions. Temab-A 2.4mg/kg is being evaluated in the global randomized Phase 3 trial, AndroMETa-560 (NCT07525206)
Bev, bevacizumab; CRC, colorectal cancer; FTD-TPI, trifluridine-tipiracil; HR, hazard ratio; ORR, objective response rate; OS, overall survival; PFS, progression-free survival; Q3W, every 3 weeks; TRAE, treatment-related adverse event.
Thoughtful discussion by Lisa Salvatore: Temab-A + Bev shows promise in mCRC, but haematological toxicity matters.
Questions unanswered: What does Bev add? Can c-Met guide selection? What is the optimal dose? Awaiting Phase III validation #ESMO26 #ESMOAmbassadors @OncoAlert https://t.co/n0clts8P3q
A randomized trial of paclitaxel ± tovecimig in previously treated patients with advanced biliary tract cancer
#ESMO26 #ESMOAmbassadors
👉 ORR: 18 vs 5.3%
👉 mPFS: 4.7 vs 2.6 mo
👉 mOS: 8.9 vs 9.4 mo
🧐Active drug, but no OS benefit in 2nd line, could be explored in 1L
@myESMO @ASCO
COMPANION-002 Proffered paper by #NiloAzard on #tovecimig (VEGFA-DLL4) + paclitaxel vs paclitaxel after prior chemo in #BiliaryMalignancies
ORR 18% vs 5%
PFS 4.7 vs 2.6; HR 0.4
Higher dose modification
👉Development continues
@myESMO #ESMO26 #ESMOAmbassadors https://t.co/M2g5xoL3qA
Phase 2/3 COMPANION-002 Conclusions
• Tovecimig + paclitaxel met the primary endpoint: ORR 18.0% vs 5.3% (p=0.0228), with durable responses (median DOR 4.9 months)
• Disease control rate was also significantly improved: 62.2% vs 36.8% (p=0.0018)
• PFS was significantly prolonged: 4.7 vs 2.6 months (HR=0.44, p<0.0001)
• Overall survival may have been confounded by crossover, with 54% of paclitaxel patients receiving tovecimig
• Addition of tovecimig to paclitaxel in cross-over setting doubled first line paclitaxel only PFS (3.9 vs 1.5 months, HR=0.40, p=0.0035) and those crossover patients survived for a median of 12.8 months.
• Safety was manageable and consistent with prior studies and the anti-VEGF class, with no new safety signals
• Overall, 28.8% of patients treated with tovecimig + paclitaxel discontinued the treatment regimen due to an adverse event; most TEAEs leading to discontinuation were consistent with known anti-angiogenic and chemotherapeutic toxicities.
• Tovecimig + paclitaxel is a promising option for patients with BTC who have been previously treated
Nilofer Azad, MD
In summary, this might be what we were looking for
Question | My take | My Comments
Is this study promising? | YES | • Promising MoA and targets • Low bar in the second line setting
Did it meet its primary endpoint? | YES | • ORR 18% vs 5.3% (p=0.0228) • Clear signs of clinical activity PFS HR 0.44 • We need to identify patients who benefit the most
Will it change practice? | ? | • We would want a phase III trial with FOLFOX as control arm demonstrating a clear OS benefit • Given the high unmet need of these patients, a formal review by a relevant guideline committee is warranted
Sebastián Mondaca, MD, MBA
Slide: Screenshot of presented mechanism background slide
Paclitaxel +\-tovecimig: COMPANION-002 ph2/3
➡️prev treated #BTC wo actionable alterations
➡️ORR 17.1 v5.3%; DCR 62 v 37%
➡️mPFS 4.7 v 2.6mths - benefits seen at PFS2 noting crossover
➡️OS not sig but nb crossover
@myESMO #ESMO26 @OncoAlert https://t.co/eeR74Ehqed
Tovecimig: Next-generation Angiogenesis Disrupting Bispecific Antibody
[Antibody schematic: VEGF-A and DLL4 binding arms; 2x2 target binding valency]
Anti-VEGF-A MAb — VEGF/VEGF-R signaling — Disrupts tumor vessel formation (proven anti-angiogenic mechanism)
Anti-DLL4 MAb — DLL4-Notch-1 signaling — Targets tumor DLL4 expression and alters perfusion in tumor vessels (novel angiogenesis target)
• Dual blockade:
VEGF-A – validated target for blockbuster oncology therapeutics (e.g.: Avastin®)
DLL4 (Notch-1 ligand) – mediates resistance to anti-VEGF therapies
• Bispecific anchors in tumor microenvironment (DLL4) to disrupt angiogenesis
• Only DLL4 × VEGF bispecific to demonstrate monotherapy activity in patients with CRC and GC¹
• Preclinical combination activity and an encouraging early BTC response signal supported further development of tovecimig + paclitaxel in Phase 2; the same dose and schedule were subsequently carried forward into COMPANION-002.
Nilofer Azad, MD
¹ Lee, J et al. 2021, October 7-10. Plenary Presentation AACR-NCI-EORTC Virtual International Conference on Molecular Targets and Cancer Therapeutics
2 Oh DY, et al. ASCO Gastrointestinal Cancers Symposium, January 19-21, 2023. Abstract 54[illegible]
Trial design schema: JCO visual abstract: design and key efficacy
‼️ #ESMO26 simultaneous publication by Azad, et al.
COMPANION-002: A Randomized Phase 2/3 Trial of Tovecimig Plus Paclitaxel Versus Paclitaxel Alone as a Second-line Therapy in Patients with Advanced Biliary Tract Cancer
Read full publication: https://t.co/Aq3sCJeyFL https://t.co/6u1hjOvzad
COMPANION-002: A Randomized Phase 2/3 Trial of Tovecimig Plus Paclitaxel versus Paclitaxel Alone as a Second-line Therapy in Patients with Advanced Biliary Tract Cancer
COMPANION-002: randomized, open-label phase 2/3 trial (34 US sites)
Advanced BTC progressed on 1L gemcitabine + platinum N = 168 → R 2:1
Tovecimig 10 mg/kg IV D1, D15 + paclitaxel 80 mg/m² D1, D8, D15, q28d (n = 111)
Crossover after BICR-confirmed PD: 31/57 (54%)
Paclitaxel alone 80 mg/m² D1, D8, D15, q28d (n = 57)
Primary endpoint: ORR by BICR (RECIST v1.1) • Key secondary endpoints: PFS, OS, DCR
Objective response rate (primary) P = .0228: 18.0% | 5.3%
Disease control rate P = .0018: 62.2% | 36.8%
Progression-free survival (BICR): Median 4.7 vs 2.6 mo; HR 0.44 (95% CI 0.30–0.66); P < .0001
No. at risk: 111 30 8 3 1 | 57 9 2
Months since randomization
Target lesion response [waterfall; 204%; +20% (PD); −30% (PR)]; Individual patients (T+P, n = 88; P, n = 47)
Tovecimig + paclitaxel (T+P) | Paclitaxel alone (P)
Relevance:
The combination of tovecimig, a novel bispecific antibody targeting DLL4/VEGFA, and taxane chemotherapy demonstrated interesting activity in previously treated biliary cancers. Development continues in treatment-naiive biliary cancer.*
Relevance statement written by JCO Associate Editor Eileen M. O'Reilly, MD, FASCO.
Fig. Design and key efficacy outcomes of COMPANION-002 (NCT05506943), a randomized, open-label phase 2/3 trial. Patients with advanced BTC that progressed on one prior gemcitabine/platinum-based regimen were randomized 2:1 to tovecimig plus paclitaxel (n = 111) or paclitaxel alone (n = 57); crossover was permitted after BICR-confirmed progression. ORR, DCR, and PFS were assessed by BICR per RECIST v1.1 in the ITT population; P values are two-sided. Waterfall plot shows maximum percentage change from baseline in target lesion size (evaluable patients); dashed lines indicate RECIST v1.1 thresholds for PR (−30%) and PD (+20%). 1L, first-line; BICR, blinded independent central review; BTC, biliary tract cancer; D, day; DCR, disease control rate; HR, hazard ratio; ITT, intent-to-treat; ORR, objective response rate; OS, overall survival; PD, progressive disease; PR, partial response; PFS, progression-free survival; q28d, every 28 days; R, randomization.
Azad et al. (2026) | Journal of Clinical Oncology | DOI: 10.1200/JCO-26-02188
Journal of Clinical Oncology An American Society of Clinical Oncology Journal
1) Kaplan-Meier survival data: OS in the ITT population, anbenitamab + chemotherapy · 2) Trial design schema: study design (NCT05427383): anbenitamab + chemotherapy · 3) Response data: IRC and investigator-assessed ORR, DoR and PFS
China keeps delivering new assets and studies, now in HER2+ gastric 🇨🇳
KC-WISE updated OS at #ESMO26. Double-blind phase 3 in HER2+ GC/GEJC after progression on trastuzumab: anbenitamab (biparatopic HER2 bispecific) + chemo vs placebo + chemo.
• ORR 56 vs 14% • mPFS 7.1 vs 2.7 mo • mOS 19.6 vs 9.7 mo, HR
Almost 20 months median OS in second line. The control arm is single-agent chemo, so the bar wasn't high. But the OS doubled, and that's hard to argue with.
Takeaway: HER2 is still a target after trastuzumab. Sequential HER2 blockade works.
The question I can't answer yet: HERIZON just moved zanidatamab to 1L. Once patients get a biparatopic up front, does a second one still work in 2L? Or does that spot go to T-DXd?
Also, Should point out 20 months is significantly lower than what we saw on HERIZON which hit 26-27 month.
@OncoAlert @TheGutOncLab
Anbenitamab plus chemotherapy for previously treated HER2-positive GC/GEJC: Updated OS analysis of KC-WISE 🇨🇳
#ESMO26 #ESMOAmbassadors
👉 ORR: 56 vs 13%
👉 mOS: 19.6 vs 9.7 mo
👉no unexpected safety signal
🧐Supports sequential targeting of Her2
@myESMO @ASCO https://t.co/oEFpvVYVn8
1) Slide: NEJM article text: anbenitamab (KN026) and HB1801 background · 2) Kaplan-Meier survival data: NEJM Figure 2: PFS by BICR and subgroup analysis · 3) Safety data: NEJM Table 3: Summary of adverse events, anbenitamab plus HB1801 vs THP
Anbenitamab plus HB1801 . Her2 targeting Bispecific antibody from China and aluminum bound docetaxel vs THP . PFS HR 0.46 . Published in @nejm . Needle in Her2 positive is moving fast @OncBrothers @OncoAlert @dr_yakupergun @myESMO #esmo26 https://t.co/VBsM1ev11N
[Slide 2]
Anbenitamab (KN026) is a HER2-targeted bispecific antibody with superior binding affinity, inhibitory potency, and HER2 internalization relative to trastuzumab or pertuzumab17; it has recently been approved by the National Medical Products Administration (China) for the second- and later-line treatment of HER2-positive advanced gastric cancer on the basis of the KC-WISE trial.18 HB1801 is an albumin-bound docetaxel. Previous clinical studies showed that HB1801 had improved antitumor activity in advanced gastric cancer.19
[Slide 3]
FIGURE 2
A Progression-free Survival as Assessed by Blinded Independent Central Review
Anbenitamab plus HB1801 (58.5 at 24 months); THP (34.4 at 24 months)
Hazard ratio for disease progression or death, 0.46 (95% CI, 0.37 to 0.56) P<0.001
Months since Randomization
No. at Risk
Anbenitamab plus HB1801: 445 430 407 345 324 217 173 113 86 38 7 0
THP: 440 410 368 274 232 144 110 75 50 28 5 0
B Subgroup Analysis of Progression-free Survival
Subgroup | Anbenitamab plus HB1801 | THP (no. of patients with event/total no. of patients) | Hazard Ratio for Disease Progression or Death (95% CI)
All patients | 149/445 | 252/440 | 0.46 (0.38 to 0.57)
Age <65 yr | 135/389 | 218/362 | 0.45 (0.37 to 0.56)
Age ≥65 yr | 14/56 | 34/78 | 0.47 (0.25 to 0.88)
ECOG 0 | 71/251 | 130/236 | 0.38 (0.28 to 0.51)
ECOG 1 | 78/194 | 120/202 | 0.59 (0.44 to 0.79)
Previous neoadjuvant or adjuvant therapy Yes | 60/165 | 95/161 | 0.49 (0.36 to 0.68)
No | 89/280 | 157/279 | 0.45 (0.35 to 0.58)
Previous treatment with trastuzumab Yes | 30/81 | 56/91 | 0.47 (0.30 to 0.74)
No | 119/364 | 196/349 | 0.46 (0.37 to 0.58)
Previous treatment with pertuzumab Yes | 14/29 | 23/32 | 0.46 (0.23 to 0.90)
No | 135/416 | 229/408 | 0.46 (0.38 to 0.58)
Hormone-receptor status Positive | 95/244 | 150/243 | 0.48 (0.37 to 0.62)
Negative | 54/201 | 102/197 | 0.44 (0.31 to 0.61)
Visceral metastasis Yes | 114/316 | 190/316 | 0.47 (0.37 to 0.59)
No | 35/129 | 62/124 | 0.46 (0.30 to 0.69)
Liver metastasis Yes | 57/156 | 111/181 | 0.46 (0.33 to 0.63)
No | 92/289 | 141/259 | 0.47 (0.36 to 0.62)
Bone metastasis Yes | 85/206 | 119/193 | 0.55 (0.42 to 0.73)
No | 64/239 | 133/247 | 0.38 (0.29 to 0.52)
No. of distant metastatic sites 1 or 2 | 92/310 | 148/288 | 0.46 (0.36 to 0.60)
≥3 | 56/125 | 98/141 | 0.50 (0.36 to 0.70)
HER2 status IHC score of 3+ | 108/374 | 207/385 | 0.43 (0.34 to 0.54)
IHC score of 2+ and FISH-positive | 41/71 | 45/55 | 0.44 (0.29 to 0.69)
Stage IV disease at initial diagnosis Yes | 85/253 | 139/246 | 0.48 (0.37 to 0.63)
No | 64/192 | 113/194 | 0.45 (0.33 to 0.61)
Anbenitamab plus HB1801 Better | THP Better
Progression-free Survival, Overall and According to Subgroup Analyses (Intention-to-Treat Population).
Survival table
Endpoint: PFS by BICR (ITT)
Anbenitamab plus HB1801 | 445
THP | 440
HR: 0.46
HR CI: 0.37 to 0.56
P: <0.001
Landmark rates:
24 months: Anbenitamab plus HB1801 58.5% | THP 34.4%
[Slide 4]
TABLE 3
Table 3. Summary of Adverse Events.*
Anbenitamab plus HB1801 (N=444) All Grades | Grade ≥3 || THP (N=439) All Grades | Grade ≥3
number of patients (percent)
Any adverse event | 444 (100) | 204 (45.9) | 434 (98.9) | 151 (34.4)
Common adverse events†
Anemia | 330 (74.3) | 21 (4.7) | 250 (56.9) | 15 (3.4)
Diarrhea‡ | 236 (53.2) | 10 (2.3) | 176 (40.1) | 5 (1.1)
Alopecia | 229 (51.6) | 0 | 172 (39.2) | 0
ALT level increased | 192 (43.2) | 6 (1.4) | 163 (37.1) | 6 (1.4)
Leukopenia | 190 (42.8) | 43 (9.7) | 144 (32.8) | 24 (5.5)
Neutropenia | 181 (40.8) | 58 (13.1) | 146 (33.3) | 37 (8.4)
AST level increased | 175 (39.4) | 6 (1.4) | 158 (36.0) | 6 (1.4)
Hypoalbuminemia | 167 (37.6) | 0 | 100 (22.8) | 1 (0.2)
Weight loss | 155 (34.9) | 3 (0.7) | 106 (24.1) | 2 (0.5)
Hypertriglyceridemia | 152 (34.2) | 14 (3.2) | 154 (35.1) | 12 (2.7)
Peripheral edema | 128 (28.8) | 3 (0.7) | 64 (14.6) | 1 (0.2)
Asthenia | 119 (26.8) | 4 (0.9) | 85 (19.4) | 2 (0.5)
Weight gain | 114 (25.7) | 1 (0.2) | 83 (18.9) | 0
Hypokalemia | 113 (25.5) | 15 (3.4) | 61 (13.9) | 7 (1.6)
Urinary tract infection | 103 (23.2) | 2 (0.5) | 85 (19.4) | 2 (0.5)
Hyperchloesterolemia | 101 (22.7) | 0 | 122 (27.8) | 0
Nausea | 95 (21.4) | 1 (0.2) | 70 (15.9) | 0
* Listed are adverse events that occurred up to 30 days after the last administration of trial drugs or initiation of new antitumor treatment (whichever occurred first). The events are listed in descending order of frequency in the anbenitamab group. Safety analyses were performed in the safety population, which included all the patients who had undergone randomization and received at least one dose of a trial drug. The adverse events were coded according to the Medical Dictionary for Regulatory Activities, version 28.1, and graded according to the National Cancer Institute Common Terminology Criteria for Adverse Events, version 5.0. ALT denotes alanine aminotransferase, and AST aspartate aminotransferase.
† Adverse events that occurred in at least 20% of the patients in either group are reported.
‡ Diarrhea led to dose reduction in five patients (1.1%) in the anbenitamab group and two patients (0.5%) in the THP group and to treatment interruption in two patients (0.5%) and one patient (0.2%), respectively. No patients discontinued treatment owing to diarrhea. Primary prophylaxis for diarrhea was administered to 7.2% of the patients in the anbenitamab group and to 8.0% of those in THP group.
Summary of Adverse Events.
Kaplan-Meier survival data: updated OS in ITT population - anbenitamab +
#ESMO26 🧬 KC-WISE | Phase III
👥 246 pts | HER2+ GC/GEJ after trastuzumab
💊 Anbenitamab + CT vs CT
🚀 OS: 19.6 vs 9.6 mo (HR 0.39; p<0.0001)
📈 PFS: 7.1 vs 2.7 mo (IRC)
🎯 ORR: 56% vs 14%
⚠️ G≥3 TEAEs: 74.2% vs 54.5%
💡 Major survival benefit, with increased toxicity.
@OncoAlert
1) Trial design schema: Phase 3 study design (NCT04210115) · 2) Biomarker data: EFS in participants with PD-L1 CPS ≥10 (room photo) · 3) Biomarker data: OS in participants with PD-L1 CPS ≥10 (room photo) · 4) Slide: EFS and OS in key subgroups in all participants (forest plots)
Biomarker data: EFS and OS in participants with PD-L1 CPS ≥1 tumors
KEYNOTE-975 phs-3 study: Pembrolizumab or placebo plus concurrent definitive chemoradiotherapy in E/GEJ cancer
#ESMO26 #ESMOAmbassadors
👉 mEFS: 15.2 vs 14.7 mo
👉 mOS: 32 vs 35 mo
🧐disappointing, no benefit in all & CPS>10 pts
@myESMO @ASCO https://t.co/Cj0MXoAWJB
1) Biomarker data: EFS in participants with PD-L1 CPS ≥10 · 2) Biomarker data: OS in participants with PD-L1 CPS ≥10 · 3) Biomarker data: EFS and OS in participants with PD-L1 CPS ≥1 · 4) Kaplan-Meier survival data: EFS and OS in all participants
#ESMO26 ❌ KEYNOTE-975 | Phase III
👥 700 pts | Unresectable EC/GEJ
💊 Pembro + dCRT vs placebo + dCRT
🔬 PD-L1 CPS≥10:
📉 EFS: 15.2 vs 14.7 mo (HR 0.97; p=0.399)
⏳ OS: 32.2 vs 35.0 mo (HR 1.00)
📊 Overall EFS: HR 0.94
🛑 Negative trial. No EFS benefit.
@OncoAlert https://t.co/ljl1meUeLI
Response data: EFS and OS in all Participants — pembrolizumab + dCRT vs placebo + dCRT
🚨 ESMO26 | KEYNOTE-975: Negative!
Adding pembrolizumab to definitive CRT in unresectable oesophageal cancer failed to improve EFS or demonstrate an OS benefit.
📊 EFS HR 0.97 (CPS ≥10)
📊 OS HR 0.99 (overall)
❌ No benefit, even in PD-L1–high tumors.
#ESMO26 #KEYNOTE975 https://t.co/NxtPcem5Pc
1) Trial design schema: study design: lenvatinib + pembrolizumab + TACE vs placebo + TACE · 2) Response data: objective response rate per RECIST v1.1 by BICR · 3) Kaplan-Meier survival data: PFS per RECIST v1.1 by BICR and overall survival curves · 4) Safety data: most common treatment-related adverse events (≥20%)
LEAP-012 study of lenvatinib + pembrolizumab vs plc with TACE for HCC: Long-term OS results
#ESMO26 #ESMOAmbassadors
👉ORR: 48 vs 33.7%
👉 mPFS: 14.6 vs 10.2 mo
👉 mOS: 40.4 vs 40.8 mo
🧐 Higher ORR & PFS did not translate into OS, a bit disappointing
@myESMO @ASCO https://t.co/aSrMfuKSHV
[Slide 1]
LEAP-012 Study Design (NCT04246177)
Key Eligibility Criteria
• Confirmed HCC not amenable to curative treatment
• ≥1 measurable HCC lesion per RECIST v1.1
• All lesions treatable with transarterial chemoembolization (TACE) in 1 or 2 sessions
• No portal vein thrombosis or extrahepatic disease
• Child-Pugh liver class A
• ECOG PS of 0 or 1
R 1:1
Lenvatinib 12 mg (BW ≥60 kg) or 8 mg (BW <60 kg) PO QD + Pembrolizumab 400 mg IV Q6W (up to 2 years) + TACE^b
Placebo PO QD + Placebo IV Q6W (up to 2 years) + TACE^b
Stratification Factors
• Study site
• Alpha fetoprotein (≤400 ng/mL vs >400 ng/mL)
• ECOG PS (0 vs 1)
• ALBI grade (1 vs 2 or 3)
• Tumor burden score^1,a (≤6 vs >6 but ≤12 vs >12)
End Points
• Primary: PFS^c and OS
– IA1 was the final analysis for PFS
– Initial alpha of 0.025 (1-sided) allocated to PFS; passed to OS if PFS is statistically significant
• Secondary: ORR,^c,d DOR,^c,d DCR,^c,d TTP,^c,d PFS,^d and safety
1. Wang Q et al. J Hepatol. 2019;70:893-903.
^aLargest tumor in centimeters + number of tumors. ^b2-4 weeks after the start of systemic therapy with a maximum of 2 treatments per tumor (4 total) and no more than 1 treatment per month.
^cPer RECIST v1.1 by BICR. ^dPer mRECIST by BICR.
[Slide 2]
Objective Response Rate per RECIST v1.1 by BICR
Δ14.9% (95% CI, 6.1-23.4)^a
P = 0.0005 (nominal)
48.1% (41.6-54.7) 33.7% (27.8-40.1)
CR / PR
Lenvatinib + pembrolizumab + TACE: PR 44.3%, CR 3.8%
Dual placebo + TACE: PR 28.8%, CR 4.9%
Objective Response Rate, %
| | Lenvatinib + pembrolizumab + TACE n = 237 | Dual placebo + TACE n = 243 |
Best overall response, % (95% CI)^b,c
Complete response | 3.8 (1.8-7.1) | 4.9 (2.6-8.5)
Partial response | 44.3 (37.9-50.9) | 28.8 (23.2-34.9)
Stable disease | 41.8 (35.4-48.3) | 47.3 (40.9-53.8)
Progressive disease | 6.3 (3.6-10.2) | 15.2 (11.0-20.4)
Duration of response, median (range), months | 14.3 (1.3+ to 58.0+) | 12.6 (2.0+ to 51.8+)
Disease control rate | 89.9 (85.3-93.4) | 81.1 (75.6-85.8)
^aEstimated from stratified analysis. ^bParticipants with insufficient data for assessment of response: 2.1% in the lenvatinib + pembrolizumab + TACE group and 1.6% in the dual placebo + TACE group.
^cParticipants without postbaseline assessments: 1.7% in the lenvatinib + pembrolizumab + TACE group and 2.1% in the dual placebo + TACE group. Data cutoff date for IA3: August 19, 2025.
[Slide 3]
Progression-Free Survival per RECIST v1.1 by BICR and Overall Survival^a
Progression-Free Survival, % / Months
Lenvatinib + pembrolizumab + TACE | Events, n (%) 154 (65.0) | Median (95% CI), months 14.6 (12.6-16.7)
Dual placebo + TACE | 162 (66.7) | 10.2 (8.1-12.3)
HR, 0.70 (95% CI, 0.56-0.89) nominal P = 0.0018
24 mo: 23.9% / 18.9%; 36 mo: 19.1% / 12.4%
Overall Survival, % / Months
Lenvatinib + pembrolizumab + TACE | 126 (53.2) | 40.4 (34.4-47.0)
Dual placebo + TACE | 127 (52.3) | 40.8 (35.2-45.8)
HR, 0.98 (95% CI, 0.76-1.26) P^b = 0.4442
24 mo: 74.4% / 67.5%; 36 mo: 55.3% / 55.4%
No. at risk
^aAt the data cutoff, 253 of 318 OS events required for the final analysis had occurred, corresponding to an OS data maturity of 80%. ^bOne-sided P from re-randomization test; threshold P = 0.0104.
Data cutoff date for IA3: August 19, 2025.
Survival table
Endpoint: OS (IA3)
Arm | N | Median | Median CI
Lenvatinib + pembrolizumab + TACE | 237 | 40.4 | 34.4-47.0
Dual placebo + TACE | 243 | 40.8 | 35.2-45.8
HR: 0.98
HR CI: 0.76-1.26
P: 0.4442 (one-sided, re-randomization test; threshold 0.0104)
24 mo: 74.4% vs 67.5%
36 mo: 55.3% vs 55.4%
[Slide 4]
Most Common Treatment-Related Adverse Events^a (≥20%)
Grade 1 or 2 / 3 or 4
Lenvatinib + pembrolizumab + TACE; Dual placebo + TACE
n (%) | Lenvatinib + pembrolizumab + TACE n = 237 | Dual placebo + TACE n = 241
Treatment-related AEs^a | 234 (98.7) | 204 (84.6)
Grade 3 or 4 | 167 (70.5) | 75 (31.1)
Serious AEs | 81 (34.2) | 31 (12.9)
Led to discontinuation of both drugs | 21 (8.9) | 4 (1.7)
Led to death (grade 5) | 4 (1.7)^b | 2 (0.8)^c
Incidence, %
Hypertension, Proteinuria, ALT increased, AST increased, Hypothyroidism, Platelet count decreased, Blood bilirubin increased, Decreased appetite, PPE, Diarrhea, Weight decreased, Fatigue, Dysphonia, Post embolization syndrome
^aRelated to pembrolizumab, lenvatinib, and/or TACE. ^b1 participant each died from hepatic failure, gastrointestinal hemorrhage, myositis, and immune-mediated hepatitis.
^c1 participant each died from brain stem hemorrhage, and multiple organ dysfunction syndrome. Data cutoff date for IA3: August 19, 2025.
1) Trial design schema: Discussant slide comparing PFS across TACE + immunotherapy phase · 2) Trial design schema: Discussant slide comparing OS across TACE + immunotherapy phase 3
My guess did not prove to be accurate… 😞
I did discuss LEAP-12 in @myESMO #ESMO24 and stated “OS seems promising”, BUT here we have the data from #ESMO26
😬Not much of an OS signal - like others (👏🏻@SaborowskiAnna)
[😉 I still feel PFS of value here]
#ESMOAmbassadors https://t.co/gVgOhtfFaV https://t.co/LtSoElu1gN
[Slide 2]
TACE + Immunotherapy in Phase 3 trials: PFS
PFS ENDPOINT WAS MET IN ALL PHASE 3 TRIALS
EMERALD-11
LEAP-0122
TALENTACE3
EMERALD-34
PFS (months)
EMERALD-1: 15.0 vs. 8.2 HR 0.77
LEAP-012: 14.6 vs. 10.2 HR 0.7
TALENTACE: 10.32 vs 6.37 HR 0.64
EMERALD-3: 13.0 vs 9.9, HR 0.7 / 12.9 vs 8.1, HR 0.71
Anna Saborowski
1. Sangro et al. Lancet 2025;405:216-32; 2. Josep Llovet, ESMO 2026, 1678RO; 3. Dong et al. Ann Oncol 2025;36(S1):S62;; 4. Abou-Alfa et al. J Clin Oncol 2026;44 (suppl 17):LBA4000.
[Slide 3]
TACE + Immunotherapy in Phase 3 trials: OS
OS ENDPOINT WAS NOT MET IN ALL PHASE 3 TRIALS
EMERALD-11
LEAP-0122
TALENTACE3
EMERALD-34
OS (months)
EMERALD-1: 29.9 vs. 33.6 vs. 33.3 HR 1.1
LEAP-012: 40.4 vs. 40.8 HR 0.98
TALENTACE: 34.53 vs 35.38 HR 0.96 (early data)
EMERALD-3: 39.5.0 vs 34.7, HR 0.84 / NC vs 32.9, HR 0.7 [illegible]
Anna Saborowski
1. Bruno Sangro, ESMO GI 2026; 2. Josep Llovet, ESMO 2026, 1678RO; 3. Dong et al. Ann Oncol 2025;36(S1):S62;; 4. Abou-Alfa et al. J Clin Oncol 2026;44 (suppl 17):LBA4000.
Conclusions
• LEAP-012 met its primary end point of PFS but did not show OS benefit at IA3
• A median OS of approximately 40 months sets a new benchmark for trial design in unresectable, nonmetastatic HCC
• The safety profile of lenvatinib plus pembrolizumab remains consistent with previous reports and earlier analysis of LEAP-012
[Slide 1]
How do we understand the differences in trial outcomes?
1. Patient selection – in Tridente, only patients with prior CR/PR were included
2. Regimen – could the addition of binimetinib push patients to respond?
But actually the clinically important survival interval is very similar between the two studies:
mPFS: 2.8 months in TRIDENTE, 2.9 months in BRICKET
Rona Yaeger, MD
[Slide 2]
Rechallenge Trials: TRIDENTE and BRICKET Design
TRIDENTE: study design
RAS wild-type/BRAF V600E-mutant mCRC -> EC-based therapy -> PD -> ≥1 of SoC -> PD -> ENCO + BINI + CET (N =21)
• Encorafenib 300 mg QD
• Binimetinib 45 mg BID
• Cetuximab initially 400 mg/m2 and subsequently 250 mg/m2 QW
Primary endpoint: ORR
• CR or PR by RECIST v1.1
• PD within 4 weeks after the last ENCO administration
≥ 4 months
Key eligibility criteria
• ≥ 20 years of age
• ECOG PS 0-1
• Refractory or intolerant to fluoropyrimidine-based chemotherapy including oxaliplatin or irinotecan
• Measurable disease per RECIST v1.1
BRICKET: study design
RAS wild-type/BRAF V600E-mutant mCRC -> EC-based therapy -> PD -> 1 of SoC (EC free) -> PD -> Molecular Eligibility Criteria -> ENCO + CET (N =16)
Molecular Eligibility Criteria
• BRAF-V600E mutant
• RAS wild-type
• MAP2K1 wild-type
• MET not amplified
• Encorafenib 300 mg QD
• Cetuximab initially 400 mg/m2 and subsequently 250 mg/m2 QW
Primary endpoint: ORR
• PR or SD by RECIST v1.1
• PFS ≥ 6 months
≥ 4 months
Key eligibility criteria
• ≥ 18 years of age
• ECOG PS 0-1
• Measurable disease per RECIST v1.1
Rona Yaeger, MD
BRICKET trial: no signs of activity for targeted therapy rechallenge in BRAF-mt mCRC. Post-BREAKWATER era opens new questions for innovative trials in this challenging setting 🧬
Proud to have contributed to the BRICKET experience, learning so much along the way!
#ESMO26 @myESMO https://t.co/rJJm5cnNEO
[Slide 2]
14:45 - 16:15 Rapid oral: Gastrointestinal tumours, lower digestive
CHAIRS: LISA SALVATORE, KAI-KEEN SHIU, RONA YAEGER
Results, Survival outcomes
Progression-free survival
n | Events | Median PFS (mos) | 95% CI
16 | 16 | 2.94 | 2.01 – 3.39
PFS probability ; Months 0-8
Number at risk (number censored): 16 (0) | 13 (0) | 3 (0) | 2 (0) | 0 (0)
Overall survival
n | Events | Median OS (mos) | 95% CI
16 | 11 | 9.11 | 4.01 – 13.0
OS probability ; Months 0-14
Number at risk (number censored): 16 (0) | 14 (0) | 12 (1) | 8 (2) | 6 (3) | 4 (3) | 3 (4) | 1 (4)
CI, confidence interval; mos, months; n, number; PFS, progression free survival; OS, overall survival
Marco Maria Germani, MD
[Speaker panel] Marco Maria Germani — Circulating tumor DNA (ctDNA)-guided re-treatment (re-tx) with encorafenib and cetuximab (EC) in patients (pts) with chemorefractory BRAFV600E mutated metastatic colorectal cancer (mCRC): The proof-of-concept single arm phase II BRICKET trial by GONO
ALICANTE AUDITORIUM - HALL 6
Survival table
Endpoint: PFS and OS (single arm)
Arm | N | Median | Median CI
Encorafenib + cetuximab re-treatment — PFS | 16 | 2.94 mo | 2.01 – 3.39
Encorafenib + cetuximab re-treatment — OS | 16 | 9.11 mo | 4.01 – 13.0
[Slide 3]
14:45 - 16:15 Rapid oral: Gastrointestinal tumours, lower digestive
CHAIRS: LISA SALVATORE, KAI-KEEN SHIU, RONA YAEGER
Results, objective response rate
ORR: 0/16 (0%) 95% CI: 0 – 20.6%
DCR: 6/16 (37.5%) 95% CI: 15.2 – 64.6%
Legend: Disease Progression; Stable Disease
Waterfall reference lines: +20%, -30%
Two patients were not radiologically assessed for objective response because clinically deteriorated and died before scheduled radiological assessment. Both patients were computed as non-responders. * PD due to non-target lesion progression ** PD due to occurrence of new lesions
CI, confidence interval; DCR, disease control rate; ORR, objective response rate; PD, disease progression
Marco Maria Germani, MD
[Speaker panel] Marco Maria Germani — Circulating tumor DNA (ctDNA)-guided re-treatment (re-tx) with encorafenib and cetuximab (EC) in patients (pts) with chemorefractory BRAFV600E mutated metastatic colorectal cancer (mCRC): The proof-of-concept single arm phase II BRICKET trial by GONO
ALICANTE AUDITORIUM - HALL 6
1) Kaplan-Meier survival data: PFS and OS Kaplan-Meier curves (Germani, ESMO 2026) · 2) Trial design schema: treatments and OS since liquid biopsy, eligible vs not eligible
BRICKET by GONO: encorafenib + cetuximab re-treatment in 16 ctDNA-selected BRAF V600E mCRC patients yielded median PFS 2.9 mths.
- 11/30 pts with resistance ctDNA mut
#ESMO26 #EMSOAmbassadors. A reminder that molecular selection alone may not be enough. https://t.co/pJAJkp9CAt
KRASi is moving into neoadjuvant treatment of pancreatic cancer and showed promising results in different combinations: #ESMO26 KRAS G12Di inhibitor HRS-4642 combined with chemo, IO, or anti-EGFR trials in China. More options for pancreatic patients are coming. https://t.co/hBF4KKqfBK
[Slide 1]
3157P - HRS-4642 with dual immunotherapy and chemotherapy for advanced pancreatic cancer: Preliminary results from Arm 1 of a phase II study
Wen-Quan Wang1,2,3, Lu Liu1,2,3, Wei Gan1,2,3, Chen-Chen Liu1,2,3, Lin-Hui Tang1,2,3, Yu Li1,2,3, Fei Liang2,4, Qiang Zhou1,2,3, Yao-Lin Xu1,2,3, Yue-Ming Zhang1,2,3, Ning Pu1,2,3, Hua-Xiang Xu1,2,3, Jun-Yi He1,2,3, Lei Zhang1,2,3, Chen-Ye Shi1,2,3, Wen-Chuan Wu1,2,3, Xu-An Wang1,2,3, Jian-Fei Wang5, Liang Liu1,2,3
1Department of Pancreatic Surgery, Zhongshan Hospital, Fudan University, Shanghai, China; 2Cancer Centre, Zhongshan Hospital, Fudan University; 3Department of General Surgery, Zhongshan Hospital, Fudan University; 4Department of Biostatistics, Zhongshan Hospital, Fudan University; 5Clinical Research & Development, Jiangsu Hengrui Pharmaceuticals Co., Ltd., Shanghai, China
Background
• KRAS G12D inhibitors have shown promising antitumor activity in pancreatic cancer. Studies suggest that combining KRAS inhibitors with immunotherapy may further improve outcomes.
• This study assesses the feasibility of combining HRS-4642 (a KRAS G12D inhibitor) and dual immunotherapy (anti-PD-L1 + anti-CTLA-4) with standard chemotherapy (gemcitabine plus nab-paclitaxel) in patients with pancreatic ductal adenocarcinoma (PDAC).
Methods
• This was an open-label, two-arm, phase 2 trial (NCT06938282).
• Arm 1: Unresectable, locally advanced or metastatic PDAC.
• Arm 2: Borderline-resectable PDAC (BRPC).
• Target enrollment: ~30 patients per arm.
Figure 1. Study design
Key Eligibility Criteria: • KRAS G12D mutation • Age ≥18 years • ECOG PS: 0-1 • No prior systemic therapy • Measurable disease (≥1 lesion) • Adequate organ function
HRS-4642 + Adebrelimab + SHR8068 (280 mg, priming dose) + GnP (Q3W) • Non-surgical: continuous treatment • Surgical: Neoadjuvant → Surgery → Adjuvant + Maintenance therapy
Treatment continued until disease progression, unacceptable toxicity
• Primary endpoints: safety and objective response rate (ORR) per RECIST v1.1 (Arm 1); 18-month OS rate (Arm 2)
• Secondary endpoints: overall survival (OS), progression-free survival (PFS), disease control rate (DCR), resection rate and safety with adverse events summarized using NCI-CTCAE v5.0
Results - Patients
• As of April 2026, a total of 12 pts with metastatic PDAC were enrolled in Arm 1 (Table 1).
Table 1. Baseline Characteristics | N = 12
Median age, y (range) | 53 (38 - 75)
Sex: Male 10 (83.3) | Female 2 (16.7)
ECOG PS: 0 7 (58.3) | 1 5 (41.7)
Tumor location: Head/neck 6 (50.0) | Others 6 (50.0)
Stage IV at enrollment | 12 (100.0)
Sites of lesion: Liver 11 (91.7) | Lung 1 (8.3) | Others 3 (25.0)
CA19-9: CA19-9>2×ULN 12 (100.0) | CA19-9>1000 U/ml 6 (50.0)
Efficacy
• Among 10 evaluable patients, the ORR was 80.0% (8 PR, 2 SD), meeting the BOP2 design's stage endpoint of ≥2 responses.
• Two PR patients with oligometastases underwent R0/R1 resection and had no recurrence on maintenance at data cutoff.
Figure 2. Waterfall plot for treatment response (SD SD PR PR PR PR PR PR PR PR)
Safety
• Any-grade treatment-related adverse events (TRAEs) occurred in 91.7% of patients, and grade ≥3 TRAEs in 50.0%.
• No fatal TRAEs were reported.
Figure 3. TRAEs occurring in >2 patients (Anemia, ALP increased, ALT increased, GGT increased, AST increased, Neutropenia, Hyperlipasemia, Lymphopenia, Amylase increased, Leukopenia, Hypertriglyceridemia, Hypercholesterolemia, Fever, Total bile acid increased, Thrombocytopenia, Rash, LDL increased)
Conclusions
• The combination of HRS-4642, dual immunotherapy, and chemotherapy showed a manageable safety profile and promising efficacy, with the potential to convert unresectable disease to a resectable form.
• Based on these results, Arm 2 (BRPC) has commenced enrollment.
Correspondence to: Liang Liu, liu.liang@zs-hospital.sh.cn
[Slide 2]
FPN:3161P
Neoadjuvant ivonescimab plus gemcitabine/nab-paclitaxel for borderline resectable pancreatic cancer: a prospective single-arm phase II trial
H.Li1,2, H.Yan1, R.Li2, X.Zhang2, J.Yao2, W.Li2, X.Mu2, S.Gao3, Y.Liu1,2, J.Hao3
1.Department of Hepatobiliary Cancer, Tianjin Medical University Cancer Institute & Hospital, Tianjin, China; 2.Department of Hepatobiliary and Pancreatic Oncology, Tianjin Cancer Hospital Airport Hospital, Tianjin, China; 3.Department of Pancreatic Cancer, Tianjin Medical University Cancer Institute & Hospital, Tianjin, China
Background
• Outcomes for borderline resectable pancreatic cancer (BRPC) remain suboptimal despite perioperative chemotherapy.
• Immune checkpoint inhibition alone has limited activity in pancreatic ductal adenocarcinoma, whereas dual PD-1 and VEGF blockade may remodel the tumor microenvironment, improve drug delivery and augment chemotherapy response.
• We evaluated neoadjuvant ivonescimab, a PD-1/VEGF bispecific antibody, plus gemcitabine/nab-paclitaxel (AG) in untreated BRPC.
Methods
This prospective, single-arm, single-center phase II trial (NCT06944106) enrolled patients with histologically confirmed, untreated BRPC and ECOG PS 0-1. Patients received ivonescimab 20 mg/kg Q3W plus gemcitabine 1000 mg/m2 and nab-paclitaxel 125 mg/m2 for 3 cycles; up to 6 cycles were permitted before radical surgery when feasible. The primary endpoint was R0/R1 resection rate. Secondary endpoints included ORR, DCR, pathological response, TRG, safety, EFS and OS.
Fig 1. Research Flow Chart: Safety Run-in Phase n=6 (ivonescimab + Gemcitabine/Nab-paclitaxel) → 28-day observation → Expansion Enrollment n=20 → Curative resection; Primary Endpoint R0 and R1 resection rate; Secondary Endpoints Safety, MPR, TRG, EFS, ORR, DCR, OS
Table 1. Patient Characteristics (n=26): Median age (range; years) 65 (38-75); Male 13 (50%); Female 13 (50%); ECOG PS 0 26 (100%), 1 0 (0%); Treatment Exposure (range) 3 (2-5); Head/Uncinate process 19 (73.1%); Body/tail 7 (26.9%)
Results
Patients: As of April 23, 2026, 26 patients had received treatment (median age 65 years (range, 38-75); 50.0% male; all ECOG PS 0). The median number of treatment cycles was 3 (range, 2-5).
Efficacy: Among 18 response-evaluable patients, 8 had PR and 10 had SD; ORR was 44.4% and DCR was 100%, with no radiographic progression in evaluable patients. Thirteen patients proceeded to radical surgery, and all achieved R0 resection (50.0% of treated patients; 72.2% of response-evaluable patients). Among 11 patients with available postoperative pathology, 4 (36.4%) had ≥ 50% tumor regression; no MPR was observed. TRG was 2 in 9 patients and 3 in 2 patients. EFS and OS were immature. Grade ≥ 3 treatment-related adverse events occurred in 7 patients (26.9%), mainly leukopenia (15.4%), hypertension (11.5%) and neutropenia (7.7%). No immune-related adverse events, serious adverse events or treatment-related deaths were reported.
Tab 2. Analysis of efficacy evaluation - Objective response indicators (n=18): CR 0 (0%); PR 8 (44.4%); SD 10 (55.6%); PD 0 (0%); ORR (CR+PR) 8 (44.4%); DCR (CR+PR+SD) 18 (100%)
Surgical related data: Proceeded to radical surgery, n 13; R0 resection rate 100% (13/13)
Pathological Outcomes (n=11): ≥50% tumor regression 4 (36.4%); MPR 0 (0%); TRG 2, n 9; TRG 3, n 2
Fig 2. Best change from baseline in target lesion size (%) n=18
Tab 3. TRAEs of Grade ≥3 n=26: Leukopenia G3 3, G4 1; Hypertension G3 3, G4 0; Neutropenia G3 1, G4 1; Overall grade ≥3 TRAE 7 (26.9%)
Conclusions
[N]eoadjuvant ivonescimab plus AG showed encouraging disease control, feasible conversion to R0 surgery and [ma]nageable toxicity in BRPC. Continued enrollment and follow-up are needed to confirm pathological and [sur]vival benefit in this ongoing neoadjuvant trial.
Corresponding Author: Huikai Li, Department of Hepatobiliary Cancer, Tianjin Medical University Cancer Institute & Hospital
Disclosure statement: All authors have no conflicts of interest to declare.
[Slide 3]
3150P - A Phase Ib/II Study of HRS-4642 plus Nimotuzumab in Patients with KRAS G12D-Mutant Advanced Pancreatic Ductal Adenocarcinoma
D. Cao1, J. Zhou1, Q. Leng1, H. Xu1, M. Ren1, J. Wang2
1Department of Abdominal Oncology, WestChina Hospital of Sichuan University - Cancer Center, Chengdu, China; 2Department of Clinical Research & Development, Jiangsu Hengrui Pharmaceuticals Co., Ltd., Shanghai, China
Conflict of interest: None
Background
• KRAS G12D mutations occur in ~40% of advanced pancreatic ductal adenocarcinoma (PDAC). Activation of EGFR upstream of KRAS has been identified as a dominant mechanism responsible for resistance to KRAS inhibition.
• Combining HRS-4642 (long-acting, non-covalent KRAS G12D inhibitor) with nimotuzumab (anti-EGFR mAb) may produce synergistic effects in advanced KRAS G12D-mutant PDAC patients (pts).
Methods
• This was a single-arm, open-label, phase Ib/II study (NCT06773130).
• Pts received HRS-4642 plus nimotuzumab in 28-day cycles until disease progression, unacceptable toxicity, or withdrawal of consent.
Figure 1. Study design
Key Inclusion Criteria • Age 18-75 years • Histology/cytologically confirmed pancreatic ductal adenocarcinoma • With a confirmed KRAS G12D mutation • Previously treated with ≥1 line of systemic therapy
Phase Ib (Safety Lead-in) N=6~12: Nimotuzumab, 400mg (iv), qw + HRS-4642 (iv), q2w 1200mg (RP2D) / 1000mg / 800mg (backup)
Phase II (Efficacy Exploration) Simon's II stage: Enroll 9 pts, ≥1 CR/PR → Continue enrollment to 20 pts; ≥4 CR/PR, declare effective
Subjects enrolled in the same dosage group during the Phase Ib could also be included in the sample size of Phase II.
• Primary endpoints: safety and the recommended phase 2 dose (RP2D) (Phase Ib); objective response rate (ORR) per RECIST v1.1 (Phase II)
• Secondary endpoints: safety (phase II only), overall survival (OS), ORR (phase Ib only), disease control rate (DCR), progression-free survival (PFS), and duration of response (DOR)
Results - Patients
• Up to April 24, 2026, a total of 20 pts were enrolled (Table 1).
Table 1. Baseline Characteristics (N=20): Median age (range), yr 61 (42-74); Male sex 17 (85.0); ECOG 0 7 (35.0), 1 13 (65.0); Disease stage IV 20 (100.0); No. of sites of metastatic disease 1 7 (35.0), 2 7 (35.0), ≥3 6 (30.0); Main pancreatic tumor location Head or neck 10 (50.0), Body or tail 10 (50.0); Previous lines of anticancer therapy 1 11 (55.0), ≥2 9 (45.0)
Efficacy
• At the data cutoff on April 24, 2026, 15 pts were evaluable: 7 PR and 8 SD (ORR 46.7%, DCR 100.0%), and all showed target lesion shrinkage from baseline. Median PFS has not been reached.
Figure 2. Waterfall plot for treatment response
Figure 3. Duration of treatment and response
Safety
• In the Phase Ib, HRS-4642 1200 mg q2w plus nimotuzumab 400 mg qw was established as the RP2D, with no DLT observed in 6 pts.
• Among the 20 patients, the incidence of TRAEs was 95.0%, with grade 3 TRAEs occurring in 20.0%; no grade ≥4 TRAEs occurred.
Table 2. TRAEs occurring in >2 patients (All grade | Grade 3): Hypercholesterolaemia 16 (80.0%) | 2 (10.0%); Lipase increased 10 (50.0%) | 1 (5.0%); Alanine aminotransferase increased 9 (45.0%) | 0 (0.0%); Blood triglycerides increased 9 (45.0%) | 0 (0.0%); Amylase increased 6 (30.0%) | 0 (0.0%); Aspartate aminotransferase increased 6 (30.0%) | 1 (5.0%); Anaemia 4 (20.0%) | 0 (0.0%); Hypoalbuminaemia 4 (20.0%) | 0 (0.0%); Pruritus 4 (20.0%) | 0 (0.0%); Neutrophil count decreased 3 (15.0%) | 0 (0.0%); Asthenia 3 (15.0%) | 0 (0.0%); Gamma-glutamyltransferase increased 2 (10.0%) | 0 (0.0%); White blood cell count decreased 2 (10.0%) | 0 (0.0%); Rash 2 (10.0%) | 0 (0.0%); Proteinuria 2 (10.0%) | 0 (0.0%)
Conclusions
• Combination of HRS-4642 and nimotuzumab showed encouraging efficacy with well-tolerated toxicities in pts with KRAS G12D-mutant advanced pretreated PDAC. Updated results will be presented.
[Slide 4]
3165P: Perioperative HRS-4642, Chemotherapy, and Adebrelimab in KRAS G12D-Mutant Pancreatic Cancer: Preliminary Phase 2 Results
Baiyong Shen1, C. Wen1, S. Zou1, F. Li1, Q. Zhan1, T. Wang2, N. Zhu3, L. Gan1, L. Jiang1, W. Chai3, J. Wang4
1Department of General Surgery, Ruijin Hospital - Shanghai Jiao Tong University School of Medicine, Shanghai, China; 2Department of Pathology, Ruijin Hospital; 3Department of Radiology, Ruijin Hospital; 4Clinical Research & Development, Jiangsu Hengrui Pharmaceuticals Co., Ltd., Shanghai, China
Background
• Surgical resection remains the only curative treatment option for pancreatic ductal adenocarcinoma (PDAC). Neoadjuvant and adjuvant therapy strategies are recommended for resectable (particularly those with high-risk factors) and borderline resectable patients (pts), with the aim of achieving R0 resection and improving survival outcomes.
• This study evaluates the safety and efficacy of combining HRS-4642 (a KRAS G12D inhibitor) and adebrelimab (an anti-PD-L1 antibody) with standard chemotherapy in pts with early-stage PDAC.
Methods
• This was an open-label, single-center, phase II trial (NCT07131514).
• A Bayesian Optimal Phase II (BOP2) design was used (H0: 20%; H1: 40%), providing 85.86% power under H1. A total of 15-30 pts were planned for enrollment.
Figure 1. Study design
Key Eligibility Criteria: •KRAS G12D mutation •High-risk/borderline resectable pancreatic cancer •No prior treatment •ECOG: 0-1
Neoadjuvant ~4 cycles: HRS-4642+Adebrelimab+AG, iv, q3w; HRS-4642: 500mg d1, 1200mg d8, Adebrelimab: 1200mg, d1; Nab-Paclitaxel: 125 mg/m2, d1, d8, Gemcitabine: 1000mg/m2, d1, d8
2-4 weeks, radically resectable → Resection → Within 12 weeks → Adjuvant ~4 cycles (same regimen as neoadjuvant)
• Primary endpoints: objective response rate (ORR) per RECIST v1.1 and safety
• Secondary endpoints: R0 resection rate, major pathological response (MPR) rate (CAP Score 0-1), overall survival
Results - Patients
• Between July 2025 and March 2026, a total of 30 pts with high-risk resectable and borderline resectable PDAC were enrolled.
Table 1. Baseline Characteristics (N = 30): Median age, y (range) 64 (39-75); Male 18 (60.0); Female 12 (40.0); ECOG PS 0: 0, 1: 30 (100.0); Tumor location Head 18 (60.0), Others 12 (40.0); Resectability status High-risk resectable 9 (30.0), Borderline resectable 21 (70.0); Clinical stage I / II / III 0 / 18 / 12; CA 19-9>2×ULN 23 (76.7); CA 19-9≤2×ULN 7 (23.3)
Efficacy
• Among 25 evaluable patients, the ORR was 88.0% (22 PR, 3 SD), tumor shrinkage was observed in all patients.
• 16 pts underwent surgery and had postoperative pathology available, with a 100% (16/16) R0 resection rate and an 18.8% (3/16) MPR rate.
Figure 2. Waterfall plot for treatment response
Safety
• Among all pts, treatment-related adverse events (TRAEs) occurred in 93.3%, and grade 3/4 TRAEs occurred in 46.7%.
• No treatment-related deaths were reported.
Figure 3. TRAEs occurring in >10% patients [labels illegible]
Conclusions
• For pts with resectable or borderline resectable PDAC, the triplet of HRS-4642, GnP, and adebrelimab was well tolerated. Encouraging neoadjuvant activity was observed, with high ORR and R0 resection rates, further supported by postoperative pathological findings.
1) Slide: Title slide: HRS-4642 plus chemotherapy with or without · 2) Slide: Rational combinations in PDAC: KRAS plus PRMT5 inhibition · 3) Trial design schema: MEK inhibitors in PDAC: atebimetinib plus · 4) Response data: KRAS inhibitors in PDAC: ERAS-0015 pan-RAS
Daraxonrasib is just the beginning of the new advances for pancreas cancer. New RAS, MEK and PRMT5 inhibitors are showing strong results. The future is bright for tx of panc ca. #ESMO26 #pancreascancer #aononcology #DrSamMikhail https://t.co/l4KJGVdEgn
[Slide 1]
MADRID 2026 ESMO congress
HRS-4642 Plus Chemotherapy ± Adebrelimab as Perioperative Therapy in KRAS G12D-Mutant Pancreatic Cancer: Preliminary Results of a Phase 2 Study
Baiyong Shen1,*, Chenlei Wen1, Siyi Zou1, Fanlu Li1, Qian Zhan1, Ting Wang2, Naiyi Zhu3, Lina Gan1, Lingxi Jiang1, Weimin Chai3, Jianfei Wang4
* Principal investigator
1. Department of General Surgery, Ruijin Hospital - Shanghai Jiao Tong University School of Medicine, Shanghai, China,
2. Department of Pathology, Ruijin Hospital - Shanghai Jiao Tong University School of Medicine, Shanghai, China,
3. Department of Radiology, Ruijin Hospital - Shanghai Jiao Tong University School of Medicine, Shanghai, China,
4. Clinical Research & Development, Jiangsu Hengrui Pharmaceuticals Co., Ltd., Shanghai, China
[Slide 2]
Rational combinations in PDAC
KRAS and PRMT5 inhibition as a potential strategy in PDAC
Vopimetostat inhibits PRMT5 only in MTAP-del cancer cells when MTA is bound
Tumor regression in Murine Models of PDAC with MTAP-Loss Treated with Vopimetostat and Daraxonrasib or Zoldonrasib
Vopimetostat + zoldonrasib in MTAPdel , KRAS G2D mut 2/3L PDAC
Best Change in Tumor Size from Baseline (%)
LoT
Line of Therapy
BOR, n: CR / PR / SD / PD
ORR, %
DCR, %
[illegible]
PD / SD / PR / CR / Ongoing Therapy
1-Spira et al, presented at 2026 ESMO Meeting, poster 3149P
[Slide 3]
MEK inhibitors in PDAC
Atebimetinib is a novel allosteric small molecule inhibitor of MEK1/2
Atebimetinib (320 mg QD) + mGnP
DCR: 82%
ORR: 36%
Phase 2a | Atebimetinib (320 mg QD) + mGnP OS, N=55
OS Probability
Months
17.3 mo
Participant Population: First-line (1L) metastatic Pancreatic Ductal Adenocarcinoma (PDAC)
MAPKeeper
First line (1L) PDAC
Metastatic setting
ECOG PS 0-1
N=255 Atebimetinib + mGnP
N=255 Gem/nab-Pac 1L SoC Chemotherapy
Primary Endpoints: OS
Secondary Endpoints: PFS, DCR, ORR, QoL
Chung et al, presented at 2026 ASCO Meeting
NCT07562152
Survival table
Endpoint: Overall survival, phase 2a single arm
Atebimetinib (320 mg QD) + mGnP | 55
[Slide 4]
KRAS inhibitors in PDAC
Other pan-RAS inhibitors in PDAC
ERAS-0015 is an investigational, oral, highly potent pan-RAS molecular glue designed to inhibit RAS signaling with a potential best-in-class profile. Erasca is evaluating ERAS-0015 in the AURORAS-1 Phase 1 trial in patients with RAS-mutant solid tumors.
Maximum percentage change from baseline
8 mg QD / 16 mg QD / 24 mg QD / 32 mg QD / 40 mg QD / Treatment Ongoing
ERAS-0015 2L+ KRAS G12X PDAC
8 mg QD N=9 | 16 mg QD N=8 | 24 mg QD [illegible] | 32 mg QD [illegible] | 40 mg QD N=2
uORR, n (%): 1 (11) | 0 | [illegible] | [illegible] | [illegible]
DCR, n (%): 4 (44) | 8 (100) | [illegible] | 7 (100) | 2 (100)
Of the patients treated at RDEs of 24 mg and 32 mg:
27% were 2L
73% were 3L+
AURORAS-1 Phase 1 trial in the U.S: 57% uORR in patients with 2L+ KRAS G12X PDAC receiving ERAS-0015 monotherapy at the recommended dose for expansion of 32 mg once daily.
1) Trial design schema: First-in-human study design of AZD7003 GPC3-targeted CAR-T · 2) Response data: AZD7003 CAR-T in HCC: waterfall plot and ORR/DCR by dose level · 3) Kaplan-Meier survival data: AZD7003 CAR-T in HCC: overall survival by dose · 4) Slide: AZD7003 CAR-T in HCC first-in-human study conclusions
Phase I study of C-CAR031, a GPC3-targeted TGFβRIIDN armored autologous CAR-T, in HCC: Updated results
#ESMO26 #ESMOAmbassadors
👉ORR: 40.4%, all PR, DCR 94%
👉mOS: 18 mo
🧐Impressive response, and interesting OS, needs confirmation in western populations
@myESMO @ASCO https://t.co/OWq9kGBvwL
Phase 1 data of C-CAR031, an autologous #GPC3-targeted armored #CAR-T with a dominant-negative TGF-β receptor II, in heavily pretreated advanced #HCC. Manageable safety profile and preliminary clinical efficacy.
#ESMO26
#ESMOAmbassadors @myESMO https://t.co/448U0zaKQQ
C-CAR031 (AZD7003): a dnTGFβRII armoured GPC3 CAR-T
GPC3 is an ideal HCC target
▪ Glypican-3 (GPC3) is highly expressed in the majority of HCC tumours and virtually absent in normal adult tissues1,2,3
HCC tumour
Adjacent normal liver
C-CAR031 (AZD7003) design
▪ C-CAR031 is now known as AZD7003
▪ Affinity-tuned anti-GPC3 scFv enhances safety4
▪ Co-expression of a dominant negative (dn) receptor protects from TGFβ-driven immunosuppression5,6
GPC3 CAR Second generation CAR with 4-1BB costimulatory domain
dnTGFβRII Binds TGFβ but cannot signal
Qi Zhang, M.D.
1. Moek KL et al, Am J Pathol. 2018 Sep;188(9):1973-1981; 2. Batra et al, Ca[illegible] Res. 2020 Mar;8(3):309-320; 3. Bergamaschi et al, AACR 2025, Abstract 379[illegible] Torchia ML et al, Cytotherapy. 2022 Jul;24(7):720-732; 5.Tauriello DVF et al, [illegible] 2022 Jan;22(1):25-44; 6. Zhang Q et al, Nature. 657, 495–504 (2026)
1) Trial design schema: phase II study design and methods (Calegari, ESMO 2026) · 2) Slide: primary endpoint: 6-month PFS rate bar chart and swimmer plot (Calegari, ESMO 2026) · 3) Kaplan-Meier survival data: PFS and OS Kaplan-Meier curves (Calegari, ESMO 2026) · 4) Response data: ORR/DCR waterfall and spider plots (Calegari, ESMO 2026)
Encorafenib plus cetuximab beyond progression in combination with FOLFIRI in BRAF V600E mCRC progressing on EC: Results from the ECLYPse phase II trial
#ESMO26 #ESMOAmbassadors
👉 mPFS: 7.1
👉 mOS: NR
👉ORR 15%
🧐Interesting signal to continue EC, more translational data would be great
@myESMO @ASCO
Slide: phase II conclusions slide (Calegari, ESMO 2026)
Pilot trial of ECLYPse Phase II of continuing encorafenib + cetuximab + FOLFIRI in 2nd line #BRAF MT #colorectal #cancer with benefit of continuation beyond PD. Primary endpoint = 6M PFS was met; too early for OS. @OncoAlert @oncodaily #ESMO26 #cancerresearch https://t.co/w5nI4Qowoh
Conclusions
ECLYPse met its primary endpoint, with a 6-month PFS rate of 67% (12/18 pts), a mPFS of 7.1 months, and no new safety signal.
Continuing EC beyond progression in combination with ChT appears to extend disease control in this poor-prognosis population.
This strategy (EC beyond progression in combination with ChT) should be furtherly assessed in the post-BREAKWATER era (2nd line setting).
Maria Alessandra Calegari
1) Trial design schema: KN035-CN-005 study design: envafolimab + GEMOX · 2) Kaplan-Meier survival data: KN035-CN-005 final overall survival · 3) Response data: KN035-CN-005 secondary endpoints: PFS, ORR, DoR · 4) Slide: KN035-CN-005 conclusions: envafolimab + GEMOX in first-line advanced
s.c envafolimab + GEMOX vs GEMOX alone as 1L treatment for BTC in Chinese patients: A randomized, ph III trial
#ESMO26 #ESMOAmbassadors
👉ORR: 27 vs 20%
👉 mPFS: 5.4 vs 4.5 mo
👉 mOS: 10.9 8.6 mo
🧐Confirms KN-966 & TOPAZ-1 in 🇨🇳pts
@myESMO @ASCO https://t.co/oEWrvNLUpm
[Slide 1]
KN035-CN-005 Study Design
A multi-center, open-label, randomized phase III trial
• Histologically or cytologically confirmed unresectable or metastatic biliary tract cancer (including GBC, iCCA and eCCA)
• Received no prior systemic therapy
• Patients who relapsed >6 months after completing one regimen of adjuvant or neoadjuvant chemotherapy were eligible
• ECOG performance status 0 or 1
(N=472)
R 1:1
Envafolimab + GEMOX
Envafolimab: 2.5 mg/kg subcutaneously QW (until treatment discontinuation)
GEMOX: Gemcitabine: 1,000 mg/m² on D1 and D8; Oxaliplatin: 85 mg/m² on D1, Q3W, up to 6 cycles
GEMOX
Gemcitabine: 1,000 mg/m² on D1 and D8; Oxaliplatin: 85 mg/m² on D1, Q3W, up to 6 cycles
Stratification factors:
• Primary tumor site (GBC, iCCA, eCCA)
• Disease stage (locally advanced vs metastatic)
• Prior treatment (adjuvant chemotherapy vs other)
• ECOG performance status (0 vs 1)
◆Primary endpoint: OS
◆Secondary endpoints:
PFS, ORR, DCR, DoR, and TTP (RECIST 1.1)
Safety and tolerability
Pharmacokinetics and immunogenicity of envafolimab
Data cutoff: September 10, 2024
Abbreviations: GBC, Gallbladder cancer; iCCA, intrahepatic cholangiocarcinoma; eCCA, extrahepatic cholangiocarcinoma; QW, once per week; D1, Day 1; D8, Day 8; OS, overall survival; PFS, progression-free survival; ORR, objective response rate; DCR, disease control rate; DoR, duration of response; TTP, time to progression
Presented by Prof. Shukui Qin
[Slide 2]
Primary Endpoint: Final Analysis of Overall Survival
• The Envafolimab combination regimen demonstrated a durable immune tail effect, with the 36-month OS rate nearly doubled compared to the control arm (12.5% vs 7.7%).
Envafolimab+GEMOX / GEMOX
12-month: 44.2% vs 29.9%
24-month: 19.9% vs 10.8%
36-month: 12.5% vs 7.7%
Enva+GEMOX (N=232) | GEMOX (N=230)
Median OS (95% CI), months: 10.9 (9.2-12.1) | 8.6 (7.6-9.4)
Hazard ratio (95% CI): 0.723 (0.585-0.880)
P-value: 0.0016
% of Subjects Overall Survival
Months
Subject at risk
Presented by Prof. Shukui Qin
Survival table
Endpoint: OS
Arm | N | Median | Median CI
Envafolimab+GEMOX | 232 | 10.9 | 9.2-12.1
GEMOX | 230 | 8.6 | 7.6-9.4
HR: 0.723
HR CI: 0.585-0.880
P: 0.0016
12-month: 44.2% vs 29.9%
24-month: 19.9% vs 10.8%
36-month: 12.5% vs 7.7%
[Slide 3]
Secondary Endpoint: PFS, ORR and DoR
PFS
Enva+GEMOX (N=232) | GEMOX (N=230)
Events, n (%): 203 (87.5%) | 151 (65.7%)
Median PFS (95% CI), months: 5.4 (4.2-5.6) | 4.5 (4.2-5.5)
HR (95% CI): 0.802 (0.638-1.007)
P-value: 0.058
Tumor Response: ORR
Enva+GEMOX (N=232) | GEMOX (N=230)
ORR, n (%): 64 (27.6%) | 48 (20.9%)
CR, n (%): 5 (2.2%) | 1 (0.4%)
PR, n (%): 59 (25.4%) | 47 (20.4%)
DCR, n (%): 166 (71.6%) | 165 (71.7%)
DoR (Responders Only)
Enva+GEMOX (n=64) | GEMOX (n=48)
Median DoR (95% CI), months: 5.5 (4.1-7.0) | 4.2 (3.1-6.7)
HR (95% CI): 0.587 (0.339-1.018)
DoR rate, %
≥6 months: 45.3% | 35.4%
≥12 months: 33.6% | 9.6%
≥24 months: 27.2% | 6.4%
4-month Landmark Analysis of PFS
Piecewise Cox proportional hazards model
Interval | HR (95% CI) | P-value
0-4 months | 0.988 (0.720, 1.356) | 0.9415
>4 months | 0.650 (0.472, 0.896) | 0.0085
4-month Landmark Analysis of PFS
Enva+GEMOX (N=136) | GEMOX (N=110)
Cumulative PFS, months: 6.9 | 5.7
Stratified cHR (95% CI): 0.642 (0.465-0.887)
Stratified P-value: 0.0068
After excluding early (≤4 months) progression or censoring, patients entering the maintenance phase showed greater benefit with Enva+GEMOX.
Presented by Prof. Shukui Qin
[Slide 4]
Conclusions
• KN035-CN-005 is the world's first initiated Phase III trial evaluating an immune checkpoint inhibitor combined with chemotherapy for the first-line treatment of advanced BTC.
• The addition of Envafolimab to GEMOX demonstrated a clinically meaningful and robust prolongation of Overall Survival compared to GEMOX alone.
• The combination did not exacerbate GEMOX-related adverse events, and no new safety signals were identified compared to the monotherapies.
• Envafolimab plus GEMOX provides a highly effective first-line treatment strategy, establishing a compelling new standard of care option for patients with advanced BTC.
Presented by Prof. Shukui Qin
1) Slide: Discussant slide comparing OPTIMUM · 2) Slide: Discussant slide: clinical impact of the OPTIMUM · 3) Slide: Discussant conclusion slide on subcutaneous ICI
@chiarabraconi putting into the context abstracts on #BTC at #ESMO26. #PARP inhibitors and #immunotherapy in the advanced stage.
#ESMOAmbassadors @myESMO https://t.co/nosa40eM7K
[Slide 1]
How do patients treated with Olaparib in the Optimum compare to the RW population of BTC on SoC?
mOS (22.8mo)
2yr OS from starting maintenance =17.7%
mPFS (10.6mo)
(4 cycles [1-31])
RR = Not Reported
[RWD in N=475 Completed maintenance D]
Camera, ESMO Open 2026
With CisGemDurva
Chemo (+/-ICI)
RR = 27%
mPFS (17mo)
mOS (29.5mo)
[OPTIMUM study Olaparib treated =FAS population]
2yr OS from starting maintenance =41%
With Olaparib (+/- Durva)
[Slide 2]
CLINICAL IMPACT of OPTIMUM trial
➢ Will this study change my clinical practice?
Olaparib is not approved in BTC
Lack of proper control arm
Immunotherapy maintenance is currently SoC
Unbalanced cHRD (higher in Olaparib arm)
Unbalanced ICI (higher in Olaparib arm)
Unknow distribution of MMRd tumours and their response to ICI
➢ What do we gain from this study with regards to Olaparib?
Olaparib is an effective treatment in cHRD-altered BTC
Do we need a new trial?
[Slide 4]
CONCLUSION
➢ Will this study change my clinical practice?
Extra Validation that Immunocheckpoint inhibitors should be added to chemotherapy in first line
GemOx can be considered as an alternative regimen if CisGem is contraindicated
➢ How can we inform the future?
s.c. ICI is an appealing option BUT
We may need
Data of Non-Inferiority with I.V. ICI
Data in Non-Chinese population
Has this become irrelevant?
Ivonescimab In first line
1) Trial design schema: OPTIMUM phase 2 study design: maintenance olaparib · 2) Kaplan-Meier survival data: OPTIMUM survival outcomes: PFS and OS with olaparib plus · 3) Response data: OPTIMUM tumor response waterfall plots by arm with DDR gene · 4) Slide: OPTIMUM conclusions: primary endpoint not met for olaparib with or without durvalumab
OPTIMUM: phase 2 study of maintenance olaparib +/-Durva in DDR gene-mutated aBTC
#ESMO26 #ESMOAmbassadors
👉ORR 44% response during induction CTx
👉ORR 39% vs 25%
👉 6mo PFS-rate : 62 vs 62%
👉 mOS: 16 vs 29 mo
🧐Neg study, but very promising signal, requires further investigations
@myESMO @ASCO
EMT2: perioperative omega-3 polyunsaturated eicosapentaenoic acid (EPA, 4 grams a day!) vs placebo in #colorectalcancer liver metastases undergoing resection (2-4 years of treatment): no change in PFS (primary endpoint) BUT there was improved OS by 30% (5 year OS 62% vs 45%)! Bleeding risk actually higher on placebo arm #ESMO26 @myESMO #crcsm
Slide: presentation: Introduction of ivonescimab and the HARMONi program
#ESMO26 Ivonescimab!!!
We should judge trials by the quality of their data and the benefit they bring to patients, not by their country of origin. Scientific scrutiny should follow the same standards for everyone; political biases must not delay patients’ access to effective treatments. Clearly, these studies were considered scientifically worthy of presidential presentation—just look at how many came from China!
Slide: Al-Batran discussant: CLDN18.2 timeline with callout 'From
#ESMO26 🧬 23 years from CLDN18.2 discovery to approval!
🔬 2001 → Discovery
💊 2024 → First approval
🚀 2026 → Phase III ADC breakthroughs
💬 “We owe it to our patients to move faster. Cancer is a race against time.”
👏 Powerful message from Salah-Eddin Al-Batran!
@OncoAlert
This progress has been a long scientific journey
CLDN18.2: From discovery to first approval: 23 years
2001 | Molecular and Cellular Biology | Tomoaki Niimi et al. | Identification of CLDN18.2 as a stomach-specific isoform
2008 | Clinical Cancer Research | Uğur Şahin, Özlem Türeci et al. | Identification of CLDN18.2 as pan-tumor therapeutic target
2016 | ASCO Annual Meeting | Salah-Eddin Al-Batran | FAST: First clinical proof of concept for targeting CLDN18.2 (IMAB362)
2023 | ASCO GI | Kohei Shitara | SPOTLIGHT: First positive phase III trial on this CLDN18.2 antibody (zolbetuximab)
2024 | First regulatory approval of a CLDN18.2-targeted therapy: zolbetuximab in Japan
2026 | ESMO Congress | Rui-Hua Xu and Kohei Shitara | CLARITY-Gastric 01 and G-HOPE-001: First Phase III results with the CLDN18.2-targeted ADCs (sonesitatug vedotin and Arcotatug tavatecan)
[Thumbnail figures: histology image; expression bar charts; FAST OS curve (mOS 8.4 vs. 13.2 mo, HR 0.51, P<0.001 - small, partially legible); SPOTLIGHT KM; CLARITY-Gastric01 and G-HOPE-001 KM curves - [illegible]]
Salah-Eddin Al-Batran
Slide: opening session slide: 'Major Studies to Watch'
#ESMO26 is here! Inspiring opening session presented by @FAndreMD, @myESMO President. Moments away from exciting new data, promising abstracts & practice-changing trials. A remarkable few days ahead for oncology!
@OncoAlert https://t.co/GVjNfDDZXr
MAJOR STUDIES TO WATCH
CANCER VACCINES
INTerpath-001
Can individualised mRNA neoantigens help prevent melanoma relapse?
KRAS DIRECTED
KRASCENDO-1
Will a head-to-head trial raise the standard for KRAS G12C NSCLC?
DRUG RESISTANCE
SAFFRON
Can EGFR/MET biomarker selection overcome acquired resistance?
BILIARY TRACT CANCER
HARMONi-GI1
Can a PD-1/VEGF bispecific improve first-line BTC care?
ANTIBODY–DRUG CONJUGATES
TroFuse-005
What role will novel ADCs have in recurrent endometrial cancer?
PERIOPERATIVE THERAPY
VOLGA
Can an ADC–immunotherapy strategy improve bladder cancer care?
GASTROESOPHAGEAL CANCER
CLARITY-Gastric 01
How far can CLDN18.2-directed treatment extend?
1) Slide: Targeting RAS in PDAC · 2) Slide: Why a G12D-selective inhibitor now? · 3) Slide: Discussant take-home messages · 4) Slide: Trial landscape for KRAS
@Mom_enji putting into the context abstracts on novel drugs for #KRAS G12D-mutant #PDAC from early to advanced stage at #ESMO26
#ESMOAmbassadors
@myESMO https://t.co/XnnYWTTau1
[Slide 1]
Targeting RAS in PDAC
KRAS has historically been considered undruggable, but now we have >90 RAS-directed agents in clinical development and 3 FDA-approved direct RAS inhibitors
RAS·GDP
OFF · inactive
GEF (e.g. SOS1)
GDP → GTP exchange · activation
RAS·GTP
ON · active
GAP (e.g. NF1)
GTP hydrolysis → GDP + Pi · inactivation
Simanshu DK et al. Cell. 2017; Punekar SR et al. Nat Rev Clin Oncol. 2022; Holderfield M, et al. Nature. 2024; rasinhibitors.com (accessed Oct 2026).
GDP, guanosine diphosphate; GTP, guanosine triphosphate; GEF, guanine nucleotide exchange factor (e.g. SOS1); GAP, GTPase-activating protein (e.g. NF1); Pi, inorganic phosphate; RAF–MEK-ERK and PI3K–AKT, downstream signaling pathways; PDAC: pancreatic ductal adenocarcinoma.
Monica Niger
[Slide 2]
Why a G12D-selective inhibitor, now?
Selectivity for G12D spares wild-type RAS
Wider therapeutic window less on-target toxicity
Potential for safer combinations in earlier lines
LBA85: HRS-4642 Plus Chemotherapy ± Adebrelimab as Perioperative Therapy in KRAS G12D-Mutant Pancreatic Cancer: Preliminary Results of a Phase 2 Study
Can a G12D inhibitor be safely integrated into perioperative treatment?
3137RO: Safety and Efficacy of INCB161734, a Novel Oral KRAS G12D Inhibitor, in Combination with Chemotherapy in Patients (pts) with Advanced/Metastatic Pancreatic Ductal Adenocarcinoma (PDAC)
Can we have a full-dose combination of chemotherapy and a G12D inhibitor?
KRAS, Kirsten rat sarcoma viral oncogene homologue; PDAC, pancreatic ductal adenocarcinoma; pts, patients; RAS, rat sarcoma.
Monica Niger
[Slide 3]
Take-home messages
LBA85: HRS-4642 + chemotherapy ± adebrelimab, resectable disease
Can a G12D inhibitor be safely integrated into perioperative treatment?
• First perioperative experience with a G12D-selective inhibitor ± checkpoint inhibitors in PDAC
• Promising activity and surgical safety
• Caveats: small single-arm studies, uncertainty of activity endpoints and their surrogacy, immature survival
• Next step: These data combined with the evidence in advanced disease support a randomized neoadjuvant trial
• Open question: any role of adebrelimab?
3137RO: INCB161734 + chemotherapy, advanced disease
Can we have a full-dose combination of chemotherapy and a G12D inhibitor?
• Feasibility + good delivery of INCB161734 with both backbones may be a plus compared to daraxonrasib.
• Promising activity and PFS at 6 months with both backbones
• Caveats: immature follow-up and survival data
• Chemotherapy RDI around 50%: dose, schedule and prophylaxis to optimize; the DAWN-303 Phase III randomized trial will directly compare safety and efficacy with chemotherapy alone
• Next step: strong rationale for the neoadjuvant space
PFS, progression-free survival; RDI, relative dose intensity.
Monica Niger
[Slide 4]
What is next for KRAS G12D-mutant PDAC across earlier settings?
Neoadjuvant / perioperative | Surgery | Adjuvant | Metastatic · first line
NCT07240766 Ph II · N = 40
BR, KRAS G12D
HRS-4642 + GnP + nimotuzumab, perioperative (single arm)
NCT07691593 ¶ Ph II · N = 60
Non-metastatic
HRS-4642 + NALIRIFOX ± adebrelimab, neoadjuvant
R0 / R1 resection
RASolute 304
NCT07252232
Ph III · N = 500
Resected after periop chemo; any RAS
Daraxonrasib vs observation
DAWN-303 NCT07522073 Ph III · N = 588
INCB161734 + investigator's chemo vs placebo + chemo
NCT07232875 Ph III · N = 588
HRS-4642 + GnP vs placebo + GnP
RASolute 305 NCT07621718 Ph III · N = 670
Zoldonrasib + mFOLFIRINOX or GnP vs placebo + chemo
NCT07409272 Ph III · N = 614
Setidegrasib + mFOLFIRINOX or NALIRIFOX vs placebo + chemo
NCT07656376 ¶ Ph II/III · N = 465
DN022150 + GnP vs placebo + GnP
RASolute 309 NCT07805954 Ph III · N = 400
Zoldonrasib + daraxonrasib vs GnP (chemo-free option)
RASolute 303 NCT07491445 Ph III · N = 900
Daraxonrasib ± GnP vs GnP · any RAS (chemo-free option)
VS-7375 Ph III · planned 2026
VS-7375 + anti-EGFR vs VS-7375 + GnP vs SoC chemotherapy (chemo-free option)
KRAS G12D-selective inhibitor / degrader
Pan-RAS(ON) inhibitor
¶ Not yet recruiting. BR = borderline resectable; GnP = gemcitabine + nab-paclitaxel; SoC: Standard of Care N = planned enrollment. Sources: ClinicalTrials.gov; Verastem press release, 14 Oct 2026. Accessed 24 Oct 2026.
Monica Niger
1) Slide: Discussant slide introducing abstracts 1678RO and 1680RO · 2) Slide: Discussant slide: conclusions presented and personal conclusions · 3) Response data: Discussant slide: C-CAR031 secondary endpoints
@SaborowskiAnna putting into the context abstracts on #HCC from intermediate to advanced stage, from #TACE+immunotherapy to #CAR-T at #ESMO26 #ESMOAmbassadors @myESMO https://t.co/kEcIrTPJnr
[Slide 1]
Discussion
1678RO & 1680RO
From combining therapies…
…to engineering immunity.
Phase 3 LEAP-012 Study of Lenvatinib Plus Pembrolizumab Versus Dual Placebo With Transarterial Chemoembolization for Unresectable Nonmetastatic Hepatocellular Carcinoma: Long-Term Overall Survival Results
Josep M. Llovet1; Richard S. Finn2; Zhenggang Ren3; Yabing Guo4; Guohong Han5; Hailan Lin6; Sadahisa Ogasawara7; Ji Hoon Kim8; Haitao Zhao9; Chuan Li10; David C. Madoff11; R. Mark Ghobrial12; Anthony B. El-Khoueiry13; Arndt Vogel14; Xiang Peng15; Kalgi Mody16; Leonid Dubrovsky15; David Adelberg15,*; Masatoshi Kudo17
1680RO
Phase I study of C-CAR031 (AZD7003), a GPC3-targeted TGFβRIIDN armoured autologous CAR-T, in advanced hepatocellular carcinoma: Updated results
Qi Zhang1,2, Qihan Fu1,2, Wanyue Cao1,2, Jiaqi Huang3, Andy Zou4, Yihong Yao5, Yixin Hao4, Qijie Jian4, Jack Ashton6, Joana Hauser7, Xiao Qu8, Serena De Vita9, Tingbo Liang1,2
Anna Saborowski
[Slide 2]
Conclusions presented
Conclusions
• LEAP-012 met its primary end point of PFS but did not show OS benefit at IA3
• A median OS of approximately 40 months sets a new benchmark for trial design in unresectable, nonmetastatic HCC
• The safety profile of lenvatinib plus pembrolizumab remains consistent with previous reports and earlier analysis of LEAP-012
Personal conclusions
LEAP-012 was an important trial and adds relevant information regarding combination therapies in TACE-able HCC
Lenvatinib plus pembrolizumab and TACE
- will not become standard of care in intermediate HCC
- high ORR observed across all combination trials may facilitate conversion to curative treatment in selected patients, but needs to be shown prospectively
• increased toxicity must be carefully weighed against potential benefits on an individual patient level
• great to see that mOS of 40 months is feasible in early/intermediate HCC, depending on baseline characteristics
Anna Saborowski
[Slide 3]
Secondary Endpoints
Impressive ORR: 44.4% and DCR >90
…but DOR disappoints: 4.4 mo (CI: 2.9-7.4)
Qi Zhang, 1680RO, ESMO 2026
High ORR does not translate into extended DOR
„Horizon of expectations“ for alternative approaches:
Agent / trial | Strategy / treatment | Population / sample size | ORR | Median DOR
IL-15-armoured CAR-T1 | GPC3-targeted CAR-T cells | n=12 | 33% | Not provided
BGB-B20332 | GPC3 × 4-1BB bispecific antibody | n=94 overall ORR | 22-36% | 6 mo DOR (N=27): 79.2
MRG006A3 | GPC3-targeted ADC | n=12 High-GPC3 subgroup | 33.3% | 4.2 months
TKIs/ICI in further line Phase 3
RESORCE4 | Regorafenib vs placebo | 2L after sorafenib n=379 vs 194 | 6.6% vs 2.6% | 5.9 vs 5.6 months
CELESTIAL5 | Cabozantinib vs placebo | 2L or 3L after sorafenib n=470 vs 237 | 4.0% vs 0.4% | Not reported
IMbrave2516 | Atezolizumab + TKI vs TKI alone | 2L after atezo + bev n=279 vs 278 | 7.5% vs 5.8% | 10.2 vs 6.9 months
Anna Saborowski
1: Steffin et al., Nature, Vol 637, 2025; 2: Hong Jae Chon @ ESMO2026; 3: Hong Zhao, J Clin Oncol 44, 3028 (ASCO 2026); 4: Bruix et al, Lancet. 2017;389(10064):56–66; 5: Abou-Alfa et al, N Engl J Med. 2018;379(1):54–63.; 6: Vogel et al, J Clin Oncol. 2026;44(16_suppl):4002.
Trial design schema: Al-Batran discussant (LBA7): OS
🔬 23 years from discovery to approval!
2001: CLDN18.2 identified 2024: First targeted therapy approved 2026: Phase III ADC breakthroughs at #ESMO26!
🚀 A remarkable scientific journey transforming #GastricCancer care.
@OncoAlert @myESMO https://t.co/gX6qII7ahw
Overall Survival in Third-Line and Later Setting
Median overall survival (months) | Control arm | Experimental arm
Apatinib 2016 | 4.7 | 6.5
ATTRACTION-2 2017 | 4.1 | 5.3
JAVELIN Gastric 300 2018 | 5.0 | 4.6
TAGS 2018 | 3.6 | 5.7
INTEGRATE IIa 2024 | 4.0 | 4.5
CLARITY-Gastric01 2026 | 5.0 | 10.0
CLARITY-Gastric01 is a real step forward for our patients
Randomized Trials ordered by year of primary report
Li J, et al. J Clin Oncol, 2016; Kang YK, et al. Lancet, 2017; Bang YJ, et al. Ann Oncol, 2018; Shitara K, et al. Lancet Oncol, 2018; Pavlakis N, et al. J Clin Oncol, 2025; Xu RH, et al. ESMO Congress, 2026; LBA7
Salah-Eddin Al-Batran
Other GI slides
88 slide posts · 40 physiciansNot tied to a single tracked trial
NICHE-2. Keeping it short because the plot speaks for itself.
1. Rename it Chalabi's disease
2. Stop operating on patients first
For those who don't know: 111 patients with locally advanced dMMR colon cancer got one dose of ipi and two of nivo, then surgery. Zero events. A flat line.
Next up? Avoid the surgery altogether.
#ESMO2026
@Onco_Nexus
@OncoAlert @TheGutOncLab
Proportion of patients (%) ; Months 0-108
Single curve flat at 100% with censoring marks from ~40 to ~103 months
Number at risk (censored)
0: 111 (0) | 12: 111 (0) | 24: 111 (0) | 36: 111 (0) | 48: 96 (16) | 60: 51 (60) | 72: 29 (82) | 84: 16 (95) | 96: 4 (107) | 108: 0 (111)
Survival table
Endpoint: Not printed on image (caption describes zero events; endpoint label absent)
Neoadjuvant ipilimumab + nivolumab (single arm) | 111
Samuel Hume@DrSamuelBHume
Biomarker data: 1975P poster: HCB301-101 phase 1 of tri-functional SIRPα/PD-L1/TGF-β biologic in advanced
My vote for maddest new drug at ESMO: a tri-functional immune-activating fusion protein.
SIRPα inhibition — activates macrophages.
PD-L1 inhibition — reactivates T cells.
TGF-β inhibition — deplete fibrotic barrier surrounding tumors, for better T cell infiltration. https://t.co/sNKPDdTulF
1975P
HCB301-101: Early Safety and Disease Control From a Phase 1 Study of a Tri-Functional SIRPα/PD-L1/TGF-β Biologic in Advanced Solid Tumors
Ji Zhu, William Jeffrey Edenfield, Xigang Hu, Li Sun, Shuaishuai Zhang, Langtian Abigail Yu, Wei Ji, Chih-Yi Hsieh, Alvin Luk
1 Zhejiang Cancer Hospital; 2 Greenville Hospital System University Medical Center; 3 Zhujiang Hospital of Southern Medical University; 4 Xuzhou Central Hospital; 5 HanchorBio Inc.; 6 Hanchor Biopharma Inc.
BACKGROUND
The Challenge: Interdependent Immune Suppression in IO-Refractory Tumors
Innate Checkpoint SIRPα-CD47: Inhibits macrophage phagocytosis; Reduce antigen presentation
Adaptive Checkpoint PD-1/PD-L1: Induces T-cell exhaustion; Impairs effector function
Stromal Exclusion TGF-β: Restricts T cell infiltration; Dampens macrophage and T cell activation
Multicompartment Immune Resistance Requires Coordinated Checkpoint Blockade
HCB301: A tri-specific SIRPα-PD-L1-TGF-β fusion protein designed for integrated innate, adaptive, and stromal immune modulation
METHODS
Phase 1 Dose-Escalation Study of HCB301 (NCT06487624)
Open-label, multi-regional first-in-human study with BOIN-guided dose escalation
BOIN Design: Target toxicity rate ϕ=0.25
Dose levels: 0.3, 0.6, 0.9, 1.2, 2.4, 4.8, 9.6, 15 mg/kg (0.3 mg/kg lead-in)
All cohorts utilized 0.3 mg/kg step-up dosing prior to target dose administration.
* Protocol amended to include an intermediate 0.9 mg/kg cohort.
Treatment: Cycle 0 Day1: Step-up Dosing (0.3 mg/kg). Cycle 1 Day1 (7 days later): Target Dose weekly
Population: Advanced solid tumors; Relapsed/refractory classical Hodgkin lymphoma (cHL)
Primary Objectives: Evaluate safety & tolerability; Determine the MTD and RP2D
Secondary/Exploratory Objectives: Preliminary antitumor activity (ORR, DCR, DOR, PFS, OS); Pharmacokinetics following single and repeat dosing; CD47 Receptor Occupancy (RO); Immunogenicity (ADA); Pharmacodynamic and predictive biomarkers
RESULTS (as of July 2026)
Baseline
• 29 patients enrolled: 0.3 mg/kg: N=5; 0.6 mg/kg: N=13; 1.2 mg/kg: N=6; 0.9 mg/kg: N=5
• Median Age: 57.5 years
• Median prior lines of systemic therapy: 4
Antitumor Activity (n= 21 efficacy evaluable)
• Stable disease: 8/21 (38.1%)
• Disease stabilization across multiple solid tumor types, including:
> 0.6 mg/kg: HCC, CRC, hypopharyngeal carcinoma
> 0.9 mg/kg: Cholangiocarcinoma, CRC
> 1.2 mg/kg: CRC, pelvic malignancy, sarcoma.
• Longest SD duration: Approximately 4 months.
Figure 1. Patients Achieving Stable Disease by HCB301 Dose Level: 0.6 mg/kg 3; 0.9 mg/kg 2; 1.2 mg/kg 3
Safety
• Grade 1-2 TEAEs: 86.0%; TRAEs Grade 1-2: 85.6%
• Two DLTs: Grade 4 thrombocytopenia (1.2 mg/kg)
• Thrombocytopenia: 25 patients; 85 events
• Anemia: 17 patients; 30 events
• Lymphopenia: 11 patients; 41 events
• Infusion-related reactions: 14 patients; 33 events
Note: Cytopenias were predominantly low-grade. No cumulative anemia signal was observed. Platelet declines were often rapid and transient, warranting close monitoring. Safety findings informed enhanced monitoring, step-up dosing, and evaluation at intermediate doses.
Table 1. Treatment-Emergent Adverse Events of Interest (n=29)
AE Term | Incidence n (%) | Grade 1-2 events n (%) | Total events (n)
Thrombocytopenia | 17 (58.6%) | 41 (62.1%) | 66
Anemia | 13 (44.8%) | 32 (91.4%) | 35
Lymphopenia | 8 (27.6%) | 20 (66.7%) | 30
Infusion Related Reaction | 8 (27.6%) | 23 (95.8%) | 24
CONCLUSION
• Early feasibility was demonstrated for HCB301, a tri-specific SIRPα–PD-L1–TGFβ immunotherapy targeting innate, adaptive, and stromal immune suppression.
• Preliminary disease control was observed in heavily pretreated patients (8/21; 38.1%).
• Predominantly low-grade cytopenias, with Grade 4 thrombocytopenia emerging as the key dose-limiting toxicity.
• Further safety evaluation and dose optimization are needed to define the therapeutic window and guide future development.
Study Sponsor: HanchorBio
Samuel Hume@DrSamuelBHume
Biomarker data: AMPLIFY-7P camupepimut pre-specified DFS by ctDNA status (O'Reilly)
Some tentative good news today for a vaccine in pancreas cancer.
- 7-valent mutant KRAS vaccine (G12D, G12R, G12V, G12A, G12C, G12S and G13D) given after surgery and completion of chemotherapy (with or without radiotherapy) in patients with stage I-III KRAS-mutant pancreas cancer.
- This did not prevent recurrence in the overall population.
- But, when split into pre-specified groups: ctDNA+ vs. ctDNA-, or presence/absence of prior radiation, there was significant (and substantial) protection.
- It's unclear how this KRAS vaccine will interact with KRAS inhibitors in the future.
The vaccine is made by Elicio Therapeutics, the data were presented by Eileen O'Reilly at ESMO - it's now moving to phase 3.
[Slide 1]
Diagnosis & ABC staging | 1 Surgery or chemo first? | 2 Which regimen? | 3 Restaging: resect?
Patient 1: Who benefits from neoadjuvant therapy?
UNPUBLISHED
Pooled PREOPANC trials, NCCN-resectable PDAC
A | OS for NAT versus US
NAT vs US: HR, 0.66 (0.53 to 0.83)
Time after randomization (months)
No. at risk (cumulative no. censored)
410 (0) 292 (0) 190 (1) 109 (32) 51 (73) 12 (104)
107 (0) 65 (0) 37 (0) 20 (0) 12 (0) 7 (3)
B | Difference in 3-year OS
P interaction = 0.024
NAT superior / US superior
64 to 80 years
Age at randomization (years)
Benefit of neoadjuvant therapy grows with age
Significant from 64 to 80 years
Interaction P = 0.024
Patient 1, 70 years: within the range of benefit
MY VIEW
For patient 1: neoadjuvant chemotherapy
NAT, neoadjuvant therapy; US, upfront surgery.
NCCN resectable, n = 517: neoadjuvant arms combined (410) vs upfront surgery (107, PREOPANC), partly non-randomised, PREOPANC-2 had no upfront-surgery arm.
Verkolf EMM et al., under review
Survival table
Endpoint: OS, neoadjuvant therapy (NAT) vs upfront surgery (US), pooled PREOPANC trials, NCCN-resectable PDAC
NAT (neoadjuvant arms combined) | 410
Upfront surgery | 107
HR: 0.66
HR CI: 0.53 to 0.83
[Slide 2]
Diagnosis & ABC staging | 1 Surgery or chemo first? | 2 Which regimen? | 3 Restaging: resect?
Patient 3: Resection or ablative radiation?
Ablative radiotherapy vs patient 3's predicted survival
| MSKCC ablative RT (n = 119, from start of RT) | Patient 3: surgery (TAPS model, from restaging)
Median OS | 18 mo | 23 mo
2-year OS | 38% | 49%
3-year OS | NR | 33%
MY VIEW: For patient 3: resection or ablative radiotherapy
PREOPANC-4, phase III RCT, started September 2026
Locally advanced PDAC, favourable response
≥ 3 months induction chemotherapy, no RECIST progression, ECOG 0–1
R
Surgical exploration - intent to resect
MR-guided SABR - 5 × 10 Gy
Primary endpoint: overall survival, n = 230
NR, not reported. Reyngold M et al. JAMA Oncol 2021;7:735-8 (MSKCC; 75 Gy/25 fx or 67.5 Gy/15 fx); PREOPANC-4: Dutch Pancreatic Cancer Group
[Slide 3]
4 How to drain? | 5 Resect: worth the risk? | 6 Surgery, systemic first or locoregional?
Patient 4, GBC: How to drain hilar obstruction?
TESLA: randomised phase III trial, 5 Dutch centres, n = 148
P: Unresectable hilar obstruction
I: Primary percutaneous stenting
C: Endoscopic biliary drainage
O: Major complication within 90 days, death included
| Percutaneous stenting | Endoscopic drainage | P
Major complication | 40% | 66% | P=0.002
Cholangitis | 3% | 32% | P<0.001
Reintervention | 14% | 49% | P<0.001
Papilla not crossed, no external drain
UNPUBLISHED - For patient 4: primary percutaneous stenting, then systemic therapy
GUIDELINE - ESGE 2026: endoscopic drainage preferred
51% perihilar CCA, 29% iCCA, 8% gallbladder cancer, 21% ≥ 80 years. Intention to treat. NCT06671418
UEG Week 2026, LB03. Pilot: Franssen S et al. JHEP Rep 2025;7:101541
[Slide 4]
4 How to drain? | 5 Resect: worth the risk? | 6 Surgery, systemic first or locoregional?
Locoregional treatments for BTC
Systemic therapy
GUIDELINE
Systemic backbone
Gem-cis + durva or pembro
15%
3-year overall survival
TOPAZ-1 HR 0.74, 3-y 14.6% vs 6.9%
KEYNOTE-966 HR 0.83, 3-y 13%
Additional locoregional treatments
Small lesion: MWA - 1%
Small lesion in hilum: SBRT - 10%
Large solitary lesion: SIRT - 20%
Multifocal disease: HAIP chemo - 70%
MY VIEW - Share of patients with each tumour pattern
HAIP chemo for liver-confined iCCA: 3-year OS 28%, 5-year OS 15% in 4 phase II trials
Liver transplantation
Perihilar CCA
< 5% eligible
5-year OS 51%
Depending on national protocol
Intrahepatic CCA
< 5% eligible
5-year OS 57%
Only in trials: TRIATHLON RCT
MY VIEW - For patient 6: systemic therapy, consider locoregional treatment
Figure: Méndez Romero A, J Hepatol 2026; Oh DY, J Hepatol 2025; Kelley RK, Lancet 2023; pump: Rousian M, Alessandris R, J Hepatol 2026
Transplant: Mayo protocol, intention to treat, n = 211 (Tan EK, J Gastrointest Surg 2020); Methodist-MD Anderson, n = 18 (McMillan RR, Am J Transplant 2022)
Arndt Vogel@ArndtVogel
1) Slide: BGB-B2033 (GPC3 x 4-1BB bispecific) background and mechanism (Chon, ESMO 2026) · 2) Trial design schema: BGB-B2033 phase 1/2 study design (NCT06427941) in advanced HCC · 3) Response data: BGB-B2033 waterfall plots by dose cohort with confirmed ORR (Chon, ESMO 2026) · 4) Safety data: BGB-B2033 safety: TEAEs/TRAEs by dose and TRAEs in >5% (Chon, ESMO 2026)
Phase I study of BGB-B2033 (GPC3 x 4-1BB bispecific AB): Dose optimization and escalation update in advanced HCC
#ESMO26 #ESMOAmbassadors
👉ORR: 30%
👉manageable safety
🧐very promising agent, looking forward to see combination with ICI
@myESMO @ASCO https://t.co/BfjGLR3JMM
3530O - Neoadjuvant short-course radiotherapy followed by camrelizumab and chemotherapy in locally advanced rectal cancer (LARC): The phase 3 UNION trial
Speakers Zhen Yu Lin (Wuhan, China)
Lecture Time 11:10 - 11:20
Abstract
Background
Despite the use of neoadjuvant chemoradiotherapy, recurrence and distant metastasis remain common in LARC. Effective immunotherapy-based strategies for the predominantly proficient mismatch repair/microsatellite-stable population remain limited. UNION is the first phase 3 trial to evaluate a neoadjuvant strategy incorporating radiotherapy, immunotherapy, and chemotherapy in LARC. Here we present the prespecified event-free survival (EFS) analysis.
Methods
Patients with cT3-4 or N+ rectal adenocarcinoma (tumor located ≤10 cm from the anal verge) were randomly assigned (1:1) to receive short-course radiotherapy (SCRT; 25 Gy/5f; experimental group) or long-course chemoradiotherapy (50.4 Gy/28f with concurrent capecitabine 825 mg/m2 twice daily; standard of care group) followed by 2 neoadjuvant cycles and 6 adjuvant cycles of capecitabine and oxaliplatin (CAPOX). The experimental group additionally received neoadjuvant and adjuvant camrelizumab (200 mg, day 1) since CAPOX treatment for up to 17 cycles. The primary endpoint was blinded independent review committee (BIRC)-assessed pathological complete response rate. Key secondary endpoints with prespecified α allocation were investigator-assessed EFS and overall survival.
Results
Between July 2021 and March 2023, 231 patients were randomized to the experimental group (n=113) and standard of care group (n=118). As of October 1, 2025, the median follow-up duration was 36.8 months (95% CI, 34.8-37.8) and 35.6 months (95% CI, 34.3-36.9), respectively. The 3-year EFS rate was significantly higher in the experimental group compared with standard of care (91.3% [95% CI, 83.9-95.4] vs 77.4% [95% CI, 67.9-84.4], hazard ratio=0.33 [95% CI, 0.15-0.71], P=0.0029). BIRC-assessed EFS consistently favored the experimental group. During the whole treatment period, the incidence of grade ≥3 treatment-related adverse events was 51.3% (59/115) and 48.2% (54/112), respectively.
Conclusions
UNION is the first phase 3 trial to demonstrate a significant improvement in EFS with an immunotherapy-based regimen in LARC. This neoadjuvant strategy represents a new standard of care.
Marc Hilmi@MarcHilmi
1) Slide: Photo of presenter in front of poster · 2) Slide: Photo of presenters in front of poster
Grateful to present 3 posters at #ESMO2026 in Madrid! 🇪🇸
1. Pathogenic germline ATM alterations define a distinct pancreatic cancer subtype with improved survival, less liver metastases and reduced KRAS signaling. @CentralParkWMD @EileenMOReilly @ciacobu @CpcrMsk
2. POSTN+ fibroblasts identify an aggressive tumor microenvironment and poorer survival in pancreatic cancer (#PRODIGE24). @RemyNicolle @cros_jerome
3. Early CT-derived body composition changes predict survival in biliary tract cancer patients receiving immunotherapy, independently of radiological progression, CA19-9, ECOG PS, and weight loss (#PRODIGE57). @DelayeMatthieu
Grateful to all collaborators at @MSKCancerCenter, @institut_curie, and GERCOR/PRODIGE!
#PancreaticCancer #GIOncology
#ESMO26 Building upon options for our patients with #ColorectalCancer.
Our CLOVER☘️Trial
CCR5-targeting
Leronlimab with
Oral chemotherapy &
VEGF-inhibitor
Enriched
Regimen
#ctDNA reductions compared to real world+dose response
@OncoAlert @cityofhope
@benweinbergmd today! https://t.co/gzRHI0kLnB
Figure 2: Change in ctDNA (%) from baseline to Week 2 for each of the 28 patients with evaluable data
Median decrease: -86%
Values: -100% | -99% | -99% | -97% | -97% | -96% | -94% | -93% | -92% | -90% | -90% | -89% | -88% | -87% | -85% | -82% | -79% | -78% | -74% | -73% | -72% | -70% | -69% | -64% | -54% | -39% | -34% | -26%
LRM 350 mg | LRM 700 mg
Anti-CCR5 (Leronlimab)
Figure 3: change in ctDNA levels (measured in MTM/mL) from baseline to Week 4 observed in CLOVER study compared to control data from real world database*
TAS-102 (n = 30) vs TAS-102 + Bev (n = 75): p = 0.01 (as bracketed)
TAS-102 + Bev (n = 75) vs TAS-102 + Bev + LRM (n = 12): p = 0.0005
* Y-axis is truncated at 269.5% (tallest whisker); 11 points from TAS-102+BEV group above above the Y-axis limit not shown.
CLOVER Trial
Nicholas Hornstein@GIMedOnc
Kaplan-Meier survival data: UNION EFS per BIRC and OS (3-year OS 96.3% vs 89.8%, HR 0.35), presenter
UNION: PIII neoadjuvant rectal cancer 🇨🇳, presented at #ESMO26.
Basically PD1 + TNT vs TNT.
Positive on pCR and EFS. Does it change things? Very strong OS signal.
Design • Locally advanced rectal cancer, 231 randomized • Short-course RT → camrelizumab + CAPOX vs long-course chemoRT → CAPOX, then TME
Efficacy pCR (BIRC, primary) 39.8% vs 15.3%, OR 3.65, p<0.0001 3-yr EFS 91.3% vs 77.4%, HR 0.33 (investigator) 3-yr OS 96.3% vs 89.8%, HR 0.35 (95% CI 0.11–1.10). Descriptive only, 15 deaths total.
Toxicity Grade ≥3 TRAEs 51.3% vs 48.2%, mostly heme
Is the backbone appropriate? Two things changed at once: the radiation schedule and the PD-1. The control arm is long-course CRT with CAPEOX, not the TNT most of us give today, and a 15% pCR is a low bar to clear.
Everyone went to TME, so the question US practice actually cares about, organ preservation, wasn't asked.
Still, an EFS HR of 0.33 at 3 years is considerable. I expect this’ll be standard in the future.
One thing I know, this study is done, and we're still only "planning" these PD1 studies in the US. Have to move faster.
@OncoAlert @TheGutOncLab @Onco_Nexus
EFS PER BIRC ASSESSMENT AND OS
◆ Per BIRC assessment, the 3-year EFS rate was 87.2% (95% CI 78.2-92.7) in the experimental group versus 73.7% (95% CI 63.6-81.4) in the standard-of-care group (HR 0.41 [95% CI 0.21-0.81]). Concordance between the BIRC and investigator assessments strengthens the robustness of the findings.
◆ OS was reported descriptively without formal hypothesis testing, as the data maturity was expected to be ≤10% at this stage. The 3-year OS rate was 96.3% (95% CI 90.4–98.6) in the experimental group versus 89.8% (95% CI 81.7–94.4) in the standard-of-care group (HR 0.35 [95% CI 0.11–1.10]).
Secondary endpoint: BIRC-assessed EFS
Number of events/patients | 3-year rate (95% CI)
Experimental group 12/113 | 87.2% (78.2–92.7)
Standard of care group 28/118 | 73.7% (63.6–81.4)
Stratified HR 0.41 (95% CI 0.21–0.81)
Number at risk (Number censored)
Experimental group 113 (0) 108 (4) 104 (7) 96 (11) 95 (12) 92 (14) 88 (16) 88 (16) 82 (20) 75 (27) 64 (38) 54 (48) 35 (66) 21 (80) 13 (88) 6 (95) 2 (99) 0 (101)
Standard of care group 118 (0) 112 (6) 99 (12) 96 (14) 89 (17) 83 (18) 77 (19) 75 (20) 73 (21) 68 (26) 57 (36) 47 (45) 33 (59) 23 (69) 13 (77) 5 (85) 1 (89) 0 (90)
Key secondary endpoint: OS
Number of events/patients | 3-year rate (95% CI)
Experimental group 4/113 | 96.3% (90.4–98.6)
Standard of care group 11/118 | 89.8% (81.7–94.4)
Stratified HR 0.35 (95% CI 0.11–1.10)
Number at risk (Number censored)
Experimental group 113 (0) 111 (1) 111 (1) 110 (1) 110 (1) 110 (1) 110 (1) 110 (1) 110 (1) 109 (1) 98 (12) 83 (26) 58 (51) 37 (72) 20 (89) 9 (100) 1 (108) 0 (109)
Standard of care group 118 (0) 116 (2) 115 (2) 115 (2) 114 (3) 113 (4) 111 (4) 108 (6) 106 (7) 105 (8) 98 (14) 73 (35) 51 (57) 31 (77) 17 (90) 6 (101) 2 (1)[sic] 0 (107)
BIRC, blinded independent review committee; EFS, event-free survival; OS, overall survival; CI, confidence interval; HR, hazard ratio.
Presenter: Zhenyu Lin
Survival table
Endpoint: BIRC-assessed EFS and OS (descriptive)
Experimental group | 113
Standard of care group | 118
HR: EFS (BIRC) 0.41; OS 0.35
HR CI: EFS 0.21–0.81; OS 0.11–1.10
Landmark rates:
3 years EFS (BIRC): Experimental group 87.2% (CI 78.2–92.7) | Standard of care group 73.7% (CI 63.6–81.4)
3 years OS: Experimental group 96.3% (CI 90.4–98.6) | Standard of care group 89.8% (CI 81.7–94.4)
Enrique Grande@drenriquegrande
1) Trial design schema: retroSAUNA study design & population: concomitant SSA in 2L GEP-NET · 2) Slide: DAREON-7: antitumor activity by DLL3 subgroup (stage-wide photo, Jaume Capdevila)
👏👏 Amazing rapid orals session in #Neuroendocrinetumirs at #ESMO26!!!!
Congratulations to the presenters and the discussants!! New Pb-based Radioligands and DLL3 driven drugs are promising new strategies in the field.
@Ja_Capdevila @OncoThor @GrupoGetne @myESMO @OncoAlert @Netespana
Rising physician-scientist star in germline/cancer research @DanaFarber @mustafajsalehmd presents exciting findings at #ESMO26 identifying a germline IL7 variant linked to thyroid and joint immune-related toxicities across cancer types.
@myESMO @OncoAlert @DanaFarber_GU @SashaGusevPosts
1998P : Germline IL7 variant confers organ-specific susceptibility to thyroid and joint immune-related adverse events independent of cancer type and treatment regimen
Mustafa Saleh, Amin Nassar, Zeyun Lu, Elias Bou Farhat, Sarah Abou Alaiwi, Marc Machaalani, Michel AlChoueiri, Alexander Gusev, Toni K. Choueiri
Results
1. Interaction testing across irAE categories and terms revealed a significant interaction with irAE term at G1+ (p=0.030), identifying thyroid autoimmunity and inflammatory arthritis as the phenotypes driving the IL7 association.
2. Fine-Gray analyses confirmed robustness with thyroid disorder sHR 2.51, p=0.013, arthralgia/arthritis sHR 3.02, p=0.005). Stepwise phenotype selection identified pancreatitis as an additional component of the IL7-associated cluster, jointly reaching p=9.12×10[illegible] (N=142 events).
3. No interaction with age, sex, tumor mutational burden (TMB), ICI regimen, or cancer type was significant, placing this germline effect outside conventional clinical risk factors.
4. IL7 risk allele did not associate with maximum irAE grade, establishing a grade-agnostic immune toxicity. In pts with high TMB, association was markedly amplified: thyroid disorder and arthralgia/arthritis HR 5.13, p=5.82×10[illegible], with pancreatitis added HR 5.66, p=8.05×10[illegible].
Methods
[illegible]aracterized the IL7 germline association across 1,619 ICI-treated patients [illegible] DFCI receiving anti-PD(L)1 monotherapy (N=1,360), anti-CTLA4 (N=15), [illegible]ation ICI (N=244) spanning 16 cancer types.
@Mustafajsalehmd @DrChoueiri @SashaGusevPosts
Email: Mustafa_jamalsaleh@dfci.harvard.edu
Yakup Ergün@dr_yakupergun
Slide: Roodhart: Established ADCs in GI cancers - HER2 is so far the only validated ADC target
#ESMO26
ADCs in GI Cancers
From Dr. Jeanine Roodhart presentation👇 https://t.co/X9f65vKlbA
Established ADCs in GI cancers
HER2 is so far the only validated ADC target in GI oncology
Agent | Target / payload | Setting | Trial | Key outcome | Ref
Trastuzumab deruxtecan | HER2 / DXd | HER2+ gastric/GEJ, ≥3L | DESTINY-Gastric01 (rand. ph 2) | ORR 51% vs 14%; mOS 12.5 vs 8.4 mo | [8]
Trastuzumab deruxtecan | HER2 / DXd | HER2+ gastric/GEJ, 2L | DESTINY-Gastric04 (ph 3) | mOS 14.7 vs 11.4 mo (HR 0.70); ILD 14% | [9,24]
Disitamab vedotin | HER2 / MMAE | HER2 IHC 2+/3+ gastric, ≥3L (China, 2021) | RC48-C008 (ph 2) | ORR 24.8%; mPFS 4.1 mo; mOS 7.9 mo | [10,24]
Trastuzumab deruxtecan | HER2 / DXd | HER2+ biliary tract | HERB (ph 2) | ORR 36.4% | [11]
Trastuzumab deruxtecan | HER2 / DXd | HER2 IHC 3+ solid tumours (tumour-agnostic) | PanTumor02, Lung01, CRC02 (n = 192) | ORR 46.9–52.9%; FDA approval | [12,24]
Trastuzumab deruxtecan | HER2 / DXd | HER2+ mCRC, ≥3L | DESTINY-CRC02 (rand. ph 2) | ORR 37.8% (5.4 mg/kg); mPFS 5.8 mo | [15,23]
[8] Shitara K, et al. N Engl J Med 2020;382:2419–30. [9] Shitara K, et al. N Engl J Med 2025;393:336–48. [10] Peng Z, et al. Cancer Commun 2021;41:1173–82. [11] Ohba A, et al. J Clin Oncol 2024 (HERB; PMID 39102634). [12] Meric-Bernstam F, et al. J Clin Oncol 2024;42:47–58. [15] Raghav K, et al. Lancet Oncol 2024;25:1147–62. [23] Bartolini M, et al. ESMO Open 2026;11:108304. [24] Khan U, Shah MA. Cancer 2026;e70419
J.M.L. Roodhart
Nieves Martinez Lago MD PhD@DraMartinezLago
1) Trial design schema: IKF-AIO RAMIRIS Phase III: Study design (Magdalena Scheck) · 2) Response data: RAMIRIS: Co-primary endpoints OS and ORR (ITT population) · 3) Kaplan-Meier survival data: RAMIRIS: Progression-free survival · 4) Safety data: RAMIRIS: Safety - TRAEs in ≥10% of patients
#ESMO26 💊 RAMIRIS | Phase II/III
👥 317 taxane-pretreated GEA
🔀 FOLFIRI+Ram vs Pac+Ram
❌ Co-primary endpoints not met
⏳ OS: 8.7 vs 7.5 mo (HR 0.95)
🎯 ORR: 25.3% vs 22.6%
✅ PFS: 5.5 vs 3.7 mo (HR 0.70; p=.003)
⚠️ G≥3 AEs: 70% vs 68%
💡 PFS benefit without OS improvement
@OncoAlert
[Slide 1]
16:15 - 17:45 Rapid oral 1: Gastrointestinal tumour, upper digestive
CHAIRS: MARIA IGNEZ BRAGHIROLI, FENG WANG, LUCJAN WYRWICZ
IKF-AIO RAMIRIS Phase III
Study design
Key eligibility criteria
- Advanced/ metastatic esophagogastric adenocarcinoma
- Progression during/ after first-line platinum + fluoropyrimidine therapy
- Prior taxane treatment
R 1:1
Stratification:
- Progression ≤3 vs >3 months after end of first-line therapy
- ECOG performance status 0 vs. 1
Arm A: Ramucirumab 8 mg/ kg i.v., d1+15, q28 + FOLFIRI* i.v., d1+15, q28
Arm B: Ramucirumab 8 mg/kg i.v., d1+15, q28 + Paclitaxel 80 mg/m² i.v., d1, 8, 15, q28
Study endpoints
Co-primary: Overall survival (OS); Objective overall response rate (ORR)
Secondary: Progression-free survival (PFS); Disease control rate (DCR); Safety; Quality of life
Study assumptions
OS: Aim: 6.0 -> 8.6 months; target HR = 0.70; one-sided α = 0.020; 80% power; n= 318 required
ORR: Aim: 10% -> 25%; one-sided α = 0.005; 80% power, n = 298 required
-> Final sample size: n = 318
Study cohort
n = 319 randomized
n = 317 in ITT population (2 patients excluded)
n = 304 in PP population
Randomized multicenter phase III trial in 47 sites in Germany, Austria and Italy from Oct 2019 until Oct 2024
* FOLFIRI: irinotecan 180 mg/m²; 5-FU bolus 400 mg/m²; leucovorin 400 mg/m²; 5-FU 2400 mg/m² over 46 h
Magdalena Scheck
Magdalena Scheck
FOLFIRI plus ramucirumab versus paclitaxel plus ramucirumab as second-line therapy for taxane-pretreated patients with advanced or metastatic gastroesophageal adenocarcinoma-Final results of the phase III IKFs602/AIO RAMIRIS Study
ALMERIA AUDITORIUM - HALL 9
[Slide 2]
16:15 - 17:45 Rapid oral 1: Gastrointestinal tumour, upper digestive
CHAIRS: MARIA IGNEZ BRAGHIROLI, FENG WANG, LUCJAN WYRWICZ
Co-Primary endpoints OS and ORR (ITT population)
[KM curve: Survival Probability vs Survival time (months)]
| Arm A Ram + FOLFIRI n = 158 | Arm B Ram + Pacli n = 159
Median OS (95% CI) | 8.7 [7.6, 10.6] | 7.5 [6.2, 9.3]
HR (95.8% CI) P-value | 0.95 [0.74, 1.22] 0.33
Events n (%) | 139 (88%) | 137 (86%)
Median follow-up (mo) | 8.2 | 6.6
No. at risk
Arm A: 158 101 46 30 12 7 5 3 2 1 1
Arm B: 159 91 45 26 16 8 4 3 2 1 0
| Arm A Ram + FOLFIRI n = 158 | Arm B Ram + Pacli n = 159 | P-value
ORR | 40 (25%) | 36 (23%) | 0.29
CR | 4 (3%) | 0 (0%)
PR | 36 (23%) | 36 (23%)
SD | 61 (39%) | 61 (38%)
PD | 33 (21%) | 46 (29%)
Missing | 24 (15%) | 16 (10%)
OS: HR from unstratified Cox proportional hazards model; p-value from unstratified log-rank test (one-sided). + Censored. The results for OSS and OR for ITT population are consistent with those for PP population.
Magdalena Scheck
Magdalena Scheck
FOLFIRI plus ramucirumab versus paclitaxel plus ramucirumab as second-line therapy for taxane-pretreated patients with advanced or metastatic gastroesophageal adenocarcinoma-Final results of the phase III IKFs602/AIO RAMIRIS Study
ALMERIA AUDITORIUM - HALL 9
Survival table
Endpoint: OS (co-primary), ITT
Arm | N | Median | Median CI
Arm A Ram + FOLFIRI | 158 | 8.7 | 7.6, 10.6
Arm B Ram + Pacli | 159 | 7.5 | 6.2, 9.3
HR: 0.95
HR CI: 95.8% CI 0.74, 1.22
P: 0.33 (one-sided log-rank)
[Slide 3]
16:15 - 17:45 Rapid oral 1: Gastrointestinal tumour, upper digestive
CHAIRS: MARIA IGNEZ BRAGHIROLI, FENG WANG, LUCJAN WYRWICZ
Progression-free survival
ITT Population
| Arm A Ram + FOLFIRI n = 158 | Arm B Ram + Pacli n = 159
Median PFS (95% CI) | 5.5 [4.0, 6.3] | 3.7 [2.9, 4.2]
HR (95.8% CI) P-value | 0.71 [0.56, 0.90] 0.002
Events n (%) | 142 (90%) | 149 (94%)
No. at risk (partly illegible): Arm A 158 63 20 5 4 1 1 1 0; Arm B 159 43 7 3 1 0
PP Population
| Arm A Ram + FOLFIRI n = 150 | Arm B Ram + Pacli n = 154
Median PFS (95% CI) | 5.6 [4.1, 6.4] | 3.7 [2.9, 4.3]
HR (95.8% CI) P-value | 0.69 [0.55, 0.88] 0.001
Events n (%) | 138 (92%) | 148 (96%)
No. at risk (partly illegible): Arm A 150 63 20 5 4 1 1 1 0; Arm B 154 43 7 3 1 0
Ram plus FOLFIRI resulted in a numerical improvement in PFS vs. SOC
HR from unstratified Cox proportional hazards model; p-value from unstratified log-rank test (one-sided). + Censored. SOC standard of care
Magdalena Scheck
Magdalena Scheck
FOLFIRI plus ramucirumab versus paclitaxel plus ramucirumab as second-line therapy for taxane-pretreated patients with advanced or metastatic gastroesophageal adenocarcinoma-Final results of the phase III IKFs602/AIO RAMIRIS Study
ALMERIA AUDITORIUM - HALL 9
Survival table
Endpoint: PFS (secondary), ITT and PP
Arm | N | Median | Median CI
ITT Arm A Ram + FOLFIRI | 158 | 5.5 | 4.0, 6.3
ITT Arm B Ram + Pacli | 159 | 3.7 | 2.9, 4.2
PP Arm A Ram + FOLFIRI | 150 | 5.6 | 4.1, 6.4
PP Arm B Ram + Pacli | 154 | 3.7 | 2.9, 4.3
HR: ITT 0.71; PP 0.69
HR CI: 95.8% CI ITT 0.56, 0.90; PP 0.55, 0.88
P: ITT 0.002; PP 0.001 (one-sided)
[Slide 4]
16:15 - 17:45 Rapid oral 1: Gastrointestinal tumour, upper digestive
CHAIRS: MARIA IGNEZ BRAGHIROLI, FENG WANG, LUCJAN WYRWICZ
Safety
TRAEs occurring in ≥10% of patients in either arm
Ram + FOLFIRI (Grade ≥3 | Grade ≤2) vs Ram + Paclitaxel (Grade ≤2 | Grade ≥3), incidence in %
Fatigue: 4 | 34 vs 21 | 3
Nausea: 4 | 31 vs 15 | 1
Diarrhea: 3 | 31 vs 11 | 1
Neutrophil count decreased: 15 | 9 vs 7 | 12
Mucositis: 3 | 19 vs 5
Vomiting: 2 | 15 vs 5
Hypertension: 9 | 4 vs 6 | 7
Platelet count decreased: 2 | 11 vs 2 | 1
Anorexia: 11 vs 4 | 1
Peripheral sensory neuropathy: 1 | 8 vs 20 | 1
Proteinuria: 6 vs 12 | 1
Legend: TRAE Grade ≤ 2; TRAE Grade ≥3
Safety population consists of all randomized patients who received at least one dose of study medication.
Magdalena Scheck
Magdalena Scheck
FOLFIRI plus ramucirumab versus paclitaxel plus ramucirumab as second-line therapy for taxane-pretreated patients with advanced or metastatic gastroesophageal adenocarcinoma-Final results of the phase III IKFs602/AIO RAMIRIS Study
ALMERIA AUDITORIUM - HALL 9
[Slide 1]
4303 P
Cell-free chromatin epigenomic profiling enables non-invasive subtyping of pancreatic cancer
Marc Eid*, Karl Semaan*, Damien Vasseur, Gunsagar Gulati, Ji-Heui Seo, Alexander Jordan, Leigh Culnane, Antoine Hollebecque, Antoine Italiano, Toni Choueiri, Kimberly Perez, Jonathan Nowak, Andrew Aguirre#, Brian Wolpin#, Sylvan Baca#, Matthew Freedman#, Harshabad Singh#
*co-first authors #co-senior authors
Background
• Classical (C) and basal [obscured] subtypes are key prognostic biomarkers of pancrea[obscured] (PDAC) and may predict response to treatmen[obscured]
• Current subtyping m[obscured]
• Here, we report a n[obscured] PDAC subtyping based on profiling circulati[obscured]
Methods
• PDAC PDX model sub[obscured] bulk RNA-seq and the PurIST algorithm.
• ChIP-seq for the pos[obscured] H3K27ac and H3K4me3, MeDIP-se[obscured] PDAC PDX.
[remaining methods obscured by presenter]
Widespread epigenomic differences between classical and basal-like PDAC
A PDX (epi-)genomic datasets: RNA-seq (N=28), ATAC (N=27), H3K27ac (N=28), H3K4me3 (N=27), MeDIP (N=28); Subtype: Basal-like, Classical; Source: DFCI, MDACC
B [genome tracks: CLDN18, GATA6, HNF1A, KRT6A, PTGES, GNAI2]
C [volcano plots: H3K27ac, H3K4me3, ATAC-seq, MeDIP-seq; up in basal-like / up in classical]
Validation of the epigenomic signature in an independent PDAC PDX cohort
A [heatmaps H3K27ac, ATAC, H3K4me3; PDAC subtype Basal-like / Classical]
B C:B ratio, Classical vs Basal-like: H3K27ac p= 0.0036; H3K4me3 p= 0.0036; MeDIP-seq p= 0.039
PIES enables accurate subtyping of PDAC from patient plasma
A 1 mL of plasma; Cohorts: DFCI (N=26); Clinical trials: NCT03520790 (N=29), MOSCATO-02 (N=27)
B ctDNA fraction, Classical vs Basal-like, p= 0.32
C AUPRC Classical vs. basal-like: All samples (AUPRC = 0.88); ≥3% ctDNA (AUPRC = 0.91); <3% ctDNA (AUPRC = 0.86)
Patients with low PIES (basal-like) have worse outcomes
A Progression-free survival multivariable Cox model (Adjusted Hazard Ratio, log scale)
PIES: Low vs High 2.99 (1.30-6.90); p=0.01
ctDNA (%) 7.68 (0.73-81.00); p=0.09
Liver met: Yes vs. No 1.54 (0.69-3.42); p=0.29
ECOG: 1-2 vs. 0 1.49 (0.75-2.97); p=0.26
CA 19-9 (U/mL) 1.00 (1.00-1.00); p=0.44
Arm: GnP vs FFX 0.57 (0.26-1.28); p=0.17
B Circulating epigenome – All patients: High PIES vs Low PIES; Log-rank p= 0.046
Number at risk: High PIES 34 24 18 10 5 2; Low PIES 16 10 5 1 1 0
C Circulating epigenome – FFX arm: High PIES vs Low PIES; Log-rank p= 0.00014
Number at risk: High PIES 13 12 8 3 1 0; Low PIES 4 1 0 0 0 0
D Low PIES per circulating epigenome: FFX vs GnP; Log-rank p= 0.0097
Number at risk: FFX 4 1 0 0 0; GnP 12 9 5 1 1
Conclusion
• In a multi-institutional cohort, PIES distinguished C and B PDAC subtypes with an AUPRC of 0.88 across all plasma samples, irrespective of ctDNA fraction, increasing to 0.91 in samples with ≥3% ctDNA.
• PIES provides a non-invasive approach for determining PDAC transcriptional subtypes, with the potential to facilitate broader implementation of molecular subtyping and inform treatment selection.
@marc_eid @KarlSemaan @SylvanBacaLab
Presented at ESMO 2026 | Madrid, Spain
[Slide 2]
4303 P
Cell-free chromatin epigenomic profiling enables non-invasive subtyping of pancreatic cancer
Marc Eid*, Karl Semaan*, Damien Vasseur, Gunsagar Gulati, Ji-Heui Seo, Alexander Jordan, Leigh Culnane, Antoine Hollebecque, Antoine Italiano, Toni Choueiri, Kimberly Perez, Jonathan Nowak, Andrew Aguirre#, Brian Wolpin#, Sylvan Baca#, Matthew Freedman#, Harshabad Singh#
Background
• Classical (C) and basal (B) transcriptional subtypes are key prognostic biomarkers of pancreatic ductal adenocarcinoma (PDAC) and may predict response to treatment1-3.
• Current subtyping methods rely on tissue biopsies.
• Here, we report a novel non-invasive approach for PDAC subtyping based on profiling circulating tumor chromatin.
Methods
• PDAC PDX model su[obscured] identified using bulk RNA-seq and the PurIST algorithm.
• ChIP-seq for the post-translational modifications H3K27ac and H3K4me3, MeDIP-seq, and ATAC-seq, were performed on PDAC PDX.
• Differentially marked regions between C and B subtypes were identified using DESeq2 and were validated in an independent cohort of PDAC PDX models4.
• cfChIP-seq for H3K27ac and H3K4me3, cfMeDIP-seq, and low-pass whole-genome sequencing (LPWGS) were performed on 1 mL of plasma from patients with metastatic pancreatic cancer.
• ctDNA fraction was estimated from LPWGS data using ichorCNA.
• A C/B score was derived for each epigenetic feature in individual patients' plasma samples by calculating the ratio of aggregate signal at classical:basal regions.
• For each plasma sample, we combined the different epigenetic features to develop the Pancreatic Integrated Epigenomic Score (PIES).
• Performance was evaluated using area under the precision-recall curve (AUPRC).
• Progression-free survival (PFS) was compared between patients with Low and High PIES using multivariable Cox regression adjusted for ctDNA fraction, liver metastasis, ECOG, CA19-9, and treatment regimen.
References
1. Singh H, et al. Clin Cancer Res. 2024;30:4932–4942.
2. Wenric S, et al. JCO Precis Oncol. 2025;9.
3. Dilly J, et al. Cancer Discov. 2024;14:2135–2161.
4. Lomberk G, et al. Nat Commun. 2018;9:1978.
Dana-Farber Cancer Institute | Harvard Medical School | Gustave Roussy | MD Anderson Cancer Center
[Right-hand results panels obscured by viewers; same poster as s1]
Arndt Vogel@ArndtVogel
1) Trial design schema: TRIDENTE study design slide (Kotani, ESMO 2026) · 2) Kaplan-Meier survival data: TRIDENTE PFS and OS Kaplan-Meier curves (Kotani, ESMO 2026) · 3) Response data: TRIDENTE ORR by baseline ctDNA status (Kotani, ESMO 2026)
TRIDENTE: A phase II study of rechallenge with ENCO, BINI, and CET in BRAF V600E-mutant mCRC
#ESMO26 #ESMOAmbassadors
👉mPFS: 2.8 mo
👉mOS: 9.6 mo
👉ORR: 19%
🧐Supports biomarker-driven re-challenging concepts for 🎯therapies in CRC
@myESMO @ASCO https://t.co/OEuTM83GGe
[Slide 1]
TRIDENTE: study design
Multicenter, single-arm phase II study
RAS wild-type/BRAF V600E-mutant mCRC -> EC-based therapy -> PD -> ≥1 of SoC -> PD -> ENCO + BINI + CET (N = 21)
• Encorafenib 300 mg QD
• Binimetinib 45 mg BID
• Cetuximab initially 400 mg/m2 and subsequently 250 mg/m2 QW
• CR or PR by RECIST v1.1
• PD within 4 weeks after the last ENCO administration
≥ 4 months
Key eligibility criteria
• ≥ 20 years of age
• ECOG PS 0-1
• Refractory or intolerant to fluoropyrimidine-based chemotherapy including oxaliplatin or irinotecan
• Measurable disease per RECIST v1.1
• Primary endpoint: Investigator-assessed objective response rate (ORR)*
• Secondary endpoints: Progression-free survival (PFS), overall survival (OS), disease control rate (DCR), and safety
• Exploratory biomarker analysis: circulating tumor DNA at baseline and disease progression
* Statistics: Threshold 3%, expected 20%, α = 0.05 (one-sided), power 80%
ctDNA analysis using Guardant360®
Daisuke Kotani, MD, PhD
Clinical trial information: jRCTs031210511
[Slide 3]
Progression-free survival and overall survival
Progression-free survival
Median PFS 2.8 months (95% CI, 2.4 – 3.9 months)
PFS probability; Months after registration 0 3 6 9 12
Number at risk 21 8 1 1 0
Overall survival
Median OS 9.6 months (95% CI, 4.9 – 17.0 months)
OS probability; Months after registration 0 3 6 9 12 15 18 21 24
Number at risk 21 19 15 11 7 6 4 2 0
Median follow-up: 9.5 months (range, 1.6 – 23.5 months)
Daisuke Kotani, MD, PhD
Survival table
Endpoint: PFS and OS (single arm, ENCO + BINI + CET)
Arm | N | Median | Median CI
ENCO + BINI + CET - PFS | 21 | 2.8 months | 95% CI, 2.4 – 3.9 months
ENCO + BINI + CET - OS | 21 | 9.6 months | 95% CI, 4.9 – 17.0 months
[Slide 4]
ORR by baseline ctDNA status
ORR (%)
Detectable baseline plasma BRAF V600E and no resistance alterations* | 30.0% (3/10) | 95% CI, 6.7 - 65.2%
Undetectable baseline plasma BRAF V600E or any resistance alterations* | 10.0% (1/10) | 95% CI, 0.3 - 44.5%
Baseline ctDNA analysis was available in 20 patients (95.2%). There was no statistically significant difference between the groups (p = 0.284).
When baseline BRAF V600E detection status was not considered, the ORR was 25.0% in patients without resistance alterations and 12.5% in those with resistance alterations.
* Resistance alterations were defined as mutations in KRAS, NRAS, MAP2K1, or EGFR, or amplifications in MET, BRAF, or KRAS.
Daisuke Kotani, MD, PhD
Nieves Martinez Lago MD PhD@DraMartinezLago
Kaplan-Meier survival data: FORTITUDE-102: Overall Survival by FGFR2 Amplification Status
#ESMO26 🧬 FORTITUDE-101/102 | FGFR2
🔎 Exploratory biomarker analysis in FGFR2b+ GC/GEJ
🧪 FGFR2 amplification: ~16–19%
📈 Bemarituzumab OS signal if amplified:
🔹 F101: HR 0.50
🔹 F102: HR 0.67
💡 Could FGFR2 amplification guide patient selection?
@OncoAlert https://t.co/8QRPQPr64G
16:15 - 17:45 Rapid oral 1: Gastrointestinal tumour, upper digestive
CHAIRS: MARIA IGNEZ BRAGHIROLI, FENG WANG, LUCJAN WYRWICZ
FORTITUDE-102: Overall Survival by FGFR2 Amplification Status
FGFR2 Amplified (Placebo vs Bema)
Median OS, months (95% CI): Bema 16.6 (11.8–NE); Placebo 8.0 (5.4–18.8)
OS HR (95% CI): 0.67 (0.34–1.32)
P = 0.24
Number at Risk (0, 6, 12, 18, 24, 30 months)
Placebo 22 14 8 5 0 0
Bema 25 21 14 6 1 0
FGFR2 Non-amplified (Placebo vs Bema)
Median OS, months (95% CI): Bema 17.3 (13.7–19.8); Placebo 14.5 (13.0–16.0)
OS HR (95% CI): 0.84 (0.61–1.15)
P = 0.27
Number at Risk (0, 6, 12, 18, 24, 30 months)
Placebo 128 113 69 26 8 0
Bema 121 99 74 33 8 1
Key findings:
• In FORTITUDE-102, adding bemarituzumab to mFOLFOX6/CAPOX + nivolumab yielded a numerically greater treatment effect in FGFR2-amplified vs non-amplified patients (OS HR 0.67 [95% CI 0.34–1.32] vs 0.84 [0.61–1.15]; PFS HR 0.77 [95% CI 0.40–1.49] vs 0.87 [0.65–1.17])
• Results from the placebo arm suggest FGFR2 amplification may confer poor prognosis
FGFR2 amplification identified by tissue and/or ctDNA NGS.
Presented by: Zev Wainberg, MD
[Speaker panel: Zev Wainberg — Efficacy of bemarituzumab in patients with advanced gastric and gastroesophageal junction cancer (GC/GEJ) by FGFR2 amplification status: Exploratory biomarker analysis from FORTITUDE-101 (F101) and FORTITUDE-102 (F102)]
ALMERIA AUDITORIUM - HALL 9
Survival table
Endpoint: OS by FGFR2 amplification status (exploratory)
Arm | N | Median | Median CI
FGFR2 amplified: Bema + mFOLFOX6/CAPOX + nivolumab | 25 | 16.6 mo | 11.8–NE
FGFR2 amplified: Placebo + mFOLFOX6/CAPOX + nivolumab | 22 | 8.0 mo | 5.4–18.8
FGFR2 non-amplified: Bema + mFOLFOX6/CAPOX + nivolumab | 121 | 17.3 mo | 13.7–19.8
FGFR2 non-amplified: Placebo + mFOLFOX6/CAPOX + nivolumab | 128 | 14.5 mo | 13.0–16.0
HR: 0.67 (amplified); 0.84 (non-amplified)
HR CI: 0.34–1.32 (amplified); 0.61–1.15 (non-amplified)
P: 0.24 (amplified); 0.27 (non-amplified)
Shankar Siva@_ShankarSiva
1) Kaplan-Meier survival data: Adjuvant XELOX 4 vs 6 months (LOMAC): DFS and OS in mITT and PP · 2) Slide: Adjuvant XELOX 4 vs 6 months: Conclusion slide - Dazhi Xu · 3) Kaplan-Meier survival data: What does LOMAC tell us? Discussant slide - Feng Wang
🚨#ESMO26 Localised stage II-IIIB gastroesophageal cancer; n=1024 patient trial from 🇨🇳 indicates de-escalated 4 months of adjuvant XELOX is non-inferior to 6 months XELOX . V important as tolerance of these regimens is a big issue! #gcsm @marklewismd https://t.co/0JFfDHHn4j
#ESMO26 🧬 PEAK | Phase III
👥 Advanced GIST after imatinib
💊 Bezuclastinib + sunitinib vs sunitinib
📈 mPFS: 16.5 vs 9.2 mo (HR 0.50)
🎯 ORR: 45.6% vs 25.8%
🔄 After SUN progression (n=128):
📈 mPFS: 7.4 mo | ORR: 29.7%
🚀 Sustained activity despite prior SUN progression!
@OncoAlert
[Slide 1]
08:30 - 10:00 Rapid oral: Sarcoma
CHAIRS: MARK DICKSON, PALMA DILEO, CESAR SERRANO
Combination of Bezuclastinib + Sunitinib Inhibits the Broad Spectrum of Primary and Secondary KIT Mutations
Bezuclastinib: Next-generation oral KIT inhibitor1-5
• In combination with sunitinib, covers the broad spectrum of KIT mutations1-4
• High selectivity & lack of off-target effects allow for combination2,3
Pivotal results from Peak trial assessing safety & efficacy of 2nd line bezuclastinib + sunitinib vs sunitinib in patients with GIST5:
• Significantly superior efficacy, including mPFS of 16.5 months (vs 9.2 months for sunitinib monotherapy) & 46% ORR
—PFS2 median not reached with combination vs 21.0 months with sunitinib alone
• No new safety risks identified with the combination
Exon* | Imatinib | Sunitinib | Regorafenib | Ripretinib | Bezuclastinib + Sunitinib
[inhibition table for exons 9, 11, 13, 14, 17, 18 shown as colour shading: None / Moderate / Strong]
Here, we present results from part 2 of the Peak clinical trial evaluating the efficacy & safety following crossover to bezuclastinib + sunitinib combination in patients with advanced GIST who progressed on sunitinib monotherapy
GIST, gastrointestinal stromal tumor; KIT, proto-oncogene c-kit; mPFS, median progression-free survival; ORR, objective response rate; PFS2, progression-free survival 2.
1. Wagner AJ, et al. CTOS Annual Meeting; November 16–19, 2022; Vancouver, Canada. 2. Wagner AJ, et al. JAMA Oncol. 2021;7(9):1343-1350. 3. Guarnieri A, et al. AACR Annual Meeting; April 8–13, 2022; New Orleans, LA. 4. Wagner A, et al. ASCO Annual Meeting; May 29-June 2, 2026; Chicago, IL. 5. Wagner A, et al. ASCO Annual Meeting; May 31-June 4, 2024; Chicago, IL.
*This table of inhibitors is based on preclinical data
Robin Jones
Phase 3 peak crossover: Bezuclastinib + sunitinib combination following sunitinib monotherapy in patients with GIST
MALAGA AUDITORIUM - HALL 3
[Slide 2]
08:30 - 10:00 Rapid oral: Sarcoma
CHAIRS: MARK DICKSON, PALMA DILEO, CESAR SERRANO
Peak (NCT05208047) Is a Global, Randomized, Open-Label, Phase 3 Trial
This analysis evaluated patients in Peak who crossed over to receive bezuclastinib + sunitinib combination after progressing on sunitinib monotherapy
Patients 1:1 Randomized
Bezuclastinib 600 mg QD + Sunitinib 37.5 mg QD (n=204)
Sunitinib 37.5 mg QD (n = 209)
EOT/BICR confirmed PD
Crossover Bezuclastinib 600 mg QD + Sunitinib 37.5 mg QD (n = 128)
EoT/BICR confirmed PD
Crossover evaluation PFS ORR Safety
30-Day Safety and Post-Treatment Follow-up
BICR, Blinded Independent Central Review; EoT, end of treatment; ORR, objective response rate, PD, disease progression; PFS, progression-free survival; QD, once daily
Data cutoff: Sep 30, 2025
Robin Jones
Phase 3 peak crossover: Bezuclastinib + sunitinib combination following sunitinib monotherapy in patients with GIST
MALAGA AUDITORIUM - HALL 3
[Slide 3]
08:30 - 10:00 Rapid oral: Sarcoma
CHAIRS: MARK DICKSON, PALMA DILEO, CESAR SERRANO
Patients Had Improved Disease Control With Crossover Therapy Compared With Sunitinib Monotherapy
Progression-free Survival (%)
Time (months)
mPFS in 128 Crossover Patients
Following Crossover to Combination 7.4 months 95% CI (5.6-11.0)
• In patients who crossed over to combination therapy:
• mPFS with 2nd-line sunitinib was 5.7 months (95% CI: 3.8-7.3 months)
• mPFS with subsequent combination therapy was 7.4 months (95% CI: 5.6-11.0 months)
CI, confidence interval; mPFS, median progression-free survival.
Data cutoff: Sep 30, 2025
Robin Jones
Phase 3 peak crossover: Bezuclastinib + sunitinib combination following sunitinib monotherapy in patients with GIST
MALAGA AUDITORIUM - HALL 3
Survival table
Endpoint: Progression-free survival after crossover (single arm)
Arm | N | Median | Median CI
Crossover to bezuclastinib + sunitinib | 128 | 7.4 mo | 5.6-11.0
Same patients on prior 2nd-line sunitinib (reference) | 128 | 5.7 mo | 3.8-7.3
[Slide 4]
08:30 - 10:00 Rapid oral: Sarcoma
CHAIRS: MARK DICKSON, PALMA DILEO, CESAR SERRANO
Patients Had Improved Response Rate With Crossover Therapy Compared With Sunitinib Monotherapy
• In patients who crossed over to combination therapy:
• ORR to 2nd-line sunitinib was 20.3% (95% CI: 13.7%-28.3%) (n=26)
• ORR to subsequent combination therapy was 29.7% (95% CI: 21.9%-38.4%) (n=38)
• 80% (n=102) of patients entering the crossover had not achieved an objective response on sunitinib monotherapy (best response of SD or PD)
• In patients with best response of disease progression on sunitinib, ORR was 56% with combination
• 2 patients with PD on monotherapy achieved a CR on combination
Sunitinib 37.5 mg QD (n = 209)
Crossover Bezuclastinib 600 mg QD + Sunitinib 37.5 mg QD (n = 128)
CR, complete response; ORR, objective response rate; PD, progressive disease; QD, once daily; SD, stable disease.
Data cutoff: Sep 30, 2025
Robin Jones
Phase 3 peak crossover: Bezuclastinib + sunitinib combination following sunitinib monotherapy in patients with GIST
MALAGA AUDITORIUM - HALL 3
Today I had the honor to discuss two important abstracts of novel treatment approaches for patients with #HCC across different stages and settings at #ESMO26. Not yet in clinical practice, but clinically relevant results. #ESMOAmbassadors @myESMO @HUNIMED @HumanitasMilano https://t.co/yB65N2tPaf
[Slide 1]
LBA48 – EMERALD-3 PHASE 3 STUDY
Study Design and Endpoints
[Embedded study schema, small text:]
Study population: Confirmed HCC not amenable to curative treatment, but eligible for embolisation; Child-Pugh class A; ECOG PS 0 or 1; No extrahepatic disease; Excludes Vp3 and Vp4; No prior systemic therapy
Stratification factors: Geographical region (Japan vs Asia [excluding Japan] vs rest of the world); Prior palliative locoregional therapy (1 >6 months vs 1 ≤6 months vs none); Baseline tumour burden (>Up-to-7 vs ≤Up-to-7)
R, N=760
Arm A: STRIDE + L + TACE (n=293)
Arm B: STRIDE + TACE (n=175)
Arm C: TACE (n=292)
*Participants were randomised 1:1:1 to Arms A, B and C until each arm reached 175 participants; following this, randomisation continued 1:1 to Arms A and C until reaching ~275 participants per arm
Primary endpoint: PFS for Arm A vs C per RECIST v1.1 by BICR
Key secondary endpoints: OS for Arm A vs C; PFS for Arm B vs C per RECIST v1.1 by BICR; OS for Arm B vs C
Other secondary endpoints included: PFS2, PROs, safety
Post-hoc exploratory assessments: TTNT; Mean ALBI and Child-Pugh scores over the treatment period
➢ Positive phase 3 study
➢ Primary endpoint PFS
➢ Post-hoc exploratory analyses
➢ Liver function trajectory, efficacy, post-progression outcomes and safety by baseline liver function
➢ Liver function is a key factor for HCC management
➢ Liver function may be worsened by repeated TACE
➢ Liver decompensation is a competing risk of death across stages
➢ Post-progression treatment options and outcomes are challenging
Pinato DJ. ESMO 2025; Celsa C et al. Hepatology 2024; Cabibbo G et al. Clin Cancer Res 2024
Lorenza Rimassa, MD
[Slide 2]
LBA48 – EMERALD-3 PHASE 3 STUDY
Conclusions
> Liver function remained stable over the treatment period with STRIDE ± L + TACE, with consistent patterns for subsequent anti-cancer therapy use, irrespective of baseline liver function
> I agree
> STRIDE ± L + TACE showed clinically meaningful improvements in post-progression outcomes (TTNT and PFS2), with favorable OS vs TACE, regardless of baseline ALBI grade
> I agree, but OS data are not mature
> Safety outcomes were broadly consistent with the overall study population, regardless of baseline ALBI grade
> I agree, but shorter duration of systemic therapy and lower number of TACE in ALBI grade 2 group
> These results support a STRIDE-based regimen in combination with TACE as a potential new treatment option for eeHCC
> I agree, but we have to wait for OS for STRIDE+L+TACE; or how can/should we consider the available OS for STRIDE+TACE?
Lorenza Rimassa, MD
[Slide 3]
1679O – PHASE 1 STUDY OF BGB-B2033 BISPECIFIC AB
Study Design and Baseline Characteristics
[Embedded study design schematic: Monotherapy Dose Escalation and Dose Optimization, BGB-B2033 Q3W in Patients with aHCC; Key Eligibility Criteria; Endpoints (Primary: Safety, MTD...; Secondary: Objective response rate by investigator per RECIST v1.1, Pharmacokinetics/pharmacodynamics, Immunogenicity); Total Enrollment = 94; dose optimization 300 mg Q3W N=28 [?], 450 mg Q3W N=27 [?]; embedded baseline characteristics table - small text largely illegible]
> 94 heavily pretreated patients
> 39 dose escalation, 55 dose optimization
> Median age 56.5, male 84%, Asian 87.2%
> HBV-related HCC 87.2%
> Median n. of prior treatment lines 2 (1-8)
> ≥3 prior treatment lines 24.5%
> Previous systemic therapies
> Anti-PD-(L)1 93.6%
> TKI 68.1%
> Anti-PD-(L)1 and TKI 61.7%
> Median follow-up 5.5 (0.3-16.7) months
Lorenza Rimassa, MD
[Slide 4]
1679O – PHASE 1 STUDY OF BGB-B2033 BISPECIFIC AB
Conclusions
> BGB-B2033, a first-in-class GPC3 x 4-1BB bispecific antibody, continues to demonstrate compelling antitumor activity in patients with heavily pretreated aHCC
> I agree, although DCR, PFS, and OS data are not yet available and a longer follow up is needed
> At the RP2D (450 mg Q3W), cORR was 36% and the 6-month DOR was 74%
> The favorable tolerability profile is notable as patients with heavily pretreated aHCC…
> I agree
> Given the compelling antitumor activity and favorable safety profile, global registrational studies are planned to be initiated by the end of the year
> Phase 3 study of BGB-B2033 vs investigator's choice of sorafenib or lenvatinib in patients with HCC who progressed on prior systemic treatment
> I agree; high unmet medical need: immunotherapy combinations are available as first-line systemic treatment options, but no level 1 evidence therapies are available for previously treated patients
Lorenza Rimassa, MD
Arndt Vogel@ArndtVogel
Kaplan-Meier survival data: EMERALD-3 OS by baseline ALBI grade, STRIDE + TACE vs TACE (Kudo, ESMO 2026)
Liver function trajectory & post-progression outcomes in the pts 3 EMERALD-3 study of STRIDE ± Lenva + TACE in HCC
#ESMO26 #ESMOAmbassadors
👉 liver function maintained
👉 similar subsequent therapies
🧐No overal OS benefit, but interesting OS signal for STRIDE in ALBI 1 pts
@myESMO @ASCO
OS BY BASELINE ALBI GRADE: STRIDE + TACE vs TACE*
ALBI Grade 1
| STRIDE + TACE (n=105) | TACE* (n=111)
Total OS events, n (%) | 30 (28.6) | 51 (45.9)
Median OS, months (95% CI) | NC (37.8–NC) | 39.2 (28.0–NC)
HR (95% CI) | 0.57 (0.36–0.90)
OS maturity: 37.5%
ALBI Grade 2
| STRIDE + TACE (n=70) | TACE* (n=64)
Total OS events, n (%) | 39 (55.7) | 39 (60.9)
Median OS, months (95% CI) | 27.9 (17.8–NC) | 20.4 (16.6–30.1)
HR (95% CI) | 0.81 (0.52–1.26)
OS maturity: 58.2%
Proportion of participants alive (%) vs Time from randomisation (months) 0-45
Number of participants at risk (ALBI Grade 1) | 0 | 3 | 6 | 9 | 12 | 15 | 18 | 21 | 24 | 27 | 30 | 33 | 36 | 39 | 42 | 45
STRIDE + TACE | 105 | 100 | 98 | 97 | 94 | 87 | 85 | 80 | 77 | 73 | 60 | 37 | 18 | 10 | 4 | 0
TACE | 111 | 109 | 106 | 98 | 92 | 88 | 79 | 76 | 70 | 65 | 53 | 31 | 16 | 10 | 5 | 0
Number of participants at risk (ALBI Grade 2) | 0 | 3 | 6 | 9 | 12 | 15 | 18 | 21 | 24 | 27 | 30 | 33 | 36 | 39 | 42 | 45
STRIDE + TACE | 70 | 65 | 63 | 58 | 53 | 49 | 43 | 39 | 37 | 35 | 31 | 23 | 6 | 1 | 0 | 0
TACE | 64 | 57 | 50 | 50 | 46 | 43 | 35 | 30 | 27 | 27 | 22 | 11 | 4 | 2 | 1 | 0
DCO2: 23 Feb 2026.
*Out of the first 175 participants randomised to this treatment arm.
Circles represent censored observations. For participants with baseline ALBI grade 1, median (range) follow-up duration for OS was 31.0 (0.7–43.2) months for STRIDE+TACE and 29.4 (2.8–43.9) months for TACE; for participants with baseline ALBI grade 2, median (range) follow-up duration was 27.4 (0.5–39.6) months and 19.7 (0.5–44.0) months, respectively.
Masatoshi Kudo, MD, PhD
Survival table
Endpoint: Overall survival by baseline ALBI grade (STRIDE + TACE vs TACE)
Arm | N | Median | Median CI
ALBI Grade 1 - STRIDE + TACE | 105 | NC | 37.8–NC
ALBI Grade 1 - TACE | 111 | 39.2 | 28.0–NC
ALBI Grade 2 - STRIDE + TACE | 70 | 27.9 | 17.8–NC
ALBI Grade 2 - TACE | 64 | 20.4 | 16.6–30.1
HR: ALBI 1: 0.57; ALBI 2: 0.81
HR CI: ALBI 1: 0.36–0.90; ALBI 2: 0.52–1.26
Grainne O'Kane@graokane
1) Response data: BGB-B2033 spider plot and duration of response in confirmed responders, aHCC · 2) Slide: BGB-B2033 phase 1 conclusions in heavily pretreated aHCC (Chon, ESMO 2026)
🔥Promising #HCC BGB-B2033
➡️GPC3 x 4-1BB bispecific ph1/2 more mature data
➡️dose escalation/optimisation
activity across all: 2/3rd >2 prior lines
ORR ~36%
➡️450mg selected R2PD; very favourable toxicity
➡️Phase 3 GroundBBreaker 301 due to open
@myESMO #ESMO26 @OncoAlert https://t.co/hWFOctxvUN
[Slide 3]
Among Patients With a Confirmed Responsea to BGB-B2033, Tumor Reductions Were Sustained Over Time Across Cohorts
DOR (95% CI), % | 450 mg Q3W (n=9)a | All Patients (N=27)a
3-month | 88.9 (43.3-98.4) | 92.4 (73.0-98.1)
6-month | 74.1 (28.9-93.0) | 79.2 (56.9-90.8)
Y-axis: Target Lesion Percent Change from Baseline (%); X-axis: Time from First Treatment (Months)
Status: Ongoing (solid) | Discontinued (dashed)
Data cut-off: 22 September 2026
aInvestigator-assessed confirmed responders.
Presenter: Hong Jae Chon, MD, PhD
[Slide 4]
Conclusion
1 With longer follow up, BGB-B2033, a first-in-class GPC3 x 4-1BB bispecific antibody, continues to demonstrate compelling antitumor activity in patients with heavily pretreated aHCC
2 At the RP2D (450 mg Q3W), cORR was 36% and the 6-month DOR was 74%
3 The favorable tolerability profile is notable as patients with heavily pretreated aHCC often have underlying liver disease that limits therapeutic options
4 Given the compelling antitumor activity and favorable safety profile, global registrational studies are planned to be initiated by the end of the year
aHCC, advanced hepatocellular carcinoma; cORR, confirmed objective response rate; DOR, duration of response; GPC3, glypican-3; ORR, objective response rate; RP2D, recommended phase 2 dose; Q3W, every 3 weeks
Presenter: Hong Jae Chon, MD, PhD
Nieves Martinez Lago MD PhD@DraMartinezLago
Kaplan-Meier survival data: LOMAC: DFS and OS in the mITT and PP populations
#ESMO26 💊 LOMAC | Phase III | Rapid Oral
👥 1,023 pts | Stage II–III gastric cancer after D2 surgery
🔀 XELOX 4 vs 6 months
✅ 3-y DFS: 69.2% vs 70.8% (HR 1.01) → Noninferior
⚠️ G≥3 AEs: 8.4% vs 15%
📈 Completion: 83.6% vs 60.4%
💡 Shorter treatment, less toxicity!
@OncoAlert
16:15 - 17:45 Rapid oral 1: Gastrointestinal tumour, upper digestive
CHAIRS: MARIA IGNEZ BRAGHIROLI, FENG WANG, LUCJAN WYRWICZ
DFS and OS in the mITT and PP Population Median follow-up: 52.8 months
Disease-free survival - mITT population
Modified intention-to-treat: 4-month vs 6-month groups · Center-stratified Cox model · N=1023
HR, 1.01 (95% CI, 0.82-1.25)
One-sided P = 0.006 · NI met · margin HR 1.33
No. at risk: 6 months 512 450 394 358 209 95 40 13 5; 4 months 511 462 397 352 210 106 44 15 6
Disease-free survival - PP population
Per protocol: 4-month group completing 5-6 cycles vs 6-month group completing 8 cycles · Center-stratified Cox model · N=736
HR, 0.96 (95% CI, 0.75-1.25)
One-sided P = 0.007 · NI met · margin HR 1.33
No. at risk: 6 months 309 271 238 219 126 57 24 7 2; 4 months 427 388 332 296 175 86 33 12 5
Overall survival - mITT population
HR, 1.06 (95% CI, 0.84-1.34)
No. at risk: 6 months 512 489 439 401 229 107 46 14 5; 4 months 511 496 450 392 230 113 44 15 6
Overall survival - PP population
HR, 0.95 (95% CI, 0.71-1.27)
No. at risk: 6 months 309 295 264 240 137 66 26 8 2; 4 months 427 418 380 333 194 92 33 12 5
Months since randomization (0-96)
Dazhi Xu
Dazhi Xu
Four months of adjuvant XELOX versus six months in stage II-IIIB gastric cancer: The LOMAC randomized trial
ALMERIA AUDITORIUM - HALL 9
Survival table
Endpoint: DFS (primary, non-inferiority) and OS, mITT and PP
6 months XELOX (mITT) | 512
4 months XELOX (mITT) | 511
6 months XELOX (PP) | 309
4 months XELOX (PP) | 427
HR: DFS mITT 1.01; DFS PP 0.96; OS mITT 1.06; OS PP 0.95
HR CI: DFS mITT 0.82-1.25; DFS PP 0.75-1.25; OS mITT 0.84-1.34; OS PP 0.71-1.27
P: DFS mITT one-sided P=0.006 (NI met, margin HR 1.33); DFS PP one-sided P=0.007
Angela Lamarca@DrAngelaLamarca
Trial design schema: GroundBBreaker 301 phase 3 study design: BGB-B2033 vs sorafenib/lenvatinib in HCC
BGB-B2033 (GPC3-41BB) biespecific antibody in #HCC at @myESMO #ESMO26
Promising data from phase I trial - ORR36%
Heavily pre-treated population
👉Development continues - phase III planned
#ESMOAmbassadors https://t.co/lOcWvTiPQr
GroundBBreaker 301 Study (NCT07836530)
Phase 3 study of BGB-B2033 vs investigator's choice of sorafenib or lenvatinib in patients with HCC who progressed on prior systemic treatment
Key Eligibility Criteria
• Adults (≥18 years) with histologically confirmed HCC not amenable to curative surgical or locoregional therapies
• GPC3 expression level for stratification
• Previously treated with up to 2 systemic regimens, including PD-(L)1 inhibitors
• Measurable disease per RECIST v1.1
• ECOG PS 0 or 1
• Adequate organ function
N=492
R 1:1
BGB-B2033
• 450mg Q3W intravenous administration
• Until disease progression, unacceptable toxicity, or other discontinuation criteria
Investigator's choice
• Sorafenib BID or lenvatinib QD
• Until disease progression, unacceptable toxicity, or other discontinuation criteria
Primary endpoint: OS
Secondary endpoints: ORR, PFS, and DOR per BICR and investigator assessment | Safety | PROs
BICR, blinded independent central review; BID, twice daily; DOR, duration of response; ECOG PS, Eastern Cooperative Oncology Group performance status; GPC3, glypican-3; HCC, hepatocellular carcinoma; ORR, objective response rate; OS, overall survival; PD-(L)1, programmed cell death protein (ligand) 1; PFS, progression-free survival; PRO, patient-reported outcome; Q3W, every 3 weeks; QD, daily; RECIST, Response Evaluation Criteria in Solid Tumors.
Presenter: Hong Jae Chon, MD, PhD
🚨ARION PRODIGE 67🚨
Locally Advanced Esophagus Cancer (adeno or squam)
n=112
Randomized
CRT (50 Gy/25 Fx + FOLFOX) +/- concurrent and adjuvant durvalumab (total 12 m)
No SS differences in:
PFS 48% vs. 50%
OS 68% vs. 75%
#ESMO26 https://t.co/yDHzaOsCyB
2879RO - Durvalumab plus definitive chemoradiotherapy versus definitive chemoradiotherapy in patients with locally advanced esophagus carcinoma: ARION PRODIGE 67 randomized phase 2 trial
Speakers Marie-Anouchka Modesto (Toulouse, France)
Lecture Time 17:09 - 17:14
Abstract
Background
In locally advanced or unresectable esophageal cancer, definitive chemoradiotherapy (CRT) is the standard of care (SoC) combining radiotherapy with platinum-based chemotherapy, resulting in a 2-year disease-free survival of 25%, which remains an unmet medical need. As immune checkpoint inhibitors increase survival in the metastatic setting, a multicentric, this open-label, comparative phase II ARION trial was designed to assess efficacy and safety of PD1/PDL1 blockade by durvalumab (D) added to SoC.
Methods
Patients (pts) ≥18 years old, WHO performance status ≤1, non-metastatic, locally advanced squamous cell carcinoma (SCC) or unresectable adenocarcinoma (ADK), (stratified by tumor stage, histology, centers) were randomized between arm A with 12 monthly 1500 mg (D) infusions added to SoC (IMRT 50 Gy/25 daily fractions over 5 weeks) and 6 cycles of FOLFOX regimen: oxaliplatin 85 mg/m2, Leucovorin 200 mg/m2, 5-FU 400 mg/m2 bolus then continuous 2400 mg/m2 over 46 h) or arm B (SoC). Primary endpoint was centrally reviewed progression-free survival (cPFS). Overall survival (OS), PFS and safety were secondary endpoints. 74 cPFS events were required to detect a hazard ratio (HR) of 0.55 with 90% power (10% one-sided alpha).
Results
Between May 2019 and May 2024, 112 pts were randomized (Arm A: SoC + D, n=58 / Arm B: SoC, n=54) in 13 French sites. Analysis was performed after a 24-month follow-up. Median age was 67 years, 68% were male, 77% were SCC, 70% had nodal extension. There was no significant difference between arms for cPFS, PFS and OS (table). Treatment-related adverse events (AE) were higher in arm A. Grade ≥ 3 AE rates were similar in both arms. Table: 2879RO
| | Arm A (exp) 12-month rate [95%CI] | Arm B (SoC) 12-month rate [95%CI] | Adjusted HR* [95%CI] [80%CI] | 1-sided p-value |
| cPFS | 48.6% [34.6; 61.3] | 48.9% [34.7; 61.7] | 0.91 [0.55; 1.49] [0.66; 1.25] | 0.351 |
| PFS | 50.1% [36.2; 62.5] | 48.1% [33.7; 61.2] | 0.92 [0.56; 1.50] [0.67; 1.27] | 0.369 |
| OS | 75.1% [61.6; 84.4] | 67.9% [53.6; 78.7] | 0.99 [0.59; 1.68] [0.70; 1.40] | 0.489 |
*for Histological subtype, Stage
Conclusions
In this indication, Durvalumab with CRT compared to SoC did not improve PFS. There was no new safety signal. Longer survival, follow-up and predictive factors for treatment efficacy will be presented.
María San Román Gil@mariasanroman21
1) Slide: Poster 2423P: systemic therapy in advanced gastric neuroendocrine neoplasms, R-GETNE · 2) Slide: María San-Román-Gil with poster 2423P on advanced gastric neuroendocrine neoplasms
Proud to present our #ESMO26 poster 🎉 Advanced gastric NENs from R-GETNE (n=191, 37 centres):
🔹 NET vs NEC: mOS 50 vs 9 mo (HR 3.39)
🔹 NETs: Ki-67 rules, mOS 66 → 34 → 10 mo (G1 → G2-high → G3)
🔹 NECs: lung mets → mOS 4 vs 10 mo
Thanks to all co-authors and @GrupoGetne https://t.co/ZisKvJ64ut
[Slide 1]
2423P - Systemic Therapy in Advanced Gastric Neuroendocrine Neoplasms (G-NENs): Real-World Evidence from the R-GETNE National Registry (G-NENCARE)
María San-Román-Gil1*, Paula Jiménez-Fonseca2, Alejandro García-Álvarez3, Carlos González-Merino4, Guillermo Crespo-Herrero5, Alberto Carmona-Bayonas6, Marta Benavent-Viñuales7, Carlos López-López8, Vicente Alonso-Orduña9, Ángel Segura-Huerta10, Nieves Martínez-Lago11, Javier Gallego-Plazas12, Marta Llanos-Muñoz13, Laura Nosti-Martínez2, Sergio Pérez-Fernández3, Rocío García-Carbonero1,14
GETNE Grupo Español de Tumores Neuroendocrinos y Endocrinos | Hospital Universitario 12 de Octubre | i+12 Instituto de Investigación Hospital 12 de Octubre
INTRODUCTION
• Most gastric NENs are indolent type 1 NETs diagnosed at an early stage, so advanced cases are uncommon.
• Advanced G-NENs are underrepresented in clinical trials, which limits the evidence available for clinical practice.
• We analysed the efficacy of systemic therapy and prognostic factors in advanced G-NENs from the Spanish national registry R-GETNE.
METHODS
• 191 of 711 (26.9%) G-NENs patients presented with or developed advanced disease registered in R-GETNE by 37 participating Spanish centres (1998–2024)
• Overall survival was assessed from metastatic onset (mOS), defined as the start of 1st-line systemic therapy, using the Kaplan–Meier method and compared with the log-rank test; hazard ratios were estimated with Cox regression models.
RESULTS
Baseline characteristics are summarized in Table 1.
191 patients: 61 NETs (32%), 107 NECs (56%) and 23 (12%) with unknown differentiation.
NETs vs NECs: mOS 50m vs 9m (HR 3.39; p<0.001).
NETs: Ki-67 was the main prognostic factor - mOS: 66m in G1, 64m in G2-low (3–10%), 34m in G2-high (11–20%), and 10m in G3 tumors (HR 1.76; p=0.021) – FIGURE 1.
NECs: numerically longer mOS with Ki-67 <50% (17m vs 9m; HR 1.34; p=0.32) – FIGURE 2; lung metastases vs none predicted worse mOS: 4m vs 10m (HR 2.07; p=0.04).
Treatment: SSA predominated in NETs and platinum-CT in NECs (Table 2; FIGURES 3–4).
Table 1. Clinicopathological characteristics: G-NETs vs G-NECs
Characteristic | NET (n=61) | NEC (n=107) | p | Total (n=191) (^)
Age, median (range), years | 62 (21–85) | 70 (38–96) | 0.012 | 67 (21–96)
Male / Female, % | 62.3 / 37.7 | 69.2 / 30.8 | 0.40 | 69.1 / 30.9
ECOG PS 0 / 1 / 2 / ≥3, % | 48.9 / 39.5 / 9.3 / 2.3 | 10.5 / 54.6 / 25.6 / 9.3 | <0.001 | 23.7 / 49.6 / 19.3 / 7.4
Stage (at diagnosis) I / II / III / IV, % | 5.1 / 8.5 / 10.1 / 76.3 | 0 / 1.9 / 14.0 / 84.1 | 0.018 | 1.6 / 4.3 / 13.4 / 80.7
Ki-67 NET: <3% / 3–10% / 11–20% / >20%, % | 27.6 / 43.1 / 22.4 / 6.9 | – | |
Ki-67 NEC: 21–50% / >50%, % | – | 21.2 / 78.8 | |
Metastases: liver / non-regional LN / peritoneum / lung / bone, % (*) | 81.4 / 27.9 / 25.6 / 7.0 / 7.0 | 79.1 / 36.3 / 23.1 / 14.3 / 13.2 | >0.05 | 81.2 / 32.2 / 23.5 / 11.4 / 10.1
1st-line systemic treatment, % | 78.7 | 76.6 | 0.85 | 76.4
ECOG PS: Eastern Cooperative Oncology Group performance status; LN: lymph nodes. ^Total column includes 23 patients with unknown differentiation. *Patients may have more than one metastatic site.
Figures 1–4: Overall survival from metastatic disease (G-NETs by Ki-67; G-NECs by Ki-67; 1st-line treatment – G-NETs; 1st-line treatment – G-NECs) [curve legends and in-figure HR boxes too small to read reliably]
Table 2. mOS according to 1st-line treatment and Ki-67^
Ki-67 (n) | SSA | TT | Non-plat CT | Plat-CT | mOS
G-NET · mOS by treatment | 66m | 34m | 7m | 10m | FIGURE 3
<3% (11) | 9 (82) | 1 (9) | 1 (9) | 0 | 66m
3–10% (21) | 13 (62) | 2 (10) | 2 (10) | 4 (19) | 64m
11–20% (11) | 6 (55) | 1 (9) | 0 | 4 (36) | 34m
>20% (3) | 0 | 0 | 2 (67) | 1 (33) | 10m
Total treated (46)^ | 28 (61) | 4 (9) | 5 (11) | 9 (20) | 48m
G-NEC · mOS by treatment | – | – | 11m | 9m | FIGURE 4
21–50% (19) | 1 (5) | 1 (5) | 3 (16) | 14 (74) | 17m
>50% (60) | 0 | 0 | 7 (12) | 53 (88) | 9m
Total treated (79)^ | 1 (1) | 1 (1) | 10 (13) | 67 (85) | 9m
^Includes treated patients with known Ki-67 and type of 1st-line treatment. SSA: somatostatin analogues; TT: targeted therapy; Plat: Platinum; CT: chemotherapy; mOS: median overall survival from start of 1st-line therapy; m: months.
CONCLUSIONS
• This is one of the largest real-world studies describing treatment patterns and outcomes in advanced Gastric-NENs.
• Advanced G-NENs show marked prognostic heterogeneity: Ki-67 drives prognosis and treatment choice in NETs, whereas disease-related factors predominate in NECs.
• These findings provide valuable insights for clinical practice of a heterogeneous population underrepresented in clinical trials.
Funding: Grupo Español de Tumores Neuroendocrinos y Endocrinos (GETNE), RGETNE 2024 grant. // Acknowledgement: the participating centres, and the patients and their families. // Conflicts of interest: The presenting author has no conflict of interest regarding this communication.
[Slide 2]
2423P - Systemic Therapy in Advanced Gastric Neuroendocrine Neoplasms (G-NENs): Real-World Evidence from the R-GETNE National Registry (G-NENCARE)
INTRODUCTION
• Most gastric NENs are indolent type 1 NETs diagnosed at an early stage, so advanced cases are uncommon.
• Advanced G-NENs are underrepresented in clinical trials, which limits the evidence available for clinical practice.
• We analysed the efficacy of systemic therapy and prognostic factors in advanced G-NENs from the Spanish national registry R-GETNE.
METHODS
• 191 of 711 (26.9%) G-NENs patients presented with or developed advanced disease registered in R-GETNE by 37 participating Spanish centres (1998–2024)
• Overall survival was assessed from metastatic onset (mOS), defined as the start of 1st-line systemic therapy, using the Kaplan–Meier method and compared with the log-rank test; hazard ratios were estimated with Cox regression models.
RESULTS
Baseline characteristics are summarized in Table 1.
191 patients: 61 NETs (32%), 107 NECs (56%) and 23 (12%) with unknown differentiation.
NETs vs NECs: mOS 50m vs 9m (HR 3.39; p<0.001).
NETs: Ki-67 was the main prognostic factor - mOS: 66m in G1, 64m in G2-low (3–10%), 34m in G2-high (11–20%), and 10m in G3 tumors (HR 1.76; p=0.021) – FIGURE 1.
NECs: numerically longer mOS with Ki-67 <50% (17m vs 9m; HR 1.34; p=0.32) – FIGURE 2; lung metastases vs none predicted worse mOS: 4m vs 10m (HR 2.07; p=0.04).
Treatment: SSA predominated in NETs and platinum-CT in NECs (Table 2; FIGURES 3–4).
[Table 1, Table 2, figures and conclusions too small/washed out in this photo; see companion image 2114682086393028852_s1]
ESMO Open@ESMO_Open
Slide: ESMO Open: liquid biopsy-guided hyperselection for anti-EGFR rechallenge in mCRC, pooled analysis of 4 trials
Liquid biopsy-guided molecular hyperselection for anti-EGFR rechallenge therapy in refractory metastatic colorectal cancer: a pooled analysis of 4 trials in @ESMO_Open presented at #ESMO26. LB-based hyperselection of pts leads to better PFS & OS. https://t.co/TaC60t7nQF https://t.co/yxdJpmFgEn
ESMO Open - ORIGINAL ARTICLE
Liquid biopsy-guided molecular hyperselection for anti-EGFR rechallenge therapy in refractory metastatic colorectal cancer: a pooled analysis of four trials
D. Ciardiello, L. Boscolo-Bielo, C. M. Parseghian, A. Sartore-Bianchi, F. Pietrantonio, G. Martini, G. Mauri, G. Vetere, A. Avallone, A. De Stefano, S. Pisconti, G. Tortora, M. Messina, A. Fumagalli, A. Zaniboni, C. Pinto, G. Santabarbara, M. G. Zampino, R. Berardi, C. Lotesoriere, A. Cogoni, T. P. Latiano, E. Maiello, V. De Falco, L. Antonuzzo, A. Chiaramonte, A. Russo, F. Tosi, F. Villa, C. Cardone, N. Normanno, L. Altucci, R. Bordonaro, F. De Vita, G. Pellizzari, G. Curigliano, N. Fazio, E. Martinelli, T. Troiani, S. Siena, S. Kopetz, F. Ciardiello & S. Napolitano
A: Disease-control rate (bar chart) Neg. hyp. vs Pos. hyp.
B: Overall response rate (bar chart) Neg. hyp. vs Pos. hyp.
C: Median Progression-free survival (95%CI)
Pos. hyp.: 3.61 months (3.19-4.1)
Neg. hyp.: 4.70 months (4.20-5.7)
Hazard ratio: 1.50 (95%CI 1.14-1.96)
P=0.00337
At risk (0, 3, 6, 9, 12 months): Pos. 90 | 57 | 16 | 5 | 3; Neg. 156 | 110 | 51 | 22 | 10
D: Median Overall survival (95%CI)
Pos. hyp.: 11.4 months (10.3-14.2)
Neg. hyp.: 15.0 months (12.6-16.8)
Hazard ratio: 1.55 (95%CI 1.15-2.08)
P=0.00432
At risk (0, 6, 12, 18, 24 months): Pos. 90 | 73 | 41 | 18 | 5; Neg. 156 | 134 | 76 | 34 | 14
Survival table
Endpoint: PFS (panel C) and OS (panel D), hyperselection-negative vs -positive
Arm | N | Median | Median CI
Neg. hyp. (PFS) | 156 | 4.70 months | 4.20-5.7
Pos. hyp. (PFS) | 90 | 3.61 months | 3.19-4.1
Neg. hyp. (OS) | 156 | 15.0 months | 12.6-16.8
Pos. hyp. (OS) | 90 | 11.4 months | 10.3-14.2
HR: PFS 1.50; OS 1.55
HR CI: PFS 1.14-1.96; OS 1.15-2.08
P: PFS P=0.00337; OS P=0.00432
Jose Tapia@TapiaJC1
1) Trial design schema: CS2009 phase 1/2 mCRC study design (NCT06741644) — Feng Wang · 2) Safety data: CS2009 mCRC safety table — irAEs and anti-VEGF-related TRAEs (Feng Wang) · 3) Response data: CS2009 efficacy Group 1 later-line mCRC monotherapy — waterfall and spider plots
CS2009, new Tri-Specific including anti-CTLA4, showed good tolerance and reasonable disease control 93% (ORR 20%). Emerging strategy. Requires further investigation.
#ESMO26 @OncoAlert https://t.co/lmZQrQjDwW https://t.co/bedrubPDjU
[Slide 2]
Study Design
A Phase 1/2 study (NCT06741644) is ongoing to evaluate CS2009 as monotherapy or in combination with chemotherapy (XELOX or FOLFOX) in patients with metastatic colorectal cancer (mCRC) across later-line and first-line settings.
Key Eligibility Criteria
• Patients with mCRC who are previously untreated and ineligible for radical surgery or local therapy, without known MSI-H/dMMR, or those in the later-line setting with progression/intolerance to standard of care
• ECOG PS 0-1
• At least one measurable lesion
Endpoints: Safety, ORR per RECIST v1.1
Safety was assessed in all treated patients.
Efficacy was assessed in patients with at least one post-baseline tumor assessment per RECIST v1.1.
Group 1 (≥2L mCRC monotherapy) Pre-treated mCRC → CS2009 monotherapy 30 mg/kg IV Q3W
Group 2 (1L mCRC combination) Treatment-naïve mCRC → CS2009 30 mg/kg IV Q3W + XELOX up to 8 cycles, followed by CS2009 + capecitabine maintenance
Group 3 (1L mCRC combination) Treatment-naïve mCRC → CS2009 20 mg/kg IV Q2W + FOLFOX up to 12 cycles, followed by CS2009 + leucovorin and 5-FU maintenance
Treatment continued until progressive disease, unacceptable toxicity, consent withdrawal, or death
Note: Data from Group 1 and Group 2 are presented. Group 3 data remain immature due to short follow-up and are not presented.
ECOG PS: Eastern Cooperative Oncology Group performance status; IV: intravenous; L: line; FOLFOX: oxaliplatin + leucovorin + 5-FU; mCRC: metastatic colorectal cancer; MSI-H/dMMR: microsatellite instability-high/deficient mismatch repair; ORR: objective response rate; Q2W: once every 2 weeks; Q3W: once every 3 weeks; RECIST: Response Evaluation Criteria in Solid Tumors; XELOX: capecitabine + oxaliplatin.
Dr. Feng Wang
[Slide 3]
Safety
CS2009 monotherapy and in combination with chemotherapy demonstrated a favorable safety profile in mCRC
n (%) | Group 1: Later-line mCRC CS2009 Monotherapy (N=23) Any-grade* | Grade ≥3 | Group 2: First-line mCRC CS2009 + XELOX (N=23) Any-grade* | Grade ≥3
Immune-related adverse event (irAE)
Total | 6 (26.1) | 3 (13.0) | 9 (39.1) | 5 (21.7)
Adrenal insufficiency | 2 (8.7) | 0 | 0 | 0
Alanine aminotransferase increased | 1 (4.3) | 1 (4.3) | 3 (13.0) | 1 (4.3)
Amylase increased | 1 (4.3) | 1 (4.3) | 3 (13.0) | 0
Aspartate aminotransferase increased | 1 (4.3) | 1 (4.3) | 3 (13.0) | 1 (4.3)
Hyperthyroidism | 1 (4.3) | 1 (4.3) | 2 (8.7) | 0
Hypothyroidism | 1 (4.3) | 0 | 2 (8.7) | 0
Lipase increased | 0 | 0 | 4 (17.4) | 1 (4.3)
Possible anti-VEGF-related TRAE
Total | 7 (30.4) | 2 (8.7) | 4 (17.4) | 1 (4.3)
Proteinuria | 4 (17.4) | 0 | 2 (8.7) | 1 (4.3)
Epistaxis | 2 (8.7) | 0 | 0 | 0
Urinary occult blood positive | 2 (8.7) | 0 | 1 (4.3) | 0
*Any-grade irAEs and possible anti-VEGF-related TRAEs reported in ≥2 patients.
irAE: immune-related adverse event; mCRC: metastatic colorectal cancer; TRAE: treatment-related adverse event; VEGF: vascular endothelial growth factor; XELOX: capecitabine + oxaliplatin.
Dr. Feng Wang
[Slide 4]
Efficacy: Group 1 (Later-line mCRC, monotherapy)
Preliminary data demonstrated promising clinical efficacy for CS2009 monotherapy in later-line mCRC
ORR 20.0% (3/15), DCR 93.3% (14/15)
[Waterfall plot: Best change from baseline, %; legend ■ 30 mg/kg ▲ Prior Anti-angiogenic; bars labelled PD, SD, SD, SD, SD, SD, SD, SD, SD, SD, SD, SD, PR, PR, PR]
BRAF Mut.: N UK UK N UK N UK UK N N N UK UK Y UK
KRAS Mut.: Y UK Y Y UK N UK UK N N Y UK UK N UK
Liver Met.: Y Y Y Y Y N Y N Y Y N Y N N N
Location: R Rect. Rect. Rect. Rect. Rect. Rect. Rect. L Rect. L Rect. L R Rect.
Prior lines of therapy for patients achieving PR:
Patient 1: XELOX → bevacizumab + irinotecan + capecitabine
Patient 2: FOLFOX → bevacizumab + FOLFIRI → encorafenib + cetuximab
Patient 3: trilaciclib/placebo + bevacizumab + FOLFOXIRI → capecitabine + bevacizumab → trifluridine + bevacizumab
[Spider plot: Change from baseline, % vs Months; legend — 30 mg/kg; ★ First New Lesion; ▸ Treatment ongoing]
DCR: disease control rate; L: left colon; mCRC: metastatic colorectal cancer; Met.: metastasis; Mut.: mutation; N: no; ORR: objective response rate; PD: progressive disease; PR: partial response; R: right colon; Rect.: rectum; SD: stable disease; UK: unknown; Y: yes.
Dr. Feng Wang
Nieves Martinez Lago MD PhD@DraMartinezLago
1) Slide: FOG-001-101 study cohorts (zolucatetide) for desmoid tumors (Gounder, ESMO 2026) · 2) Safety data: Zolucatetide (FOG-001) safety summary TRAE table by dose · 3) Response data: Zolucatetide depth of response waterfall and duration of exposure · 4) Slide: Conclusions: zolucatetide (FOG-001) in desmoid tumors (Gounder, ESMO 2026)
#ESMO26 🧬 Zolucatetide (FOG-001) | Phase I/II
🎯 Desmoid tumors | β-catenin/TCF inhibitor
👥 76 pts | 85.5% pretreated
📈 ORR at 32 weeks: 72.2% (≥450 mg)
✅ DCR: 100%
⚠️ G≥3 TRAEs: 11.8%
💊 No discontinuations due to AEs
🚀 Promising activity, including post-GSI!
@OncoAlert
[Slide 1]
FOG-001-101 Study Cohorts for Patients with Desmoid Tumors
Dose Escalation (N=31)*
Dose Level 2 150 mg QW N=1
Dose Level 3 300 mg QW N=12
Dose Level 4 450 mg QW N=16
Dose Level 6 900 mg QW N=2
Dose Optimization (N=45)
Dose Level 4 (450 mg) QW x 2 cycles -> Dose Level 4 Q2W | N=15
Dose Level 4 (450 mg) QW x 4 cycles -> Dose Level 2 QW | N=15
Dose Level 2 (150 mg) QW x 4 cycles -> Dose Level 2 Q2W | N=15
Induction Phase | Maintenance Phase
* IV weekly in 28-day cycles
Dose optimization arms designed to evaluate Phase 3 Induction and Maintenance dose and schedule, and to satisfy Project Optimus requirement
• Induction: Achieve rapid tumor reduction
• Maintenance: Sustain antitumor benefit and optimize tolerability for chronic administration
Mrinal Gounder, MD
[Screen: 14:45 - 16:15 Proffered paper: Sarcoma; Chairs: Sebastian Bauer, Joanna Szkandera; Mrinal Gounder - A phase 1/2 trial of zolucatetide, a first-in-class direct β-catenin:TCF inhibitor: Updated safety and efficacy in patients with desmoid tumors; MALAGA AUDITORIUM - HALL 3]
[Slide 2]
Safety Summary
TRAEs in ≥20% of Study Patients
TRAEs, n (%) | 150 mg (n=16) All Grade | Grade ≥3 | 300 mg (n=12) All Grade | Grade ≥3 | 450 mg (n=46) All Grade | Grade ≥3 | 900 mg (n=2) All Grade | Grade ≥3 | All patients (N=76) All Grade | Grade ≥3
Any TRAE | 15 (93.8) | 1 (6.3) | 8 (66.7) | 0 | 44 (95.7) | 6 (13.0) | 2 (100) | 2 (100) | 69 (90.8) | 9 (11.8)
TRAEs (any grade) in ≥20% of pts
Fatigue | 7 (43.8) | 0 | 4 (33.3) | 0 | 27 (58.7) | 1 (2.2) | 2 (100) | 0 | 40 (52.6) | 1 (1.3)
Alopecia | 5 (31.3) | 0 | 1 (8.3) | 0 | 21 (45.7) | 0 | 2 (100) | 0 | 29 (38.2) | 0
Nausea | 4 (25.0) | 0 | 3 (25.0) | 0 | 21 (45.7) | 0 | 1 (50.0) | 0 | 29 (38.2) | 0
Epistaxis | 4 (25.0) | 0 | 1 (8.3) | 0 | 16 (34.8) | 0 | 0 | 0 | 21 (27.6) | 0
AST increased | 1 (6.3) | 0 | 0 | 0 | 17 (37.0) | 1 (2.2) | 2 (100) | 1 (50.0) | 20 (26.3) | 2 (2.6)
Blood bilirubin increased | 1 (6.3) | 0 | 0 | 0 | 15 (32.6) | 1 (2.2) | 2 (100) | 1 (50.0) | 18 (23.7) | 2 (2.6)
Myalgia | 3 (18.8) | 0 | 0 | 0 | 15 (32.6) | 0 | 0 | 0 | 18 (23.7) | 0
Any serious TRAE | 2 (2.6)^1
TRAE leading to discontinuation of treatment | 0
TRAEs leading to death (Grade 5) | 0
^1Events were one each of grade 1 fever and grade 2 peripheral sensory neuropathy
• Most commonly reported TRAEs are low-grade, reversible, and manageable with monitoring and supportive care
• No TRAEs resulting in treatment discontinuation or death
• No high-grade gastrointestinal or skin toxicities
• Not associated with ovarian toxicity
• Bilirubin elevations were attributable to OATP transporter inhibition and not to hepatocellular injury or cholestasis
Mrinal Gounder, MD
Data cutoff: 22-Jun-2026
AST – Aspartate aminotransferase; TRAE – Treatment-related adverse event
[Slide 3]
Zolucatetide Depth of Response and Duration of Exposure at ≥450 mg Starting Dose
Best Percent Change by RECIST 1.1 in Patients (N=46) Receiving ≥ 450 mg Starting
15 PRs | CR
SD | PR | CR
+ Prior GSI Treatment
- GSI-Naïve
Duration of Exposure in Patients (N=48*) Receiving ≥ 450 mg Starting Dose
On Treatment
Time on treatment, median (range): 4.7 (0.5-22.3) months*
Weeks on Treatment
Arrows indicate timing of landmark analyses
46 patients with a starting dose ≥ 450 mg are RECIST-evaluable (≥1 post-baseline scan)
• Disease control rate (SD+PR+CR) 100%
• No patients have discontinued treatment due to PD
• Responses seen irrespective of prior GSI exposure or CTNNB1/APC mutation type
* One patient is not efficacy evaluable due to early resection of their desmoid tumor prior to completing a post-baseline scan, without subsequent dosing. A second patient has not had a first, 8-week scan.
Mrinal Gounder, MD
Data cutoff: 22-Jun-2026
CR – complete response, DL - dose level, PD – progressive disease, PR – partial response, SD – stable disease; RECIST – Response Evaluation Criteria in Solid Tumors
[Slide 4]
Conclusions – Zolucatetide (FOG-001) in Desmoid Tumors
• Zolucatetide is a Helicon™ peptide that directly and selectively inhibits the β-catenin:TCF interaction
As of the data cut-off of June 22, 2026:
• Encouraging anti-tumor activity that deepens over time
– Responses seen in 72% and 62% of patients at 32 and 24 week landmarks, respectively, among patients treated at ≥450 mg starting dose
– Disease control rate of 100%
– Irrespective of prior exposure to gamma secretase inhibitors or mutations in CTNNB1 or APC
– No patients have discontinued treatment due to progressive disease
• Favorable safety profile, consisting mainly of low-grade and reversible AEs
– No treatment discontinuations due to AEs
• A Phase 3 registrational study of zolucatetide in desmoid tumors is planned
– 450 mg QW for 4 cycles (induction phase) followed by 300 mg Q2W (maintenance phase) selected as the recommended Phase 3 regimen
Enrollment in desmoid tumor-specific cohorts is ongoing (NCT05919264)
Mrinal Gounder, MD
Herbert Loong, MBBS, FASCO@herbloong
1) Slide: NB003-01 first-in-human phase I trial method: dose escalation and expansion cohorts · 2) Response data: NB003 waterfall: KIT mutations in baseline ctDNA vs tumour response · 3) Slide: NB003 phase I conclusions and planned phase 3 vs regorafenib (NB003-04) (Ping Chi)
#PingChi from @MSKCancerCenter presented on the #final results of FIH #NB003 trial, a potent and selective KIT inhibitor in GISTs. Broad spectrum of activity seen in different mutations. Phase 3 trial compared with #regorafenib planned.
@ctosociety @Liferaftgroup @myESMO #ESMO26 #ESMOAmbassadors
[Slide 1]
Method
NB003-01 was a global, open-label clinical trial conducted in Asia (China, South Korean), North America (United States), and Europe (France, Spain, United Kingdom).
Part 1 Dose Escalation (28-day cycle) (n=42)
Advanced GIST after disease progression (PD) on at least imatinib
Part 2 Dose Expansion (28-day cycle) (N=148)
Cohort 1 (n=56): ≥5th Line GIST, PD on at least imatinib, sunitinib, regorafenib and ripretinib
Cohort 2a (n=29): 3rd Line GIST, PD on both imatinib and sunitinib
Cohort 2b (n=35): 4th Line GIST, PD on imatinib, sunitinib and regorafenib
Cohort 3 (n=28): 2nd Line GIST, PD on imatinib
Key Objectives
Part 1: Assess safety and tolerability; determine the maximum tolerated dose (MTD) and the optimal dose of NB003.
Part 2: Assess safety and tolerability; explore efficacy across different disease stages.
The data presented are based on analysis of patients with KIT-mutant GIST in both the dose escalation and dose expansion cohorts (N=158).
Ping Chi, MD, PhD
[Slide 2]
KIT Mutations (baseline ctDNA) vs. Responses
3rd line
Max Reduction from Baseline in SoD (%)
Dose Level: 15mg 20mg
ctDNA (per patient, left to right): A502/D820; D579/W557/Y578/K642/V654/D677/K685/T670/Y823; W557; V560/V654/Y823; N567/N822; V559; W557/N822; W557/S821/Y823; N655/N822; V654; G565/V654/D820/N822; V560/V654; A502/N822; V559/D820/N822; V654; K558/D820/N822
KIT: Exon9 Exon11 Exon13 Exon14 Exon17
Responses were observed across diverse acquired KIT resistance mutations, including ATP-binding pocket (exons 13/14) and activation loop (exons 17/18) mutations.
Ping Chi, MD, PhD
ctDNA: circulating tumor DNA.
[Slide 3]
Conclusion
In KIT-mutant GIST, NB003 demonstrated encouraging antitumor effects against a broad spectrum of TKI-resistant KIT mutations and meaningful clinical benefits across later-line treatment settings.
NB003 demonstrated a manageable safety profile.
Based on the overall safety, efficacy, and pharmacokinetic data, the recommended optimal regimen of NB003 is 15 mg twice daily.
A multicenter, randomized Phase 3 trial comparing NB003 with regorafenib as third-line therapy for GIST (NB003-04, NCT07379047) is ongoing.
Ping Chi, MD, PhD
Angela Lamarca@DrAngelaLamarca
1) Trial design schema: retroSAUNA study design - continued SSA with 2L PRRT or targeted therapy · 2) Slide: retroSAUNA demographics - flowchart and baseline table by substudy (Chhajlani) · 3) Kaplan-Meier survival data: retroSAUNA TT substudy PFS - targeted therapy with vs without · 4) Kaplan-Meier survival data: retroSAUNA PRRT substudy PFS - PRRT with vs without continued SSA
#SSA beyond #progression in G1/2 NETs
Improved PFS with PRRT and targeted therapies
Caution: Retrospective study
@myESMO #ESMO26 #ESMOAmbassadors https://t.co/ePmDWChG3f
Concomitant somatostatin analog use in second-line therapy of gastroenteropancreatic neuroendocrine tumors: Survival results from the retrospective retroSAUNA study
Dr Siddharth Chhajlani et al,
Study Interpretation
• Real-world study showing that SSA continuation is done in current practice.
• The main biais is the reason to continue SSA beyond progression: driven per "centers' habits versus driven by prognostic factors?
• Prospective randomized studies are ongoing:
• STOPNET (NCT06345079) : stop SSA or not under PRRT (PEP = PFS rate at 20 months)
• SAUNA (NCT05701241) : stop SSA or not, under PRRT or targeted therapy (PEP = PFS)
• What is the quality of life of pursuing injections of SSA vs no ?
• What is the cost-effectiveness of pursuing SSA ?
• Outside of functioning NET requiring SSA or in selected cases, I will wait the results of prospective studies before pursuing SSA
[struck through:] (SSA one day, SSA for the life in metastatic non-functioning NETs !)
906eP Clinical outcomes and prognostic factors with trifluridine/tipiracil plus bevacizumab in RAS/BRAF wild-type metastatic colorectal cancer: real-world evidence from the BeTAS study
Nieves Martínez-Lago1, Iria Parajo Vazquez2, Belen de Frutos Gonzalez3, María Carmen Riesco Martinez4, Sandra López Peraita5, Borja González Gomez6, Carla Antonilli Perezz7, Ana López Alfonso8, Ana Fernández Montes9, Ismael Ghanem10, Martín Pérez Martelo1, Sara Agraso Busto2, Marcos Melian Sosa11, Elena Gallardo Martin12, Ana María Jiménez Gordo13, Luis Cabezón-Gutierrez14, Antía Cousillas Castiñeiras15, Marta Llanos Muñoz16, Maria Pilar Ochoa Rivas17, Margarita Reboredo Lopez2.
1 University Hospital & Health Research Institute (IDIS), Translational Medical Oncology Group (ONCOMET), Santiago de Compostela, Spain; 2 A Coruña University Hospital, A Coruña, Spain; 3 Ramón y Cajal University Hospital, Madrid, Spain; 4 Hospital Universitario 12 de Octubre, Madrid, Spain; 5 Hospital Universitario de Burgos, Burgos, Spain; 6 Hospital Universitario Lucus Augusti, Lugo, Spain; 7 Hospital Universitario de Gran Canaria Dr. Negrin, Las Palmas de Gran Canaria, Spain; 8 Hospital Universitario Infanta Leonor, Madrid, Spain; 9 Complejo Hospitalario Universitario de Ourense, Orense, Spain; 10 La Paz University Hospital, Madrid, Spain; 11 Instituto Valenciano de Oncología (IVO), Valencia, Spain; 12 Hospital Universitario Alvaro Cunqueiro, Vigo, Spain; 13 Hospital Universitario Infanta Sofía, Madrid, Spain; 14 Hospital Universitario De Torrejón, Madrid, Spain; Facultad de Medicina, Universidad Francisco Vitoria, Pozuelo de Alarcón, Madrid, Spain; 15 Complejo Hospitalario Universitario de Pontevedra, Pontevedra, Spain; 16 Hospital Universitario de Canarias, San Cristóbal de La Laguna, Spain; 17 Hospital Central de la Defensa Gómez Ulla, Madrid, Spain.
KEY FINDINGS
RAS/BRAF wt N = 222 Study population | 3L treatment 50.0% FTD/TPI + BEV | Prior anti-EGFR 98.3% Rechallenge 17.2% | mPFS 4.3 mo 95% CI 3.4–5.2 | mOS 10.7 mo 95% CI 8.8–12.6 | Response ORR 8.5% DCR 51.2% RECIST-evaluable n=201
BACKGROUND
▸ FTD/TPI + BEV is an established later-line treatment option in mCRC following the phase III SUNLIGHT trial.
▸ In RAS/BRAF wild-type mCRC, multiple later-line strategies may be considered, while real-world evidence specifically characterizing outcomes with FTD/TPI + BEV in this molecular subgroup remains limited.
OBJECTIVE
To evaluate real-world effectiveness and prognostic factors in patients with RAS/BRAF wild-type mCRC treated with FTD/TPI + BEV.
METHODS
Multicenter real-world BeTAS study evaluating FTD/TPI + BEV in previously treated mCRC. Eligible patients had failure or intolerance to ≥2 prior systemic regimens. Among 593 patients with known RAS/BRAF status, 222 RAS/BRAF wild-type patients, defined according to baseline tumor tissue testing, were included in this analysis. Efficacy endpoints were OS, PFS, ORR and DCR. Prognostic factors were explored using Kaplan–Meier estimates and Cox proportional hazards models.
PATIENT PROFILE – RAS/BRAF wt (N=222)
66.5 y Median age | 90.1% ECOG PS 0–1 | 80.6% Time from metastatic diagnosis ≥18 months | 70.7% <3 metastatic sites
69.8% Liver metastases | 50.0% Treated in 3L | 98.3% Anti-EGFR | 17.2% Rechallenge
Tabernero classification: BPC 18.0% | GPC 37.8% | PPC 44.2%
BPC: best prognostic category - GPC: good prognostic category - PPC: poor prognostic category
RESPONSE RATE – RECIST-EVALUABLE (n=201)
ORR 8.5% DCR 51.2%
CR 0.5% | PR 8.0% | SD 42.8% | PD 48.8%
EFFECTIVENESS
Median follow-up: 30.6 months
Progression-free survival [KM curve] mPFS 4.3 mo 95% CI 3.4–5.2
Overall survival [KM curve] mOS 10.7 mo 95% CI 8.8–12.6
EXPLORATORY MULTIVARIABLE PROGNOSTIC ANALYSIS
Independent associations with OS and PFS were explored using multivariable Cox proportional hazards models.
Variable | HR (95% CI) OS | P value | HR (95% CI) PFS | P value
ECOG PS 0–1 vs. 2 | 0.61 (0.28–1.34) | 0.218 | 0.59 (0.29–1.21) | 0.158
Tabernero classification BPC vs. GPC | 0.64 (0.43–0.96) | 0.032 | 0.68 (0.47–0.99) | 0.050
Tabernero classification BPC vs. GPC | 0.41 (0.22–0.77) | 0.006 | 0.59 (0.35–0.99) | 0.044
Prior anti-VEGF No vs. yes | 0.60 (0.36–1.02) | 0.058 | 0.69 (0.44–1.09) | 0.115
Primary prophylactic G-CSF No vs. yes | 1.44 (0.92–2.25) | 0.115 | 1.45 (0.97–2.18) | 0.070
Grade 3–4 neutropenia No vs. yes | 1.83 (1.16–2.88) | 0.009 | 1.86 (1.24–2.89) | 0.003
HRs are adjusted estimates from multivariable Cox models.
CONCLUSIONS
1 Clinically meaningful effectiveness in RAS/BRAF wt mCRC — FTD/TPI + BEV showed clinically meaningful real-world effectiveness in this molecular subgroup.
2 Supported by randomized phase III evidence — The role of FTD/TPI + BEV in later-line mCRC is supported by prospective randomized phase III evidence.
3 A robust evidence-based later-line option — These real-world findings reinforce FTD/TPI + BEV as an evidence-based option for RAS/BRAF wild-type mCRC.
In RAS/BRAF wild-type mCRC, FTD/TPI + BEV shows clinically meaningful real-world effectiveness and remains a later-line strategy supported by randomized phase III evidence.
CONTACT Nieves Martinez-Lago Nieves.Purificacion.Martinez.Lago@sergas.es X: @DraMartinezLago
ACKNOWLEDGEMENTS To the patients and their families and the BeTAS investigators.
FOLFIRI plus ramucirumab vs paclitaxel plus ramucirumab as 2L therapy for taxane-pretreated patients with mGEA–Final results of the phase III IKFs602/AIO RAMIRIS Study
#ESMO26 #ESMOAmbassadors
👉 ORR: 25 vs 23%
👉 mPFS: 5.5 vs 3.7 mo
👉 mOS: 8.7 vs 7.5 mo
🧐neg. study, but FOLFIRI + Ram appears reasonable option
@myESMO @ASCO
[Slide 2]
Co-Primary endpoints OS and ORR (ITT population)
Arm A Ram + FOLFIRI n = 158 | Arm B Ram + Pacli n = 159
Median OS (95% CI): 8.7 [7.6, 10.6] | 7.5 [6.2, 9.3]
HR (95.8% CI): 0.95 [0.74, 1.22]; P-value: 0.33
Events n (%): 139 (88%) | 137 (86%)
Median follow-up (mo): 8.2 | 6.6
Y-axis: Survival Probability; X-axis: Survival time (months)
No. at risk (0,6,12,...,60 mo):
Arm A: 158 101 46 30 12 7 5 3 2 1 1
Arm B: 159 91 45 28 16 8 4 3 2 1 0
ORR table: Arm A Ram + FOLFIRI n = 158 | Arm B Ram + Pacli n = 159 | P-value
ORR: 40 (25%) | 36 (23%) | 0.29
CR: 4 (3%) | 0 (0%)
PR: 36 (23%) | 36 (23%)
SD: 61 (39%) | 61 (38%)
PD: 33 (21%) | 46 (29%)
Missing: 24 (15%) | 16 (10%)
OS: HR from unstratified Cox proportional hazards model; p-value from unstratified log-rank test (one-sided). + Censored. The results for OSS and OR for ITT population are consistent with those for PP population.
Magdalena Scheck
Survival table
Endpoint: OS (ITT)
Arm | N | Median | Median CI
Arm A Ram + FOLFIRI | 158 | 8.7 mo | 7.6–10.6
Arm B Ram + Pacli | 159 | 7.5 mo | 6.2–9.3
HR: 0.95
HR CI: 0.74–1.22 (95.8% CI)
P: 0.33 (one-sided log-rank)
[Slide 3]
Progression-free survival
ITT Population: Arm A Ram + FOLFIRI n = 158 | Arm B Ram + Pacli n = 159
Median PFS (95% CI): 5.5 [4.0, 6.3] | 3.7 [2.9, 4.2]
HR (95.8% CI): 0.71 [0.56, 0.90]; P-value: 0.002
Events n (%): 142 (90%) | 149 (94%)
No. at risk (0,6,12,...,48 mo): Arm A: 158 63 20 5 4 1 1 1 0; Arm B: 159 43 7 3 1 0
PP Population: Arm A Ram + FOLFIRI n = 150 | Arm B Ram + Pacli n = 154
Median PFS (95% CI): 5.6 [4.1, 6.4] | 3.7 [2.9, 4.3]
HR (95.8% CI): 0.69 [0.55, 0.88]; P-value: 0.001
Events n (%): 138 (92%) | 148 (96%)
No. at risk: Arm A: 150 63 20 5 4 1 1 1 0; Arm B: 154 43 7 3 1 0
Y-axis: Probability of Progression-free Survival; X-axis: Time to progression or death (months)
Ram plus FOLFIRI resulted in a numerical improvement in PFS vs. SOC
HR from unstratified Cox proportional hazards model; p-value from unstratified log-rank test (one-sided). + Censored. SOC standard of care
Magdalena Scheck
Survival table
Endpoint: PFS (secondary; ITT)
Arm | N | Median | Median CI
Arm A Ram + FOLFIRI | 158 | 5.5 mo | 4.0–6.3
Arm B Ram + Pacli | 159 | 3.7 mo | 2.9–4.2
HR: 0.71
HR CI: 0.56–0.90 (95.8% CI)
P: 0.002 (one-sided log-rank)
[Slide 4]
Conclusion
➢ Ram plus FOLFIRI did not achieve the primary endpoints of OS or ORR in taxane-pretreated pts.
➢ OS and ORR were numerically higher in Ram plus FOLFIRI compared to Ram plus paclitaxel.
➢ PFS was clearly improved with Ram plus FOLFIRI.
➢ No new safety signals were observed. Ram plus FOLFIRI showed increased rates of all-grade gastrointestinal toxicity, but reduced rates of peripheral neuropathy.
➢ Ram plus FOLFIRI might offer a potential treatment option for patients who had received one line of prior therapy and progressed upon taxane therapy and/ or with pre-existing neuropathy.
Magdalena Scheck
Angela Lamarca@DrAngelaLamarca
1) Slide: ESMO PDAC guideline update (Annals of Oncology) text excerpt on daraxonrasib evidence by RAS · 2) Slide: ESMO guideline (Annals of Oncology, Conroy & Ducreux) Figure 1: systemic treatment algorithm
@myESMO PDAC #guidelines (update August 2026) state: “greatest strength of evidence (…) KRAS G12-mutated” - acknowledged discrepancies between authors
https://t.co/FuKVz6VFfj…
#ESMOAmbassadors #ESMO26 https://t.co/EUFyX1NwH0
[Slide 1]
regarding the use of daraxonrasib, when available, in patients with RAS-wt, RASG13-mutated or RASG61-mutated tumours. The RASolute 302 trial was not powered or stratified to answer this question.8 Unexplained discrepancies appeared in this small subgroup between a clearly significant OS benefit and a potentially detrimental effect on PFS.8 Despite being eligible, efficacy and toxicity results in these patients were not analysed in the previous studies.7,8 Further data and analyses are needed to fully inform on the tolerability and magnitude of benefit across rare subsets as well as tolerability in patients with ECOG PS 2. Currently, the greatest strength of evidence for the use of daraxonrasib is in patients with RASG12-mutated tumours with ECOG PS 0-1.
An algorithm for the management of metastatic PDAC is shown in Figure 1.
[Slide 2]
T. Conroy & M. Ducreux - Annals of Oncology
Metastatic PC
Previous (neo)adjuvant ChT and metastases <6 months after last ChT dose?
No:
- ECOG PS 0-1, bilirubin <1.5x ULN and no major comorbidities -> FOLFIRINOX [I, A; MCBS 5]b; NALIRIFOX [I, A; MCBS 2]b; or GN [I, B; MCBS 3]b
- ECOG PS 2 with KPS ≥70 and bilirubin ≤1.5x ULN -> GN [II, A; MCBS 3]b
- ECOG PS 2 with KPS <70 and/or bilirubin >1.5x ULN -> Gemcitabine [I, A]
- ECOG PS 3-4 -> Symptom-directed care [IV, A]
Second line after FOLFIRINOX/NALIRIFOX:
- ECOG PS 0-1 and RASG12 mutation [ESCAT I-A]a -> Daraxonrasib [I, A; MCBS 5]b,c
- ECOG PS 2 or no RASG12 mutation -> If FOLFIRINOX in first line:d Preferred: GP [I, B]; Alternatives: Gemcitabine [III, C]; GNe [III, C]. If NALIRIFOX in first line:f Gemcitabine-based regimen [V, C]
Second line after gemcitabine-based:
- ECOG PS 0-1 and RASG12 mutation [ESCAT I-A]a -> Daraxonrasib [I, A; MCBS 5]b,c
- ECOG PS 2 or no RASG12 mutation -> Preferred: Nanoliposomal irinotecan-5-FU-LV [I, B; MCBS 3]b,g; Alternatives: mFOLFOX6 [II, C]h; OFF [II, C]h
Yes:
- ECOG PS 0-1 and RASG12 mutation [ESCAT I-A]a -> Daraxonrasib [I, A; MCBS 5]b,c
- ECOG PS 2 or no RASG12 mutation -> Switch to another ChT regimen
Figure 1. Systemic treatment of metastatic pancreatic cancer.
Purple: algorithm title; blue: systemic anticancer therapy or their combination; white: other aspects of management and nontreatment aspects.
5-FU, 5-fluorouracil; ChT, chemotherapy; ECOG PS, Eastern Cooperative Oncology Group performance status; EMA, European Medicines Agency; ESCAT, ESMO Scale for Clinical Actionability of molecular Targets; FDA, Food and Drug Administration; FOLFIRINOX, LV-5-FU-irinotecan-oxaliplatin; GN, gemcitabine-nab-paclitaxel; GP, gemcitabine-paclitaxel; KPS, Karnofsky performance status; LV, leucovorin; MCBS, ESMO-Magnitude of Clinical Benefit Scale; mFOLFOX6, modified LV-5-FU-oxaliplatin; NALIRIFOX, liposomal irinotecan-5-FU-LV-oxaliplatin; OFF, oxaliplatin-5-FU-LV; PC, pancreatic cancer; ULN, upper limit of normal.
aESCAT scores apply to alterations from genomic-driven analyses only. These scores have been defined by the ESMO Precision Oncology and Taxonomy Committee.9
bESMO-MCBS v2.010 was used to calculate scores for new therapies/indications approved by the EMA or FDA. The scores have been calculated and validated by the ESMO-MCBS Working Group and reviewed by the authors (https://www.esmo.org/guidelines/esmo-mcbs/esmo-mcbs-evaluation-forms).
cFDA approved, not EMA approved.
dAfter FOLFIRINOX treatment, GP can be offered to patients without a RASG12-mut or with ECOG PS 2 and a favourable comorbidity profile [I, B]. Other options are gemcitabine alone [III, C] or GN [III, C; EMA and FDA approved in metastatic PC only (not advanced PC) and not approved as second-line therapy].
eEMA and FDA approved in metastatic PC only (not advanced PC).
fAfter NALIRIFOX treatment, a gemcitabine-based regimen may be offered to patients without a RASG12-mut or with ECOG PS 2 and a favourable comorbidity profile [V, C].
gOnly in patients with, or who have recovered to, ECOG PS 0-1.
hIf not given previously.
Peter Pattison@bsc_io_e
Slide: Author with ROWAN interim safety poster (1687P): Y90 glass microspheres followed by durvalumab +
Presented @ #ESMO26 | #ROWANStudy: Adverse events were consistent with the known safety profiles of #TheraSphere #Y90 and durvalumab+tremelimumab (STRIDE) #immunotherapy, supporting continued evaluation of TheraSphere in combination with immunotherapy for #livercancer. #HCC
Learn more: https://t.co/H0XpoihDij
Slide: Poster 4350P: Genetic Determinants of Cachexia-Related Phenotypes in Metastatic Pancreatic
🧬 PANTHEIA-TRANSLATIONAL at #ESMO26 with @IMDEANutricion. In metastatic #pancreaticcancer, a genetic variant of the PANTHEIA cachexia genotyping panel was associated with reduced pre-treatment weight loss. Grateful to investigators, collaborators and @_SEOM. @myESMO @OncoAlert https://t.co/rSmaM9sZyE
[Photo of two people standing in front of a poster at the ESMO 2026 poster hall; poster board numbers 4351P (left) and 4350P]
[ESMO Congress Madrid 2026 logo] 4350P: Genetic Determinants of Cachexia-Related Phenotypes in Metastatic Pancreatic Cancer: PANTHEIA-SEOM Translational Study
Vilma Pacheco-Barcia1, Andrea Ochaita Aguado2, Andrés J. Muñoz Martín3, Cristina Fernández Díaz2, Axel Mariño-Méndez4, María Ángeles Vicente Conesa5, Paula Cerdà Serdà6, María de Toro Carmena7, Jorge Hernando8, Jorge Adeva9, Silvia Cruz Gil2, Marta Gómez de Cedrón2, Alberto Carmona-Bayonas5, Ricardo Ramos Ruiz2, Paula Jiménez-Fonseca10, Lara Fernández2, Enrique Grande11, Ana Ramírez de Molina2. 1Hospital Universitario La Luz, Madrid, Spain. 2IMDEA Nutrition Institute, Madrid, Spain. 3Hospital General Universitario Gregorio Marañón, Madrid, Spain. 4Hospital Clínic de Barcelona, Barcelona, Spain. 5Hospital Universitario Morales Meseguer, Murcia, Spain. 6Hospital Universitario de la Santa Creu i Sant Pau. 7Hospital Universitario La Princesa, Madrid, Spain. 8Hospital Universitario de Vall d'Hebron, Barcelona, Spain. 9Hospital Universitario 12 de Octubre, Madrid, Spain. 10Hospital U. Central de Asturias, Oviedo, Spain. 11Hospital U. Quirónsalud Pozuelo.
BACKGROUND
[partially obscured by people] ...ancer cachexia affects most patients with metastatic pancreatic ...ancer and drives functional decline and mortality, yet its inherited determ[illegible] unknown. We explored whether germli[illegible] related to cachexia, ...arcopenia, [illegible] ...diture are associated with weigh[illegible]
MET[HODS] [obscured]
RESULTS
[Figure: A. Weight loss by genotype (GG n=9, GT n=22, TT n=8; genotype, variant near KLF5); B. Association of the T allele across phenotypes - cachexia/weight-loss phenotypes vs body weight/mass; small text illegible]
Figure 2. (A) Percentage weight loss from usual weight to the start of chemotherapy by genotype of the variant near KLF5. (B) Standardized effect of each T allele (95% CI) across phenotypes, ordered from cachexia/weight-loss phenotypes (purple) to body [w]eight/mass (blue). Regression adjusted for sex and age; * significant after Bonferroni correction.
[Figure 3: Manhattan-style plot of associations across cachexia/weight-loss related phenotypes and body weight/mass; labels KLF5 (near), TRIB2, ACVR1B, MTHFR, BMP4; small text illegible]
[...]ciations of the 26 variants (one colour per gene) with 16 phenotypes, ordered from cachexia/weight-loss related [p]urple background) to body weight/mass (blue background). Each dot is the −log10 P of an additive model adjusted [...]; dashed line, Bonferroni threshold (P = 0.05/26); dotted line, P = 0.05. Clinician-reported cachexia (yes/no; 4 [...]ed with Firth logistic regression.
Weight loss
• Each T allele of the variant near KLF5 was associated with 5.0 percentage points less weight loss (95% CI −7.6 to −2.4; P = 0.0004; Bonferroni P = 0.010), the only association surviving correction for multiple testing.
• Median weight loss was 9.8% in GG, 7.9% in GT and 4.1% in TT carriers; cachexia† was present in 8/9 (89%), 16/22 (73%) and 1/8 (13%), respectively (OR per T allele 0.09; 95% CI 0.02–0.47; P = 0.004). Clinician-reported cachexia (4 cases) showed the same direction (OR 0.12; 95% CI 0.01–0.73; P = 0.019; Firth regression).
• The effect was robust to clinical adjustment, centre, exclusion of non-European patients, permutation (family-wise P = 0.007) and bootstrap resampling (variant selected in 89% of resamples; effect range −4.7 to −6.3 points).
• The association was specific to weight loss: there was no association with usual (pre-illness) body weight or BMI (P = 0.40 and P = 0.74; Figure 2B).
• A variant in MTHFR was associated with higher pre-chemotherapy BMI (+3.8 kg/m² per G allele; Bonferroni P = 0.028), largely reflecting higher usual BMI rather than less weight loss.
• Across all 416 tests (26 variants × 16 phenotypes), 25 were nominally significant (20.8 expected by chance); only the KLF5-near variant association with weight loss and the MTHFR associations with pre-chemotherapy weight and BMI passed Bonferroni correction (Figure 3).
CONCLUSIONS
• The T allele of a variant near KLF5, previously linked to lean mass, is associated with less pre-treatment weight loss and less cachexia in metastatic pancreatic cancer, independently of prior body size.
• These preliminary findings require replication in a larger, independent cohort.
Acknowledgments: Gratitude to the PANTHEIA study researchers, SEOM's Clinical Practice and Outcome Evaluation Section and PANDORA-SEOM.
Author COIs: [small text, partially legible: speaker honoraria from Pierre Fabre, Nutricia, Servier, Pfizer, AstraZeneca, Leo Pharma; consultancy or advisory board from Advanced Accelerator Applications, a Novartis company, Pfizer, Nutricia, Servier; travel support from Amgen, Servier, Pfizer, Nutricia, Merck.]
Funding: [small text, partially legible: Regional Government of the Community of Madrid, Government of Spain, European Council of Innovation; SEOM Grant 2024. Pfizer grant 2022. Nutricia and Servier research funding without restrictions.]
Author contact: [email address, small text]
[Badge on presenter: Vilma Pacheco-Barcia, ESMO Member, ESMO Officer, Invited Speaker]
Herbert Loong, MBBS, FASCO@herbloong
1) Trial design schema: Peak phase 3 GIST trial design · 2) Response data: Peak crossover: ORR with bezuclastinib+sunitinib after sunitinib · 3) Slide: Peak crossover safety table: bezuclastinib+sunitinib vs sunitinib vs crossover · 4) Slide: Peak crossover conclusions: earlier bezuclastinib+sunitinib combination after
@RobinL_Jones presented the #Phase3 #Peak crossover: Bezuclastinib + sunitinib combination following sunitinib monotherapy in patients with GIST. Improved ORR (20.3 vs. 29.7%) and duration of response (5.7 vs 7.4m) in pts who were crossed over from #sunitinib to #bez+sunitinib.
#GIST #sarcoma #ESMO26 @myesmo @ctosociety #ESMOAmbassadors
[Slide 1]
Peak (NCT05208047) Is a Global, Randomized, Open-Label, Phase 3 Trial
This analysis evaluated patients in Peak who crossed over to receive bezuclastinib + sunitinib combination after progressing on sunitinib monotherapy
Patients 1:1 Randomized
Bezuclastinib 600 mg QD + Sunitinib 37.5 mg QD (n=204)
Sunitinib 37.5 mg QD (n = 209)
EOT/BICR confirmed PD
Crossover Bezuclastinib 600 mg QD + Sunitinib 37.5 mg QD (n = 128)
EoT/BICR confirmed PD
Crossover evaluation
PFS
ORR
Safety
30-Day Safety and Post-Treatment Follow-up
BICR, Blinded Independent Central Review; EoT, end of treatment; ORR, objective response rate; PD, disease progression; PFS, progression-free survival; QD, once daily
Data cutoff: Sep 30, 2025
[Slide 2]
Patients Had Improved Response Rate With Crossover Therapy Compared With Sunitinib Monotherapy
In patients who crossed over to combination therapy:
ORR to 2nd-line sunitinib was 20.3% (95% CI: 13.7%-28.3%) (n=26)
ORR to subsequent combination therapy was 29.7% (95% CI: 21.9%-38.4%) (n=38)
80% (n=102) of patients entering the crossover had not achieved an objective response on sunitinib monotherapy (best response of SD or PD)
In patients with best response of disease progression on sunitinib, ORR was 56% with combination
2 patients with PD on monotherapy achieved a CR on combination
Sunitinib 37.5 mg QD (n = 209)
Crossover Bezuclastinib 600 mg QD + Sunitinib 37.5 mg QD (n = 128)
CR, complete response; ORR, objective response rate; PD, progressive disease; QD, once daily; SD, stable disease.
Data cutoff: Sep 30, 2025
[Slide 3]
Safety During Crossover Was Consistent With the Pivotal Peak Trial
| Bezuclastinib + Sunitinib (n=204) | Sunitinib (n=208)a | Sunitinib → Combination Crossover (n=128)
Median treatment duration, weeks (range) | 61.4 (1.4-150.0) | 42.4 (2.0-152.0) | 23.9 (1.0-114.7)
TEAEs, n (%) | 204 (100) | 207 (99.5) | 125 (97.7)
TRAEs, n (%) | 202 (99.0) | 204 (98.1) | 121 (94.5)
Gr3+ TRAEs, n (%) | 146 (71.6) | 109 (52.4) | 50 (39.1)
Bezuclastinib related Gr3+ | 126 (61.8) | N/A | 46 (35.9)
Sunitinib related Gr3+ | 141 (69.1) | 109 (52.4) | 45 (35.2)
SARs, n (%) | 34 (16.7) | 24 (11.5) | 15 (11.7)
Bezuclastinib related SAEs | 25 (12.3) | N/A | 10 (7.8)
Sunitinib related SAEs | 31 (15.2) | 24 (11.5) | 14 (10.9)
TRAEs leading to death, n (%) | 0 | 1 (0.5) | 0
Reductions of either drug due to TRAEs, n (%) | 114 (55.9) | 92 (44.2) | 33 (25.8)
DC of study treatment due to TRAEs, n (%) | 15 (7.4) | 8 (3.8) | 3 (2.3)
The incidence of TEAEs & TRAEs was similar between bezuclastinib + sunitinib combination & combination crossover
No TRAEs leading to death in patients on bezuclastinib + sunitinib combination & combination crossover
The only TRAEs leading to discontinuation in >1 patient were neutropenia (2.9%), increased ALT/AST (1.5%), & diarrhea (1.0%) in the combination arm,& diarrhea (1.6%) in the combination crossover arm
aOne patient randomized to sunitinib but never dosed.
ALT, alanine aminotransferase; AST, aspartate aminotransferase; DC, discontinuation; Gr, grade; N/A, not applicable; SAE, serious adverse event; SAR, serious adverse reaction; TEAE, treatment-emergent adverse event; TRAE, treatment-related adverse event.
Data cutoff: Sep 30, 2025
[Slide 4]
Conclusion: Following Imatinib Treatment, the Majority of Patients Would Derive Improved Disease Control With Earlier Combination Therapy
2nd-line combination treatment resulted in mPFS of 16.5 months (vs 9.2 months with 2nd line sunitinib)
– Durability of benefit from early combination treatment was also observed with PFS2 results: median was not reached with combination vs median of 21.0 months with sunitinib alone (HR=0.57)
71% (148/209) of patients had disease progression on 2nd line sunitinib as of data cut. 128 patients crossed over from 2nd line sunitinib to combination.
Disease control & response rate were both improved with crossover therapy vs. sunitinib monotherapy; results were also favorable in comparison to 3rd line approved agents
– mPFS was 5.7 months with 2nd line sunitinib & 7.4 months with subsequent combination therapy
– ORR was 20.3% with 2nd line sunitinib & 29.7% with subsequent combination therapy
– In patients with best response of disease progression on sunitinib, ORR was 56% with subsequent combination therapy
Safety observations in combination crossover patients were consistent with bezuclastinib + sunitinib combination in the pivotal portion of the trial
HR, hazard ratio; mPFS, median progression-free survival; ORR, objective response rate; PFS2, progression-free survival 2.
Data cutoff: Sep 30, 2025
Vilma P. Barcia MD, PhD, MSc@DrVilmaPBarcia
1) Slide: 4212RO title slide: GETNE-T2216 / CABOTHYROID trial (Hernando) · 2) Biomarker data: CABOTHYROID: Biomarker analysis — methylation patterns responders · 3) Response data: CABOTHYROID: Efficacy — full analysis set · 4) Slide: CABOTHYROID: Efficacy — univariate PFS and OS Cox forest plots
👏 Huge congratulations to my friend @JHernando3 on presenting the GETNE-T2216/CABOTHYROID trial at #ESMO26!
Promising results with cabozantinib in advanced thyroid cancer: ORR 24%, DCR 89.7% and median PFS 16.1 months.
Great work by @GrupoGetne 🇪🇸! @Ja_Capdevila @OncoAlert https://t.co/swUFXSDfjF
833P Outcomes with trifluridine/tipiracil plus bevacizumab across age groups in metastatic colorectal cancer: real-world evidence from the BeTAS study
Nieves Martínez-Lago(1), Iria Parajo Vazquez(2), Belen de Frutos Gonzalez(3), María Carmen Riesco Martinez(4), Sandra López Peraita(5), Borja González Gómez(6), Carla Antonilli Perez(7), Ana López Alfonso(8), Ana Fernández Montes(9), Ismael Ghanem(10), Martín Pérez Martelo(1), Sara Agraso Busto(2), Marcos Melian Sosa(11), Elena Gallardo Martin(12), Ana María Jiménez Gordo(13), Luis Cabezón-Gutiérrez(14), Antía Cousillas Castiñeiras(15), Marta Llanos Muñoz(16), Maria Pilar Ochoa Rivas(17), Margarita Reboredo Lopez(2).
[Affiliations: Spanish hospitals - small print, partially legible]
KEY FINDINGS
Study population N = 593 Previously treated mCRC
>75 years 156 (26.3%)
mPFS 3.7 | 4.2 | 5.1 mo (<50 | 50-75 | >75) p=0.113
mOS 11.5 | 9.9 | 11.2 mo (<50 | 50-75 | >75) p=0.944
Response ORR 2.4 | 7.3 | 16.3; DCR 52.4 | 48.2 | 58.9 (<50 | 50-75 | >75)
G3-4 neutropenia 31.8 | 32.8 | 37.8% (<50 | 50-75 | >75) p=0.458
BACKGROUND + OBJECTIVE
BACKGROUND
- FTD/TPI + BEV is an established later-line treatment option in mCRC following the phase III SUNLIGHT trial.
- Older patients remain underrepresented in randomized trials, and real-world evidence on outcomes across age groups remains limited.
OBJECTIVE
To evaluate effectiveness, safety, and prognostic factors across age subgroups (<50, 50-75, and >75 years) in patients with mCRC treated with FTD/TPI + BEV in routine clinical practice.
PATIENT PROFILE - AGE DISTRIBUTION
<50 years n=44 7.4% | 50-75 years n=393 66.3% | >75 years n=156 26.3%
Clinicopathological characteristics, % | <50 (n) | 50-75 (n) | >75 (n)
ECOG PS 2 | 2.3 | 8.9 | 14.7
<18 months from metastatic diagnosis | 45.4 | 27.2 | 35.3
Liver metastases | 59.1 | 67.4 | 71.1
>=3 metastatic sites | 43.2 | 31.3 | 23.1
Tabernero classification, %
Best (BPC) | 13.6 | 19.3 | 15.4
Good (GPC) | 20.5 | 30.5 | 32.7
Poor (PPC) | 65.9 | 50.2 | 51.9
EFFECTIVENESS
Median follow-up: 30.6 months
PFS / OS Kaplan-Meier by age subgroup (<50, 50-75, >75)
mPFS 4.3 mo 95% CI 3.8-4.8
mOS 10.7 mo 95% CI 9.7-11.6
SAFETY
No significant differences in grade 3-4 TRAEs across age groups.
Grade 3-4 TRAEs, % | <50 (n) | 50-75 (n) | >75 (n) | p value
Neutropenia | 31.8 | 32.8 | 37.8 | 0.458
Anemia | 4.5 | 4.6 | 3.2 | 0.740
Asthenia | 2.3 | 4.3 | 4.5 | 0.531
Diarrhea | 0.0 | 3.6 | 0.6 | 0.286
Thrombocytopenia | 2.3 | 1.5 | 1.3 | 0.069
Bleeding | 0.0 | 1.8 | 1.3 | 0.203
Hepatic toxicity (AST/ALT increase) | 0.0 | 1.8 | 1.3 | 0.800
Hypertension | 0.0 | 0.8 | 1.3 | 0.888
Mucositis | 0.0 | 0.5 | 0.6 | 0.598
METHODS
Multicenter real-world BeTAS study evaluating FTD/TPI + BEV in previously treated mCRC. Eligible patients had failure or intolerance to >=2 prior systemic regimens. A total of 593 patients treated between July 2019 and February 2026 were included into three age groups: <50 years (n=44), 50-75 years (n=393), and >75 years (n=156). Efficacy endpoints were OS, PFS, ORR and DCR; safety was assessed through grade 3-4 treatment-related adverse events (TRAEs). Outcomes across age groups were evaluated using Kaplan-Meier estimates, log-rank tests and multivariable Cox proportional hazards models.
RESPONSE RATE - RECIST-EVALUABLE PATIENTS
RECIST-evaluable: <50 n=42; 50-75 n=359; >75 n=141
<50 (n=42) | CR 0.0 | PR 2.4 | SD 50.0 | PD 47.6
50-75 (n=359) | CR 0.6 | PR 6.7 | SD 40.9 | PD 51.8
>75 (n=141) | CR 0.7 | PR 15.6 | SD 42.6 | PD 41.1
| ORR, % | DCR, %
<50 | 2.4 | 52.4
50-75 | 7.3 | 48.2
>75 | 16.3 | 58.9
EXPLORATORY MULTIVARIABLE PROGNOSTIC ANALYSIS
Age was not independently associated with OS or PFS.
Variable | OS HR (95% CI) | p value | PFS HR (95% CI) | p value
Age >50 vs >75 | 1.03 (0.62-1.69) | 0.857 | 1.24 (0.82-1.83) | 0.302
Age 50-75 vs >75 | 0.92 (0.62-1.39) | 0.697 | 1.01 (0.74-1.53) | 0.982
ECOG PS 2 vs 0 | 1.69 (1.02-2.40) | 0.003 | 0.89 (1.03-1.69) | 0.049
Tabernero BPC vs GPC | 0.62 (0.32-0.91) | 0.001 | 0.71 (0.58-0.69) | 0.046
Tabernero BPC vs PPC | 0.41 (0.24-0.69) | <0.001 | 0.33 (0.24-0.45) | <0.001
Prior anti-VEGF vs others | 0.84 (0.62-1.14) | 0.269 | 1.05 (0.78-1.40) | 0.681
Primary prophylactic GCSF vs ches | 0.90 (0.72-1.14) | 0.401 | 0.81 (0.67-0.99) | 0.042
>=3 metastatic sites vs <3 sites | 1.72 (1.33-2.24) | <0.001 | 1.79 (1.36-2.32) | <0.001
CONCLUSIONS
1 Effectiveness across age groups: No significant differences in PFS or OS were observed across age groups in this real-world patient population.
2 Consistent safety profile: No significant differences in grade 3-4 treatment-related adverse events were observed across age groups.
3 Age was not independently prognostic: Despite a higher prevalence of ECOG PS 2 in older patients, age was not independently associated with OS or PFS.
CONTACT Nieves Martinez Lago Nieves.Purificacion.MartinezLago@sergas.es
ACKNOWLEDGEMENTS We thank all patients, their families, and the BeTAS investigators.
FTD/TPI + BEV in metastatic colorectal cancer: real-world evidence from the BeTAS study | 833P | ESMO Congress 2026 | Madrid, Spain (23-27 October 2026)
Angela Lamarca@DrAngelaLamarca
1) Biomarker data: Best Poster 460P: clinical validity of ctDNA-RECIST in advanced biliary tract · 2) Biomarker data: Poster 460P: clinical validity of ctDNA-RECIST (HOXA9 methylation) in advanced
Congrats to the @myESMO #ESMO26 #BestPoster award winner for the #BiliaryTumours track
🩸ctDNA aberrant methylation for early assessment of response
🔮Academic randomised trial ongoing, with biliary cohort being coming soon
👏🏻Congrats to the team from Denmark
#ESMOAmbassadors https://t.co/ZDiuq1IcUY
[Slide 1]
Clinical validity of the ctDNA response evaluation criteria (ctDNA-RECIST) in patients with advanced biliary tract cancer
Karen-Lise G. Spindler1,2, Louise B. Callesen1,2, Julia S. Johansen3, Alice Markussen3, Rikke F. Andersen4, Troels D. Christensen3
Circulating tumour DNA – ctDNA-RECIST Response Evaluation Criteria in Solid Tumours
INTRODUCTION
• Imaging can be complex in biliary tract cancers (BTC) and RECIST 1.1 response is a suboptimal surrogate marker for overall survival (OS)
• Circulating tumor DNA (ctDNA) measurement is known to hold a strong correlation to response and survival endpoints
• We have presented criteria for early ctDNA response evaluations (ctDNA-RECIST) based on digital droplet PCR (ddPCR) analysis of ctDNA
• The tumor agnostic ctDNA aberrant methylation (AM) marker is a feasible pragmatic ctDNA approach for clinical implementation
AIMS
To demonstrate the clinical validity of the ctDNA HOXA 9 analysis in patients with advanced biliary tract cancer (BTC)
To validate the ctDNA-RECIST criteria for future prospective studies
METHODS
• Participants: This study included 238 patients with advanced BTC from 4 clinical studies: NCT 01247337, NCT 05184400, EudraCT 2013-001559-11, 2013-004854-46 previously published.
• Blood samples were drawn in EDTA tubes prior to the first cycle (baseline), prior to the second cycle and at the first imaging evaluation (Figure 1).
• ctDNA analysis: Four mL plasma was analyzed for aberrant methylation of HOXA9 by ddPCR, and 5 droplets defined positivity (Figure 1).
• ctDNA response classification was done according to ctDNA-RECIST (Table 1, Figure 2). (DC=PR+SD)
• Statistical analysis included descriptive analysis and Kaplan-Meier statistics with log rank tests.
RESULTS: BASELINE [partly obscured by rosette]
Overall median OS was 12 months
Baseline ctDNA detection rate - 85%
Figure 4. Baseline ctDNA levels were significantly associated with location of the primary tumor, disease stage, liver involvement, and poor ECOG PS.
Figure 5. Kaplan-Meier estimates of OS according to baseline ctDNA detection.
Baseline ctDNA detection was associated with shorter OS (18.6 months versus 11.0 months (HR 1.79 95% CI 1.24-2.61 ).
RESULTS: ctDNA-RECIST OUTCOMEs
Early ctDNA evaluation classified ctDNA[obscured] ctDNA-DC (122/134-91.0%), and ctDNA[obscured]
CONCLUSION
This study confirms the clinical validity of ctDNA aberrant m[obscured] ctDNA-RECIST criteria in patients with metastatic BTC[obscured]
BEST POSTER
460P
[Slide 2]
Clinical validity of the ctDNA response evaluation criteria (ctDNA-RECIST) in patients with advanced biliary tract cancer
Karen-Lise G. Spindler1,2, Louise B. Callesen1,2, Julia S. Johansen3, Alice Markussen3, Rikke F. Andersen4, Troels D. Christensen3
Circulating tumour DNA – ctDNA-RECIST Response Evaluation Criteria in Solid Tumours
INTRODUCTION
• Imaging can be complex in biliary tract cancers (BTC) and RECIST 1.1 response is a suboptimal surrogate marker for overall survival (OS)
• Circulating tumor DNA (ctDNA) measurement is known to hold a strong correlation to response and survival endpoints
• We have presented criteria for early ctDNA response evaluations (ctDNA-RECIST) based on digital droplet PCR (ddPCR) analysis of ctDNA
• The tumor agnostic ctDNA aberrant methylation (AM) marker is a feasible pragmatic ctDNA approach for clinical implementation
AIMS
To demonstrate the clinical validity of the ctDNA HOXA 9 analysis in patients with advanced biliary tract cancer (BTC)
To validate the ctDNA-RECIST criteria for future prospective studies
METHODS
• Participants: This study included 238 patients with advanced BTC from 4 clinical studies: NCT 01247337, NCT 05184400, EudraCT 2013-001559-11, 2013-004854-46 previously published.
• Blood samples were drawn in EDTA tubes prior to the first cycle (baseline), prior to the second cycle and at the first imaging evaluation (Figure 1).
• ctDNA analysis: Four mL plasma was analyzed for aberrant methylation of HOXA9 by ddPCR, and 5 droplets defined positivity (Figure 1).
• ctDNA response classification was done according to ctDNA-RECIST (Table 1, Figure 2). (DC=PR+SD)
• Statistical analysis included descriptive analysis and Kaplan-Meier statistics with log rank tests.
Table 1 * ctDNA-RECIST definitions
ctDNA PD: progressive disease. ctDNA increase above the previous/lowest value with no overlap of CI's | ctDNA PD
ctDNA PR: partial response. ctDNA decrease below the previous value with no overlap of the two CI's but the lower CI does not overlap 0 | ctDNA DC: disease control. Partial response and stable disease can be combined and classified as disease control
ctDNA SD: stable disease. ctDNA value with a CI overlapping the CI of the previous value.
ctDNA NCR: near complete response. ctDNA decrease below the previous value with no overlap of the two CI's and with the lower CI overlapping 0. | ctDNA MR: maximal response. Complete and near complete response can be combined and classified as maximal responders
CR: complete response. ctDNA decrease to an undetectable level.
RESULTS: BASELINE FINDINGS
Overall median OS was 12 months
Baseline ctDNA detection rate - 85%
Figure 4. Baseline ctDNA levels were significantly associated with location of the primary tumor, disease stage, liver involvement, and poor ECOG PS.
Figure 5. Kaplan–Meier estimates of OS according to baseline ctDNA detection.
Baseline ctDNA detection was associated with shorter OS (18.6 months versus 11.0 months (HR 1.79 95% CI 1.24-2.61 ).
RESULTS: ctDNA-RECIST OUTCOMEs
Early ctDNA evaluation classified ctDNA-PD (N=1/134-0.7%), ctDNA-DC (122/134-91.0%), and ctDNA-MR (11/134-8.2%).
Figure 8. Kaplan–Meier estimates of OS according to ctDNA response:
Patients with early ctDNA-MR had longer median OS (15.9 mo), compared to patients with ctDNA-DC (8.9 mo, HR 2.1 95%CI 1.07-4.20, p=0.031).
The same applied for PFS (10.0 and 5.9 mo, HR 1.58 95% CI 0.83-3.03, p = 0.16).
CONCLUSION
This study confirms the clinical validity of ctDNA aberrant methylation of HOXA9 and the potential utility of our ctDNA-RECIST criteria in patients with metastatic BTC, which could be used in prospective studies.
Funding: This work has been supported by grants from Danish Cancer Society, Novo Nordisk Foundation, Health Research Foundation of Central Denmark Region and Kirsten and Freddy Johansen Foundation
FPN: 460P
ESMO 2026
Angela Lamarca@DrAngelaLamarca
Slide: Poster 478P: early postoperative recurrence and KRAS/MAPK phenotype in cholangiocarcinoma
And in second place…. @tisseranatalia_
She is evaluating patterns associated with very early relapse in #BiliaryMalignancies
KRAS seems to be involved
Very interesting hypothesis that she is developing further
@myESMO #ESMO26 #ESMOAmbassadors https://t.co/ACDU255XbK
Early postoperative recurrence identifies a biologically aggressive KRAS/MAPK-enriched phenotype in cholangiocarcinoma
Natalia S. Tissera 1,2, Andrea Casadei-Gardini 3, Virginia Genovesi 4,5, Anthony Turpin 6, Caterina Vivaldi 4,5, Cristina Dopazo 7, Maria Teresa Salcedo 8, Francesca Ratti 9, Silvia Buonanno 9, Remo Alessandris 9,10, Viviane Gnemmi 11, Emmanuel Boleslawski 12, Sharela Vega 1, Sergio Pérez-Fernandez 1, Ana Vivancos 13, Alejandro García 1, Jorge Hernando 1, Jaume Capdevila 1, Tian Tian 14,15, Teresa Macarulla 14,15
ESMO 2026 478P
BACKGROUND
Early recurrence (ER) after curative-intent resection for cholangiocarcinoma (CCA) is frequent and associated with poor prognosis; however, its molecular determinants remain unclear.
Objective: To evaluate clinicopathologic and molecular features of ER.
METHODS
Multicenter and retrospective study (2001–2025)
4 European centers
• Curative-intent CCA resections
• Excluded metastatic disease, neoadjuvant treatment, mixed HCC-CCA and 90-day mortality
• Recurrence groups: <12, 12–<36 and ≥36 months/no recurrence
• Analyses used Kaplan-Meier and Cox models.
RECURRENCE GROUPS
ANALYTIC COHORT: 289 PATIENTS
G1 <12 months 162 (56.1%)
G2 12–<36 months 79 (27.3%)
G3* Late recurrence ≥36 mo / no recurrence with ≥36 mo f-up 48 (16.6%)
SURVIVAL OUTCOMES
Median follow-up: 61.8 months (95% CI 48.6–85.0)
Disease-free survival Median 10.8 months (95% CI 9.5–12.0)
Overall survival Median 36.5 months (95% CI 30.9–42.0)
OVERALL SURVIVAL BY RECURRENCE GROUP
12-month landmark sensitivity analysis: Recurrence ≤12 months was associated with subsequent mortality: adjusted HR 2.50 (95% CI 1.66–3.78), p<0.001.
Median OS: G1 24.2, G2 38.8, G3 119.5 months
Log-rank p<0.001
FIRST RECURRENCE ANATOMY
Evaluable distant-component recurrences (n=161)
Liver only / Lung only
G1 40/94 (43%) | 4/94 (4%)
G2 19/49 (39%) | 4/49 (8%)
G3a 5/18 (28%) | 4/18 (22%)
CONCLUSION
ER identifies a clinically and biologically aggressive CCA phenotype with nominal KRAS/MAPK enrichment, [obscured]
Deborah Mukherji@dmukherji
Slide: Miriam Merad leadership talk slide: breaking medical silos / Immunology Institute
“Identify the gap you can fill — in science or leadership — and have the courage to step into it.”
An inspiring message from @MiriamMerad on embracing risk, doubt and opportunity to lead.
#ESMO26 #WomenInOncology #Leadership @myESMO @OncoAlert https://t.co/rhr8tzzBOT
Taking the leadership of the Immunology Institute and breaking medical siloes
○ Medical training is based on organs
○ Immune system is the same across organs
○ Pathophysiology likely shared by many organs
○ Macrophages respond to injuries cues (many shared across diseases)
○ Focus on mechanism-based pathophysiology rather than organ-specific approaches
[Image: silos labelled Cancer, Skin, Heart, Brain, Gut, Joints — BREAKING MEDICAL SILOS]
Mapping Immune programs across diseases
Accelerate knowledge
Cardiology | Rheumatology | Oncology | Dermatology | Gastroenterology | Neurology
Nieves Martinez Lago MD PhD@DraMartinezLago
1) Kaplan-Meier survival data: Journal figure: OS and PFS Kaplan-Meier curves for 45 · 2) Kaplan-Meier survival data: Journal figure: OS Kaplan-Meier curves by GIPI risk · 3) Kaplan-Meier survival data: Journal figure: OS Kaplan-Meier curves by GRIm score
🇪🇸 After the #ESMO26 whirlwind… our latest @Grupo_GITUD publication!
🧬 Galician RWE | 45 ESCC pts | 2L nivolumab
🎯 ORR 17.8% | mOS 9.7 mo
🔬 GIPI & GRIm associated with OS in adjusted analyses
💡 Promising prognostic tools requiring validation!
🔗 https://t.co/1eCyoHtxmR
@OncoAlert
[Slide 1]
A
Survival Function
Censored
Survival probability (%)
OS (Months)
Number at risk
All patients 45 27 20 13 6 2 1
B
PFS (Months)
Number at risk
All patients 45 12 8 6 3 1 1
Fig. 1 Kaplan–Meier survival estimates in the overall cohort. (A) Overall survival (OS), defined as the time from nivolumab initiation to death from any cause. (B) Progression-free survival (PFS), defined as the time from nivolumab initiation to disease progression or death, whichever occurred first. Vertical tick marks indicate censored observations.
Survival table
Endpoint: OS and PFS (overall cohort)
All patients | 45
[Slide 2]
GIPI Score
Good
Intermediate
Poor
Good-censored
Intermediate-censored
Poor-censored
Survival probability (%)
OS (Months)
Number at risk
Good (0) 19 15 12 8 3 2 1
Intermediate (1) 17 8 5 2 1 0 0
Poor (2) 7 3 2 2 2 0 0
Fig. 2 Kaplan–Meier curves for OS according to GIPI risk category. Patients were classified as good-risk, intermediate-risk, or poor-risk according to the Gastrointestinal Immune Prognostic Index. The number of patients included in each subgroup is reported in Table 5. Given the small size of the poor-risk subgroup, estimates should be interpreted cautiously. The intermediate- and poor-risk curves crossed during late follow-up, when few patients remained at risk. Survival distributions were estimated using the Kaplan–Meier method and compared using the log-rank test. GIPI, Gastrointestinal Immune Prognostic Index; OS, overall survival.
Survival table
Endpoint: OS by GIPI score
Good (0) | 19
Intermediate (1) | 17
Poor (2) | 7
[Slide 3]
GRIm Score
Low Risk
High Risk
Low Risk-censored
High Risk-censored
Survival probability (%)
OS (Months)
Number at risk
Low risk (0) 39 26 19 12 6 2 1
High risk (1) 4 0 0 0 0 0 0
Fig. 3 Kaplan–Meier curves for OS according to GRIm score. Patients were classified as low-risk or high-risk according to the Gustave Roussy Immune Score. The number of patients included in each subgroup is reported in Table 5. Given the small size of the high-risk subgroup, estimates should be interpreted cautiously. Survival distributions were estimated using the Kaplan–Meier method and compared using the log-rank test. GRIm, Gustave Roussy Immune Score; OS, overall survival.
Survival table
Endpoint: OS by GRIm score
Low risk (0) | 39
High risk (1) | 4
Arndt Vogel@ArndtVogel
1) Trial design schema: Design of ARION UCGI 33/PRODIGE 67 randomized phase 2 trial · 2) Kaplan-Meier survival data: ARION/PRODIGE 67 Survival: centrally reviewed PFS and OS KM curves · 3) Slide: ARION/PRODIGE 67: Tolerance and quality of life - Anouchka Modesto · 4) Slide: ARION/PRODIGE 67: Conclusion - Anouchka Modesto
ARION PRODIGE 67 phs 2 trial: Durvalumab plus definitive chemoradiotherapy vs definitive chemoradiotherapy in patients with locally advanced esophagus carcinoma
#ESMO26 #ESMOAmbassadors
👉 ORR: xx vs xx%
👉 1yr-PFS: 50.5 vs 48.9%
👉 1yr-OS: 75 vs 67%
🧐No benefit for addition of Durva
@myESMO @ASCO
[Slide 1]
Design of ARION UCGI 33/PRODIGE 67 Randomized phase 2 trial (NCT03777813)
✓ Eligible patients :
✓ LA non-metastatic biopsy-proven squamous cell carcinoma or adenocarcinoma of the esophagus
✓ ≥18 years old,
✓ WHO performance status ≤1,
✓ Treatment Arms :
✓ Standard Arm : SoC = Chemoradiotherapy (CRT) : RT 50 Gy + 6 FOLFOX q2w
✓ Experimental Arm: SoC + PD-L1 blocker Durvalumab 1500 mg q4w up to 12 months
✓ Objectives :
✓ The primary end point : efficacy of durvalumab added to SoC, in terms of centrally reviewed Progression Free Survival (cPFS).
✓ Secondary end points: PFS OS Safety QoL
EXPERIMENTAL ARM CRT+ Durvalumab (N=60)
Durvalumab 1500 mg q4w during Year 1
RT 50 Gy + FOLFOX q2w
Screening Endoscopy Biopsy FDG-PET/CT QoL
R 1:1
M6 CT scan QoL | M9 CT scan QoL | Year 1 CT scan QoL | M18 CT scan QoL | Year 2 CT scan QoL
STANDARD of CARE ARM (N=60)
RT 50 Gy + FOLFOX q2w
Stratification factors: • Center • Histological Type: Adenocarcinoma vs Squamous cell carcinoma • Stage: I/II vs III/IV vs unknown
Primary endpoint: Centrally Reviewed PFS
Secondary endpoints: Safety, OS, QoL
Ancillary studies: - Biomarkers CPS score + TIL (CD3 CD8 CD 68) - Gut microbiota - Plasmatic biomarkers of response to IO and / or CRT
Assessed for eligibility N= 188
Randomized patients N =112
Arm A: CRT + DURVA N = 58 Received allocated intervention N =57 Did not receive allocated treatment N = 1
Arm B: CRT N = 54 Received allocated intervention N =53 Did not receive allocated treatment N =1
Intent To Treat population N = 58 Safety population N = 57
Intent To Treat population N =54 Safety population N = 53
From May 2019 to May 2024
Modesto A, Tougeron D, Tremolières P, Ronchin P, Jouve AD, Leignel DA, et al. Association of Radiochemotherapy to Immunotherapy in unresectable locally advanced Oesophageal carciNoma-randomized phase 2 trial ARION UCGI 33/PRODIGE 67: the study protocol. BMC Cancer. 2023 Oct 12;23(1):966
Anouchka MODESTO M.D Ph.D.
[Slide 2]
Survival
Primary endpoint : Centrally reviewed PF Survival
One year 50,5% vs 48.9 %
adj HR* = 0.86, 95%CI [0.52; 1.41] ; 80%CI [0.62; 1.19]
1-sided p = 0.273
*Adjusted for Stratification factors
Y-axis: centralized Progression-free survival; X-axis: Months (0-27)
Number at risk (months 0/3/6/9/12/15/18/21/24/27)
Arm A: 58 53 42 33 25 20 18 18 9 0
Arm B: 54 46 33 28 24 21 20 18 5 0
Legend: Arm A / Arm B
No impact of CPS score
One year OS < 65 years 90.5% vs 55.6% (p=0.072)
Secondary end point : Overall Survival
One year 75.1% vs 67,9 %
adj HR* = 0.97, 95%CI [0.57; 1.64] ; 80%CI [0.69; 1.37],
1-sided p = 0.451
*Adjusted for Stratification factors
Y-axis: Overall survival; X-axis: Months (0-27)
Number at risk
Arm A: 58 56 54 50 42 40 35 30 20 0
Arm B: 54 48 43 39 36 35 30 29 13 0
Legend: Arm A / Arm B
Anouchka MODESTO M.D Ph.D.
Survival table
Endpoint: Centrally reviewed PFS (primary); OS (secondary)
Arm A: CRT + durvalumab | 58
Arm B: CRT | 54
HR: 0.86 (adjusted, cPFS)
HR CI: 95% CI 0.52-1.41; 80% CI 0.62-1.19
P: 1-sided p = 0.273
Landmark rates:
1 year: Arm A: CRT + durvalumab 50.5% (cPFS) | Arm B: CRT 48.9% (cPFS) | Arm A: CRT + durvalumab 75.1% (OS) | Arm B: CRT 67.9% (OS)
[Slide 3]
Tolerance and Quality of life
➢ Radiation Therapy completion (50 Gy) : 97%
➢ FOLFOX completion: 70%
➢ Median delivered Durva (Exp arm) : 9 courses
➢ Grade 3-5 TRAE 75,4% vs 75,5%
➢ No safety signal
QLQ-C30 : Global health status [line chart, Global health status (mean) by Baseline, M3, M6, M9, M12, M18, M24; Arm A / Arm B]
QLQ-OES18 : Dysphagia [line chart, Dysphagia (mean) by Baseline, M3, M6, M9, M12, M18, M24; Arm A / Arm B]
Anouchka MODESTO M.D Ph.D.
[Slide 4]
Conclusion
✓ Anti PDL-1 Durvalumab + CRT was not associated with improved centrally reviewed PFS
✓ Trend to improve OS if < 65 years : one year OS 90% vs 55,6% (p=0,07)
✓ No safety signal
✓ Pending questions:
– Regional lymph nodes at risk of containing microscopic disease received large fields of prophylactic irradiation
– Optimal timing of RT and IO : sequential > concurrent?
– Patients selection and Biomarkers beyond CPS.
[photo of Rodin's The Thinker sculpture]
Anouchka MODESTO M.D Ph.D.
DrJorgeB_George@DrJorgeBarriuso
Slide: Cachexia shifts adipose CD8+ T cells toward exhausted states - UMAP and bar plots in SAT and VAT
Interesting data linking adipose tissue cachexia and outcome to immunotherapy in gastric cancer #ESMO26 abstract 4252RO
👉linking host fat with tumour microenvironment and clinical outcomes
through GDF-15 and exhausted CD8
#ESMOAmbassadors
@myESMO https://t.co/AaRAH6HsEd
Cachexia shifted adipose CD8+ T cells toward exhausted states
UMAP: Non-cachexia, Cachexia
Tpex score | Tex-int score | Tex-term score (Module score)
Tpex | Tex-int | Tex-term
Percentage of CD8 T cells
SAT | VAT
Tpex: SAT ns; VAT *
Tex-int: SAT *; VAT *
Tex-term: SAT *; VAT ns
Cachexia status: Non-cachexia, Cachexia
Tpex – progenitor exhausted CD8 T cell
Tex-int – intermediate exhausted CD8 T cell
Tex-term – terminally exhausted CD8 T cell
Joo Sung Shim, MD, MSc
J.Han et al., Cell Discovery 2022
Nieves Martinez Lago MD PhD@DraMartinezLago
1) Trial design schema: UNION study design (livestream capture), Zhen Yu Lin · 2) Kaplan-Meier survival data: UNION investigator-assessed EFS (livestream capture) · 3) Safety data: UNION safety summary and common TRAEs
#ESMO26 🚀 UNION | Phase III
👥 231 pts | Locally advanced rectal cancer
💊 SCRT + CAPOX + camrelizumab vs CRT + CAPOX
📈 3-y EFS: 91.3% vs 77.4%
✅ HR 0.33 (95% CI 0.15–0.71; p=0.0029)
⚠️ G≥3 TRAEs: 51.3% vs 48.2%
💡 Significant EFS benefit with immunotherapy-based treatment!
@OncoAlert
[Slide 1]
STUDY DESIGN
Randomised, open-label phase 3 trial (NCT04928807)
Key Eligibility Criteria
• Untreated histologically confirmed rectal adenocarcinoma, clinically staged as T3–4 or N+
• Patients who planned to undergo surgery following neoadjuvant treatment
• ≤10 cm distance from the anal verge
• Eastern Cooperative Oncology Group performance status of 0 or 1
(N=231)
R 1:1
Experimental group: SCRT → Camrelizumab + CAPOX (Q3W, 2 cycles) → TME → Camrelizumab + CAPOX (Q3W, 6 cycles) → Camrelizumab (Q3W, up to 9 cycles)
Standard of care group: LCCRT → CAPOX (Q3W, 2 cycles) → TME → CAPOX (Q3W, 6 cycles)
Primary Endpoint:
• BIRC-assessed pCR (ypT0N0) rate
Key Secondary Endpoints:
• Investigator-assessed EFS
• OS
Other Secondary Endpoints:
• Completion rate of neoadjuvant therapy
• R0 resection rate
• Tumour regression grade
• BIRC-assessed EFS
• Investigator-assessed DFS
• Quality of life
• Safety
Stratification factors
• Clinical T stage (≤T3 vs T4)
• Clinical N stage (N0 vs N+)
SCRT: 25 Gy in 5 fractions.
LCCRT: 50.4 Gy in 28 fractions with concurrent oral capecitabine 825 mg/m² twice daily.
CAPOX: oral capecitabine 1000 mg/m² twice daily on days 1-14 and intravenous oxaliplatin 130 mg/m² on day 1.
Camrelizumab: 200 mg intravenously on day 1.
Consolidation therapy was administered one week after SCRT in the experimental group and two weeks after LCCRT in the standard-of-care group.
TME was performed within 10 weeks after the completion of radiotherapy.
SCRT, short-course radiotherapy; CAPOX, capecitabine plus oxaliplatin; TME, total mesorectal excision; LCCRT, long-course chemoradiotherapy; BIRC, blinded independent review committee; pCR, pathological complete response; EFS, event-free survival; OS, overall survival; DFS, disease-free survival.
Presenter: Zhenyu Lin
[Livestream frame: 10:15 - 11:45 Proffered paper: Gastrointestinal tumours, lower digestive; CHAIR: GUILLERMO ARGILES MARTINEZ; speaker card: Zhen Yu Lin — Neoadjuvant short-course radiotherapy followed by camrelizumab and chemotherapy in locally advanced rectal cancer (LARC): The phase 3 UNION trial; ALMERIA AUDITORIUM - HALL 9]
[Slide 2]
KEY SECONDARY ENDPOINT: Investigator-assessed EFS
◆ Median duration of follow-up was 36.7 months (IQR 32.6-39.9) in the experimental group and 34.7 months (IQR 31.1-39.1) in the standard-of-care group.
◆ Per investigator assessment, the experimental regimen provided a statistically significant and clinically meaningful improvement in EFS compared with standard of care (3-year rate: 91.3% [95% CI 83.9-95.4] vs 77.4% [95% CI 67.9-84.4]; HR 0.33 [95% CI 0.15-0.71], p=0.0029; crossing the prespecified boundary of statistical significance [0.0102]).
Legend: Experimental group; Standard of care group
Number of events/patients | 3-year rate (95% CI)
9/113 | 91.3% (83.9–95.4)
25/118 | 77.4% (67.9–84.4)
Stratified HR 0.33 (95% CI 0.15–0.71), two-sided log-rank p=0.0029
Event | Experimental group (N=113) | Standard of care group (N=118)
EFS event | 9 (8.0) | 25 (21.2)
Local recurrence only | 0 | 4 (3.4)
Distant metastases only | 6 (5.3) | 17 (14.4)
Local recurrence and distant metastases | 1 (0.9) | 2 (1.7)
Death as the first event | 2 (1.8) | 2 (1.7)
Number at risk (Number censored)
Experimental group 113 (0) 108 (4) 104 (7) 98 (10) 98 (10) 95 (12) 92 (14) 92 (14) 86 (18) 78 (26) 64 (41) 51 (53) 29 (75) 15 (89) 7 (97) 2 (102) 0 (104)
Standard of care group 118 (0) 111 (7) 100 (12) 95 (14) 87 (17) 84 (18) 80 (19) 78 (19) 74 (22) 69 (27) 56 (39) 42 (53) 25 (70) 14 (81) 8 (85) 2 (91) 1 (92) 0 (93)
EFS, event-free survival; IQR, interquartile range; HR, hazard ratio; CI, confidence interval. Data cutoff date: October 1, 2025.
Presenter: Zhenyu Lin
[Livestream frame: Proffered paper: Gastrointestinal tumours, lower digestive; speaker card: Zhen Yu Lin — The phase 3 UNION trial]
Survival table
Endpoint: Investigator-assessed EFS
Experimental group (SCRT + camrelizumab + CAPOX) | 113
Standard of care group | 118
HR: 0.33
HR CI: 0.15–0.71
P: two-sided log-rank p=0.0029
Landmark rates:
3 years: Experimental group 91.3% (CI 83.9–95.4) | Standard of care group 77.4% (CI 67.9–84.4)
🚨#ESMO26 | Managing toxicities with bispecific therapies
💥Key pearls from Christophe Le Tourneau:
• CRS usually occurs early, often within 48h, and becomes less frequent with subsequent doses!!!
• ICANS remains uncommon, but early neurological symptoms matter…..
• “On-target, off-tumor” toxicity depends on where the target is expressed in normal tissues
• Infusion-related reactions are frequent with some agents, but usually manageable with premedication and early intervention!
With bispecifics, toxicity management starts by being very specific about the mechanism🎯
@OncoAlert @OncoReporte @myESMO @_SEOM @GrupoMelanoma
[Slide 1]
CRS
• Non-specific immune response characterized by excessive and rapid activation of T-cells and other effector cells, leading to hypersecretion of proinflammatory cytokines such as IL-6, IL-10, IL-18, IFN-γ, and TNF-α
• Often begins with fever, and can escalate to hypotension, disseminated intravascular coagulation, and acute respiratory distress syndrome with hypoxemia
• Rarely severe (Grade 3 & 4: 1 – 7%)
• Usually occurs within 48 hours after the first dose
• Becomes more attenuated with subsequent treatment → It is recommended to use steroids, antihistamines and paracetamol in the first 2 cycles and discontinue if no CRS is experienced
Christophe Le Tourneau, MD, PhD
[Slide 2]
ICANS
• Immune effector Cell-Associated Neurotoxicity Syndrome
• Often co-occurs with CRS
• Disruption of the blood-brain barrier and transcient central cytokine leak due to cytokine-mediated endothelial dysfunction
• Linked to IL-1-mediated neuroinflammation, blood-brain barrier breakdown, and disturbance of neuronal excitability
• Early symptoms include tremor, dysgraphia, dysphasia (especially in naming objects), apraxia, and lethargy, with potential progression to seizures, encephalopathy, or coma
• Remains rare (1 – 8%)
Christophe Le Tourneau, MD, PhD
[Slide 3]
On-target off-tumor toxicity
• Due to antigens expressed on normal tissues
• Toxicities depend on the targets:
- CEA → GI toxicity
- EGFR → skin toxicity
- EpCAM → liver toxicity, diarrhea
- gp100 → skin toxicity
- GPRC5D → skin & nail disorders, loss of sense of taste
- BCMA → hypogammaglobulinemia, risk of infection
Christophe Le Tourneau, MD, PhD
[Slide 4]
Infusion-related reactions (IRR)
Neurologic and psychiatric: Dizziness, Headache, Weakness, Syncope, Seizure, Anxiety, Sense of impeding doom
40% Respiratory: Dyspnea, Nasal Congestion, Rhinitis, Sneezing, Oropharyngeal or laryngeal edema, Bronchospasm, Tachypnea, Cyanosis, Respiratory arrest
30% Cardiovascular: Tachycardia, Hypotension, Arrhythmia, Chest pain, Ischemia or infarction, Cardiac arrest
90% Cutaneous: Flushing, Erythema, Pruritus, Urticaria, Angioedema, Rash
Gastrointestinal: Nausea, Vomiting, Cramping, Diarrhoea
Other: Chills, Fever
Figure 1. Signs and symptoms of infusion reactions.
Christophe Le Tourneau, MD, PhD
Barroso et al., ESMO Open 2024;9:1-18
Angela Lamarca@DrAngelaLamarca
1) Trial design schema: EMERALD-3 study design (Kudo, ESMO 2026 liver function post-hoc analysis) · 2) Slide: EMERALD-3 baseline characteristics by ALBI grade (Kudo, ESMO 2026) · 3) Slide: EMERALD-3 mean ALBI score over treatment period by baseline ALBI grade (Kudo, ESMO 2026) · 4) Slide: EMERALD-3 mean Child-Pugh score over treatment period by baseline score (Kudo, ESMO 2026)
Presented at @myESMO #ESMO26
EMERALD3 trial data in #HCC #Intermediate stage
Analysis on liver function over time - no negative impact seems to be seen…
🤔Maybe intra-patients liver function change, rather than pooled means would give more information?
#ESMOAmbassadors https://t.co/Fv7wW1P8sN
[Slide 1]
STUDY DESIGN
EMERALD-3 is a global, randomised, open-label, sponsor-blinded, multicentre, Phase 3 study(1)
Study population(1): • Confirmed HCC not amenable to curative treatment, but eligible for embolisation • Child-Pugh class A • ECOG PS 0 or 1 • No extrahepatic disease • Excludes Vp3 and Vp4 • No prior systemic therapy
Stratification factors(1): • Geographical region (Japan vs Asia [excluding Japan] vs rest of the world) • Prior palliative locoregional therapy (1 >6 months vs 1 ≤6 months vs none) • Baseline tumour burden (>Up-to-7 vs ≤Up-to-7)
R* N=760
Arm A: STRIDE + L + TACE† (n=293)
Arm B: STRIDE + TACE† (n=175)
Arm C: TACE† (n=292)
*Participants were randomised 1:1:1 to Arms A, B and C until each arm reached 175 participants; following this, randomisation continued 1:1 to Arms A and C until reaching ~275 participants per arm
Primary endpoint‡: • PFS for Arm A vs C per RECIST v1.1 by BICR
Key secondary endpoints‡: • OS for Arm A vs C • PFS for Arm B vs C per RECIST v1.1 by BICR • OS for Arm B vs C
Other secondary endpoints included‡: • PFS2, PROs, safety
Post-hoc exploratory assessments: • TTNT • Mean ALBI and Child-Pugh scores over the treatment period
EMERALD-3: NCT05301842. In this post-hoc exploratory analysis, underlined variables are reported by baseline liver function.
†DEB-TACE or conventional TACE. TACE starts ≥7 days after tremelimumab + durvalumab ± lenvatinib for Arms A and B or within 7 days of randomisation for Arm C, followed by additional procedures at the investigator's discretion. Treatment will continue for up to a maximum of 36 months.
‡Under a multiple testing procedure, the primary endpoint and key secondary endpoints are assessed sequentially in hierarchical order.
BICR, blinded independent central review; DEB-TACE, drug-eluting bead transarterial chemoembolisation; ECOG PS, Eastern Cooperative Oncology Group performance status; PFS2, time from randomisation to earliest progression following first objective progression after the first subsequent therapy or death; PRO, patient-reported outcome; R, randomised; RECIST, Response Evaluation Criteria in Solid Tumors; TTNT, time from randomisation to first subsequent therapy or death; Vp3, thrombosis in the right or left portal vein; Vp4, thrombosis in the main truck of the portal vein.
1. Kudo M, et al. Lancet Oncol 2026;27:1077–1093.
Masatoshi Kudo, MD, PhD
[Slide 2]
BASELINE CHARACTERISTICS BY ALBI GRADE
n (%) unless otherwise indicated | ALBI Grade 1: STRIDE + L + TACE (n=188) | STRIDE + TACE (n=105) | TACE (n=183) | ALBI Grade 2*: STRIDE + L + TACE (n=105) | STRIDE + TACE (n=70) | TACE (n=109)
Age, years, median (range) | 66 (25–86) | 66 (33–83) | 64 (34–83) | 67 (33–86) | 63 (32–85) | 67 (43–85)
Geographical region: Japan | 15 (8.0) | 7 (6.7) | 10 (5.5) | 7 (6.7) | 4 (5.7) | 12 (11.0)
Asia (excluding Japan) | 119 (63.3) | 82 (78.1) | 119 (65.0) | 53 (50.5) | 55 (78.6) | 54 (49.5)
Rest of world | 54 (28.7) | 16 (15.2) | 54 (29.5) | 45 (42.9) | 11 (15.7) | 43 (39.4)
ECOG PS 0 | 154 (81.9) | 94 (89.5) | 156 (85.2) | 82 (78.1) | 51 (72.9) | 83 (76.1)
Aetiology: Hepatitis B virus | 94 (50.0) | 61 (58.1) | 98 (53.6) | 37 (35.2) | 38 (54.3) | 40 (36.7)
Hepatitis C virus | 23 (12.2) | 11 (10.5) | 24 (13.1) | 16 (15.2) | 8 (11.4) | 13 (11.9)
None / neither | 68 (36.2) | 33 (31.4) | 57 (31.1) | 52 (49.5) | 23 (32.9) | 52 (47.7)
Child-Pugh: Class A – score of 5 | 176 (93.6) | 100 (95.2) | 172 (94.0) | 70 (66.7) | 44 (62.9) | 73 (67.0)
Class A – score of 6 | 12 (6.4) | 5 (4.8) | 11 (6.0) | 32 (30.5) | 26 (37.1) | 34 (31.2)
BCLC stage A | 33 (17.6) | 20 (19.0) | 42 (23.0) | 18 (17.1) | 13 (18.6) | 27 (24.8)
B | 123 (65.4) | 69 (65.7) | 112 (61.2) | 64 (61.0) | 45 (64.3) | 59 (54.1)
C | 32 (17.0) | 16 (15.2) | 28 (15.3) | 23 (21.9) | 12 (17.1) | 22 (20.2)
Tumour burden (Up-to-7 criteria†) ≤7 | 82 (43.6) | 38 (36.2) | 72 (39.3) | 33 (31.4) | 22 (31.4) | 43 (39.4)
>7 | 106 (56.4) | 67 (63.8) | 111 (60.7) | 72 (68.6) | 48 (68.6) | 66 (60.6)
Portal vein invasion Vp1 or Vp2 | 17 (9.0) | 12 (11.4) | 19 (10.4) | 12 (11.4) | 7 (10.0) | 9 (8.3)
Prior palliative embolisation before randomisation‡ | 29 (15.4) | 22 (21.0) | 37 (20.2) | 22 (21.0) | 7 (10.0) | 13 (11.9)
DCO1: 2 Sep 2025. Tumour burden and prior palliative embolisation before randomisation are from Interactive Response Technology data.
*Includes 1 participant with ALBI grade 3 in the STRIDE + lenvatinib + TACE arm; †Within Up-to-7 criteria: sum of size of largest tumour (in cm) and number of tumours of ≤7; beyond Up-to-7 criteria: sum of size (in cm) and number of tumours >7.
‡Includes participants who received one embolisation procedure at >6 months and those who received one embolisation procedure at ≤6 months.
BCLC, Barcelona Clinic Liver Cancer; DCO, data cut-off; Vp1, thrombus beyond second order branches; Vp2, thrombus in second order branches.
Masatoshi Kudo, MD, PhD
[Slide 3]
MEAN ALBI SCORE OVER TREATMENT PERIOD BY BASELINE ALBI GRADE
Left panel: ALBI Grade 1 | Right panel: ALBI Grade 2*
Legend: STRIDE + L + TACE | STRIDE + TACE | TACE
Y-axis: Mean ALBI score (0 to -4); X-axis: Analysis visit number (1, 5, 6, 8 ... 42)
Reference bands: ALBI Grade 3: > -1.39 | ALBI Grade 2: >-2.60 to ≤ -1.39 | ALBI Grade 1: ≤ -2.60
Number of participants (ALBI Grade 1):
STRIDE + L + TACE 185 158 155 135 141 139 137 127 128 123 117 110 104 98 90 90 84 77 74 73 70 69 65 63 58 55 52 47 44 40 38 33 28 26 26 21 20 19 8
STRIDE + TACE 105 36 86 28 83 84 75 74 68 65 63 59 55 57 55 52 48 50 46 44 44 43 39 37 35 35 35 34 33 34 32 28 29 23 20 17 12
TACE 181 53 109 33 86 88 67 50 34 30 24 19 15 12 11 10 10 9 8 7 7 5 5 5 5
Number of participants (ALBI Grade 2*):
STRIDE + L + TACE 102 90 87 78 81 75 71 68 64 59 57 54 51 44 47 44 41 36 36 34 30 31 25 20 19 18 16 14 14 12 10 7 8 7 7 7 6 7
STRIDE + TACE 70 23 62 20 53 52 47 43 38 32 32 32 32 31 29 29 28 23 22 23 21 20 19 18 17 17 16 13 15 16 16 13 15 15 11 12 12 7
TACE 109 34 51 20 38 38 28 19 12 9 8 8 5 5 5
DCO2: 23 Feb 2026. Visits with <5 participants were excluded to avoid overinterpretation of changes in mean values due to small sample sizes.
*Includes 1 participant with ALBI grade 3 in the STRIDE + lenvatinib + TACE arm.
ALBI scores were derived from albumin and bilirubin separately assessed every 14 days from baseline up to Cycle 3, then every 28 days thereafter until treatment discontinuation or up to Cycle 37 Day 1 (analysis visit 42). For participants with baseline ALBI grade 1, median (range) follow-up duration for ALBI assessment was 11.9 (0–35.2) months for STRIDE+L+TACE, 11.8 (0–34.9) months for STRIDE+TACE, and 2.0 (0–24.1) months for TACE; for participants with baseline ALBI grade 2*, median (range) follow-up duration was 9.3 (0–35.1) months, 5.8 (0–34.3) months, and 0.9 (0–28.4) months, respectively. Duration of follow-up was calculated between final visit and start of treatment. Where the final visit was baseline and occurred prior to start of treatment, duration was set to 0. All visits, including those with fewer than 5 participants, were included in the duration of follow-up calculation.
Masatoshi Kudo, MD, PhD
[Slide 4]
MEAN CHILD-PUGH SCORE OVER TREATMENT PERIOD BY BASELINE SCORE
Left panel: Child-Pugh Class A – score of 5 | Right panel: Child-Pugh Class A – score of 6
Legend: STRIDE + L + TACE | STRIDE + TACE | TACE
Y-axis: Mean Child-Pugh score; X-axis: Analysis visit number; band label: Child-Pugh Class A
Number of participants (score of 5):
STRIDE + L + TACE 242 181 171 164 165 157 158 150 143 135 127 122 116 116 105 99 99 93 88 83 80 72 71 66 63 58 54 50 46 37 31 30 28 23 23 21 11
STRIDE + TACE 144 111 107 113 99 94 88 85 82 79 73 74 71 68 65 63 57 56 56 53 50 47 46 44 42 41 40 39 34 35 28 27 24 15 6
TACE 242 158 130 106 83 62 38 31 26 23 17 15 14 13 12 11 10 8 9 6 6 6 5 5
Number of participants (score of 6):
STRIDE + L + TACE 43 32 27 30 28 27 22 21 22 20 19 14 14 13 11 8 8 7 7 7 7 5 5
STRIDE + TACE 31 23 18 18 19 18 14 12 9 11 12 13 10 11 12 9 11 12 9 8 9 8 8 9 6 9 8 5 8 8 8 6 6 6
TACE 46 26 19 15 9 7 5
DCO2: 23 Feb 2026. Visits with <5 participants were excluded to avoid overinterpretation of changes in mean values due to small sample sizes.
Child-Pugh score for class A-C ranges from 5–15, derived from clinical laboratory assessments collected at baseline then every 28 days until treatment discontinuation or up to Cycle 37 Day 1 (analysis visit 42).
For participants with baseline Child-Pugh Class A (score of 5), median (range) follow-up duration for Child-Pugh assessment was 11.9 (0–35.1) months for STRIDE+L+TACE, 11.2 (0–34.9) months for STRIDE+TACE, and 1.8 (0–28.4) months for TACE; for participants [partly obscured] Class A (score of 6), median (range) follow-up duration was 7.8 (0–35.2) months, 5.6 (0–33.2) months and 0.9 (0–17.3) months, respectively. Duration of follow-up was calculated between final visit and start of treatment. Where the final visit was baseline and occurred [obscured] duration was set to 0. All visits, including those with fewer than 5 participants, were included in the duration of follow-up calculation.
Masatoshi Kudo, MD, PhD
Dani Castillo@DaniCastilloMD
1) Slide: Age does NOT impact checkpoint inhibitor efficacy - OS by age group forest plot · 2) Safety data: Tolerability of peri-operative treatment in older patients: CRITICS cohort · 3) Safety data: Tolerability of peri-operative FLOT in older patients: RealFLOT cohort composition · 4) Slide: Age and microbiome: age-related microbiome shift strongest in healthier older adults
Chronological age ≠ biological age. Fit geriatric GI cancer pts may still benefit from curative-intent therapy. Immunotherapy responses aren't necessarily diminished by age, and the microbiome may play a role. Patient goals should guide every decision. #GIOn #ESMO2026 https://t.co/WcHGVzQidy
[Slide 1]
Age does NOT impact checkpoint inhibitor efficacy
Overall survival benefit of immunotherapy by age group
Re-expression of Table 1 (OS subgroup analysis)
Subgroup | No. of studies | Age <65 years HR (95% CI) | Age ≥65 years HR (95% CI) | P value for subgroup difference
All | 26 | 0.77 (0.70-0.85) | 0.77 (0.70-0.85) | 0.99
Primary disease site
NSCLC | 10 | 0.71 (0.61-0.84) | 0.78 (0.68-0.90) | 0.39
Melanoma | 6 | 0.76 (0.63-0.92) | 0.72 (0.60-0.87) | 0.68
Other tumors | 10 | 0.83 (0.72-0.97) | 0.78 (0.65-0.94) | 0.61
Type of immunotherapy
Anti-PD-1/PD-L1 antibody | 18 | 0.77 (0.68-0.87) | 0.71 (0.64-0.79) | 0.36
Anti-CTLA-4 antibody | 7 | 0.82 (0.71-0.94) | 0.93 (0.80-1.07) | 0.23
Line of treatment
1st line | 11 | 0.74 (0.62-0.89) | 0.81 (0.69-0.95) | 0.49
≥2nd line | 15 | 0.79 (0.71-0.87) | 0.74 (0.66-0.83) | 0.45
Hazard ratio for overall survival (0.5-1.2); Favors immunotherapy / No benefit; legend: Age <65 years, Age ≥65 years
Kim et al, ESMO Open 2022
[Slide 2]
Tolerability of peri-operative treatment in older patients: CRITICS
CRITICS cohort composition
≥70 years (n=172) | <70 years (n=616)
Age group: ≥70 years 172 (22%); <70 years 616 (78%); Median age: 59 vs 73 years
Sex: Male 121 (70%) [≥70] vs 408 (66%) [<70]; Female 51 (30%) vs 208 (34%)
WHO performance status: WHO PS 0 104 (60%) vs 430 (70%); WHO PS 1 54 (31%) vs 155 (25%); Not performed 14 (8%) vs 28 (5%)
Patients (%)
Based on Table 1 from Slagter et al. Older versus younger adults with gastric cancer receiving perioperative treatment: Results from the CRITICS trial. WHO performance status had 3 missing values overall.
Based on Slagter et al, EJC 2020
[Slide 3]
Tolerability of peri-operative FLOT in older patients
RealFLOT cohort composition (n=206)
Selected real-world cohort of resectable gastric or gastro-oesophageal junction adenocarcinoma
Sex: Male 141 (68%); Female 65 (32%)
Age group: <65 years 117 (57%); ≥65 years 89 (43%)
ECOG performance status: 0 189 (92%); 1 17 (8%)
Patients (%) [0-100]
Based on Table 1. Median age 63 years (range 36-77); 43% were aged ≥65 years; all patients had ECOG PS 0-1.
Based on Giommoni et al, BMC Cancer 2021
[Slide 4]
Age and microbiome
The age-related microbiome shift is strongest in healthier older adults
MrOS cohort
Discovery Cohort (N=599): Walk Speed High n=200 ***; Walk Speed Low n=399; Excellent n=205 *; <Excellent n=394; Low Med n=292 *; High Med n=307; LSC High n=205 *; LSC Low n=394; Composite Healthy n=133 **; Rest of cohort n=466
Validation Cohort (N=308): Walk Speed High n=106; Walk Speed Low n=202; Excellent n=106; <Excellent n=202; Low Med n=141 *; High Med n=167; LSC High n=111; LSC Low n=197; Composite Healthy n=61 *; Rest of cohort n=247
[Forest plots: Spearman Rho (-0.10 to 0.3) and Adj. β-Coef. (-0.01 to 0.01); significance markers ***, **, *, # on adj. β-coef. panel]
Osteoporotic Fractures in Men study
Based on Wilmanski et al, Nature Metabolism
Paula Jimenez Fonseca@PaulaJFonseca
1) Biomarker data: Poster 2936P: chemoimmunotherapy vs zolbetuximab-based therapy · 2) Slide: Poster FPN 8949: interactive prognostic model of overall survival in advanced gastric
2 AGAMENON registry posters at #ESMO26 | RWD Section @_SEOM
▶️@EduardoTB94 @VHIO: Outcomes in CLDN18.2+ IV gastric cancer with low PD-L1.
▶️ Gema Marín @HUVA_Arrixaca: Interactive OS prognostic model in IV gastric cancer with immunotherapy.
👏Thanks to all AGAMENON investigators! https://t.co/23sjbjIlLl
[Slide 2]
Interactive prognostic model of overall survival in advanced gastric adenocarcinoma in the immunotherapy era: the AGAMENON-SEOM registry
FPN: 8949
ESMO Congress 2026 · Madrid, 23-27 October
G. Marín, R. Hernández San Gil, B. García Porlan, I. Gardeazabal, A. Custodio, A. Fernández Montes, E. Terán Brage, A. Francisco Fernández, M. Ruiz Martín, T. Sauri, A. Calvo, F. Longo Muñoz, P. Ribera Fernández, L. Visa, C. Hierro, L. Gutiérrez, A. Martín Carnicero, P. Jimenez-Fonseca, J. Gallego, A. Carmona Bayonas
BACKGROUND
• Adding immune checkpoint inhibitors (ICI) to first-line chemotherapy changed the treatment of advanced HER2-negative gastric/gastroesophageal junction (GEJ) adenocarcinoma.
• Access to ICI depends on PD-L1 CPS, a continuous variable dichotomised at trial-specific cut-offs (CPS ≥1, ≥5, ≥10).
• No validated prognostic model integrates continuous PD-L1 with routine clinical and laboratory variables.
Aims: (1) build an individualised OS model and interactive calculator; (2) validate it; (3) explore long-term (3-year) survival and a "cured" fraction by CPS.
METHODS
• Design: observational, multicentre AGAMENON-SEOM registry (41 hospitals).
• Population: advanced HER2-negative non-squamous gastric/GEJ adenocarcinoma; first-line CT ± anti-PD-1 from 2021. Registry 5,814 → first line since 2021, 1,581 → HER2-negative, 1,229 → 1,178 with evaluable follow-up.
• Endpoint: OS from start of first line.
• Analysis: Kaplan-Meier, log-rank; multivariable Cox with a-priori covariates; restricted cubic splines for CPS, neutrophil-to-lymphocyte ratio (NLR) and age; ICI × spline(log-CPS) interaction; multiple imputation.
• Performance: C-index (apparent, bootstrap, external), calibration at 1–3 years; temporal validation in later patients. Mixture cure models with four latency distributions.
PATIENT CHARACTERISTICS
| Total | CT alone | CT + anti-PD-1
Patients, n | 1,178 | 688 | 490
Age, median [IQR] | 66 [57–74] | 66 [56–74] | 66 [58–74]
Male | 67% | 66% | 68%
ECOG ≥2 | 12% | 15% | 9%
Lauren diffuse | 59% | 64% | 52%
Peritoneal metastases | 48% | 53% | 42%
CPS, median [IQR] | 6 [1–15] | 1 [0–4] | 12 [6–23]
CPS ≥10 (of tested) | 38% | 11% | 62%
Oxaliplatin regimen | 91% | 85% | 98%
Deaths | 65% | 70% | 57%
Percentages of known values. CPS tested in 74% (60% CT alone; 93% CT + anti-PD-1).
RESULTS
12.4 vs 10.1 mo — Median OS, CT + anti-PD-1 vs CT (n = 1,178; 762 deaths)
HR 0.75 — 95% CI 0.65–0.87; unadjusted; log-rank p <0.001
19% vs 11% — Alive at 3 years (1-/2-year: 52/29% vs 45/19%)
ICI benefit grows continuously with PD-L1 CPS
Multivariable Cox, ICI × spline(log-CPS), n = 1,178: interaction p = 0.013; non-linear component p = 0.008.
CPS <5: few patients treated with ICI
HR at CPS 1: 0.71; CPS 5: 0.99; CPS 10: 0.90; CPS 20: 0.72; CPS 50: 0.50; CPS 100: 0.37
HR, CT + anti-PD-1 vs CT
PD-L1 CPS (log scale)
Continuous spline estimate with 95% CI (shaded); labels show HR at selected CPS values. Adjusted for regimen, ECOG, NLR, age, sex, ascites, Lauren, bone metastases, number of sites and albumin. No single cut-off captures the gradient.
Calculator model: multivariable Cox (n = 999; 652 events)
Variable | HR (95% CI) | p
Oxaliplatin regimen (vs other) | 0.67 (0.52–0.86) | 0.002
ECOG 0 (vs ≥2) | 0.57 (0.43–0.76) | <0.001
ECOG 1 (vs ≥2) | 0.70 (0.55–0.89) | 0.003
Female sex | 0.82 (0.69–0.98) | 0.032
Mild ascites (vs none) | 1.11 (0.89–1.40) | 0.35
Moderate ascites | 1.36 (0.96–1.91) | 0.081
Severe ascites | 1.99 (1.21–3.29) | 0.007
Intestinal histology (vs diffuse) | 0.70 (0.57–0.87) | 0.001
Bone metastases | 1.34 (1.06–1.70) | 0.014
≥3 metastatic sites | 1.42 (1.16–1.74) | <0.001
Albumin 2.5–3.5 g/dL (vs normal) | 1.21 (0.95–1.53) | 0.12
Albumin <2.5 g/dL | 1.49 (1.12–1.98) | 0.006
Also: NLR (spline, p <0.001), age (spline, p = 0.001) and ICI × log-CPS (spline; interaction p = 0.055, non-linear p = 0.025). Green: lower risk; red: higher risk.
0.685 / 0.673 — Derivation C-index, apparent / optimism-corrected; calibration slope 1.03 (0.90–1.16)
0.67 (0.61–0.74) — Temporal validation C-index, n = 171 later patients (91 deaths); slope 0.82 (0.48–1.16)
INTERACTIVE CALCULATOR: AGAMENON-SEOM
App screenshot (Spanish interface). Reference profile: 66-year-old man, ECOG 1, NLR 3.5, Lauren intestinal, no ascites or bone metastases, 1–2 metastatic sites, normal albumin, oxaliplatin regimen.
Same patient, CPS | CT alone | CT + anti-PD-1
5 | 14.9 m (21%) | 15.8 m (23%)
20 | 13.5 m (18%) | 17.4 m (27%)
50 | 12.6 m (15%) | 20.4 m (33%)
Predicted median OS (probability alive at 3 years).
agamenon.shinyapps.io/immunotherapy
Free access. Research tool; does not replace clinical judgement.
Long-term survival and "cure"
• CPS ≥10: alive at 2/3 years 31%/20% with CT + anti-PD-1 vs 14%/11% with CT alone (Kaplan-Meier).
• Predicted 3-year OS falls with CPS on CT alone and rises from CPS 10 with anti-PD-1 (≈30% at CPS 100).
• Cured fraction with anti-PD-1 depends on the assumed distribution (15%, 12%, 7% or 0%); the best-fitting model has no cure fraction. No plateau yet (max follow-up 46 months).
CONCLUSIONS
• ICI benefit is not a threshold effect: it grows continuously and non-linearly with CPS (interaction p = 0.013).
• First AGAMENON-SEOM prognostic model for the immunotherapy era: continuous CPS, treatment and ten clinical-laboratory variables in a free online calculator, validated in independent patients (C-index 0.67).
• 3-year survival depends on CPS and treatment; a cured fraction is not yet identifiable and needs longer follow-up.
Disclosure (first and presenting author, G. Marín)
Nick Tschernia, MD@NickTscherniaMD
1) Slide: Invikafusp alfa Nature Medicine figure panels a-c: CT scans of response to invika · 2) Response data: Invikafusp alfa Nature Medicine figure panel b: waterfall of best percentage
@NatureMedicine 4/ At optimal doses, ORR was 14.8% with disease control in two-thirds of ICB-resistant patients. *Notably*, responses occurred in immunologically cold tumors: 3 of 9 TMB-H colorectal cancers (mostly MSS) and an ICB-resistant, PD-L1-negative NSCLC. https://t.co/HhzCR6xfHK
[Slide 1]
a Pre-ICB combination ~ 6 months pre-invika treatment
b Baseline (for invika) disease progression post ICB combination
c Invika monotherap 9+ months post-treatment
[CT chest images, red arrows marking lesions in a and b]
[Slide 2]
b
OBD HPV+ | OBD including TMB-H or MSI-H or immunogenic
Best percentage change from baseline in target lesions
Tumor types (left to right): Anal, HNSCC, Cervical, Anal, HNSCC | MSS CRC, MSS CRC, NSCLC, Uveal melanoma, TNBC, MSS CRC, DDA, NSCLC, MSS CRC, Esophageal, MSS CRC, MSS CRC, Ovarian, Oropharyngeal, MSS CRC, Pancreatic, Cervical, MSI CRC, Melanoma*, MSS CRC, MSS CRC, NSCLC
Paula Jimenez Fonseca@PaulaJFonseca
1) Slide: Poster 2417P FIT-NETs: exercise program in patients with advanced G1-2 digestive · 2) Slide: Poster 2423P: systemic therapy in advanced gastric neuroendocrine neoplasms, R-GETNE · 3) Safety data: Poster 2418P: perioperative chemotherapy and long-term cure in resected
1⃣poster row on NET at #ESMO26: 4⃣ studies @GrupoGetne & 3 @GCarboneroLab 🇪🇸
G-NENCARE| M. SanRoman: Heterogeneity in IV gastric NEN
FIT-NETs| B Antón-Pascual:🏃♂️⬆️musculoskeletal & respiratory fx in IV NET
SOUTH-NEC|@kimtruss &🙋♀️Resected G3 M0 NECs. Periop CT▶️cure fraction: 23% https://t.co/3G0PHZkXLI
[Slide 2]
2423P - Systemic Therapy in Advanced Gastric Neuroendocrine Neoplasms (G-NENs): Real-World Evidence from the R-GETNE National Registry (G-NENCARE)
María San-Román-Gil, Paula Jiménez-Fonseca, Alejandro García-Álvarez, Carlos González-Merino, Guillermo Crespo-Herrero, Alberto Carmona-Bayonas, Marta Benavent-Viñuales, Carlos López-López, Vicente Alonso-Orduña, Ángel Segura-Huerta, Nieves Martínez-Lago, Javier Gallego-Plazas, Marta Llanos-Muñoz, Laura Nosti-Martínez, Sergio Pérez-Fernández, Rocío García-Carbonero
Table 1. Clinicopathological characteristics: G-NETs vs G-NECs
Characteristic | NET (n=61) | NEC (n=107) | p | Total (n=191) (^)
Age, median (range), years | 62 (21–85) | 70 (38–96) | 0.012 | 67 (21–96)
Male / Female, % | 62.3 / 37.7 | 69.2 / 30.8 | 0.40 | 69.1 / 30.9
ECOG PS 0 / 1 / 2 / ≥3, % | 48.9 / 39.5 / 9.3 / 2.3 | 10.5 / 54.6 / 25.6 / 9.3 | |
Stage (at diagnosis) I / II / III / IV, % | 5.1 / 8.5 / 10.1 / 76.3 | 0 / 1.9 / 14.0 / 84.1 | <0.001 | 23.7 / 49.6 / 19.3 / 7.4
Ki-67 NET: <3% / 3–10% / 11–20% / >20%, % | 27.6 / 43.1 / 22.4 / 6.9 | – | 0.018 | 1.6 / 4.3 / 13.4 / 80.7
Ki-67 NEC: 21–50% / >50%, % | – | 21.2 / 78.8 | |
Metastases: liver / non-regional LN / peritoneum / lung / bone, % (*) | 81.4 / 27.9 / 25.6 / 7.0 / 7.0 | 79.1 / 36.3 / 23.1 / 14.3 / 13.2 | >0.05 | 81.2 / 32.2 / 23.5 / 11.4 / 10.1
1st-line systemic treatment, % | 78.7 | 76.6 | 0.85 | 76.4
Figure 1 / Figure 2 / Figure 3 / Figure 4: Overall survival from metastatic disease
Table 2. mOS according to 1st-line treatment and Ki-67^
Ki-67 (n) | SSA | TT | Non-plat CT | Plat-CT | mOS
G-NET · mOS by treatment | 66m | 34m | 7m | 10m | FIGURE 3
<3% (11) | 9 (82) | 1 (9) | 1 (9) | 0 | 66m
3–10% (21) | 13 (62) | 2 (10) | 2 (10) | 4 (19) | 64m
11–20% (11) | 6 (55) | 1 (9) | 0 | 4 (36) | 34m
>20% (3) | 0 | 0 | 2 (67) | 1 (33) | 10m
Total treated (46)^ | 28 (61) | 4 (9) | 5 (11) | 9 (20) | 48m
G-NEC · mOS by treatment | – | – | 11m | 9m | FIGURE 4
21–50% (19) | 1 (5) | 1 (5) | 3 (16) | 14 (74) | 17m
>50% (60) | 0 | 0 | 7 (12) | 53 (88) | 9m
Total treated (79)^ | 1 (1) | 1 (1) | 10 (13) | 67 (85) | 9m
CONCLUSIONS
• This is one of the largest real-world studies describing treatment patterns and outcomes in advanced Gastric-NENs.
• Advanced G-NENs show marked prognostic heterogeneity: Ki-67 drives prognosis and treatment choice in NETs, whereas disease-related factors predominate in NECs.
• These findings provide valuable insights for clinical practice of a heterogeneous population underrepresented in clinical trials.
Mairead G McNamara, MB PhD, FASCO@MGMcNamara
Slide: APACHI study poster FFPN-485P: adjuvant mFOLFIRINOX for resected ampullary
Adj treatment for resected ampullary cancer often debated; interesting poster #ESMO26 N=66; adj mFOLFIRINOX 3 mo, pancreaticobiliary subtype: did not improve 2 yr RFS compared to historical controls (Gem); ESPAC4 amp cohort data awaited @PancreaticCanUK https://t.co/D9vLAojnR1
485P
FFPN-485P
Adjuvant Chemotherapy for Operated Ampullary Adenocarcinomas Based on Histology and Intensification - Results from the Pancreatobiliary Cohort
APACHI STUDY
Anant Ramaswamy, Venkatesh Darshan, Prabhat G. Bhargava, Vikram A. Chaudhari, Manish Bhandare, Anuradha Mehta, George John, Subhash Yadav, Rajiv K. Kaushal, Munita Bal, Reena Engineer, Rahul Krishnatry, Shivakumar Gudi, Sadhana Kannan, Poonam Jadhav, Sharon F. Sunn, Shailesh Shrikhande, Vikas S. Ostwal
Tata Memorial Centre, Mumbai, India
BACKGROUND
The mainstay of management for resectable ampullary adenocarcinoma (AC) is resection.
The role of adjuvant therapy in resected AC is debatable.
Most guidelines suggest a histology based approach (intestinal vs pancreatobiliary subtyping) to adjuvant therapy, but there is limited prospective data for the same.
AC are relatively common in India in comparison to pancreatic cancers.
AIMS & OBJECTIVES
PRIMARY ENDPOINT:
2-year Recurrence Free Survival (RFS)
SECONDARY ENDPOINTS:
2-year Overall Survival (OS)
Adverse events
Proportion of patients completing planned treatment
Serious adverse events (SAEs)
ELIGIBILITY
Key Inclusion Criteria:
Age: 18-75 years
Diagnosis: Histologically confirmed Stage II-III adenocarcinoma of the ampulla post R0/R1 resection (as per AJCC 8th edition)
Performance Status: ECOG PS 0-1
Organ Function: Adequate end-organ function
Histological Subtype: Intestinal (IT) or pancreatobiliary (PB)
Informed Consent: Ability to provide written informed consent
TRIAL DESIGN & SAMPLE SIZE ESTIMATION
Study Design:
APACHI is designed as a two arm, non-randomized, open-label, prospective, parallel, adaptive design Phase II clinical trial.
Sample Size Estimation:
Available evidence with the use of gemcitabine as adjuvant therapy in operated AC shows a differential RFS with respect to AC and PB subtypes. The study is conducted as two parallel, single-stage Phase II clinical trials. Statistical analyses will be performed within each treatment arm with no formal statistical comparisons between the treatment arms.
The 2 year RFS post surgery and adjuvant gemcitabine for AC-PB subtype is approximately 60%. For the AC-PB cohort, assuming expected 2 year RFS with gemcitabine chemotherapy (historical cohort) is 60%, a study with a power of 80% and two-sided alpha of 10% will require 67 patients to show an improvement in 2 year RFS to 75% with mFOLFIRINOX. (inclusive of an attrition rate of 10%).
METHOD
Phase II
non - randomized open label
prospective parallel adaptive design
Operated periampullary (Stage II or stage III) R0/R1 resection
N = 193
PB Cohort Reported & Complete
Pancreatobiliary subtype -> Modified FOLFIRINOX biweekly x 6
Intestinal subtype -> CAPOX x 4 every 3 weeks
Primary endpoint: RFS
Secondary endpoints: OS, QOL, Tolerance, Toxicity, Recurrence
IT & PB subtypes will be classified based on morphology and IHC
CHARACTERISTICS of STUDY COHORT
Characteristic | Number (Percentage) (N=66)
Age (Range) | 50 (23-72)
Stage II | 16 (24)
Stage III | 50 (76)
Median Nodal retrieval (range) | 23 (3-54)
R0 resection | 64 (97%)
Presence of PNI | 25 (38)
Presence of LVI | 23 (35)
Completed planned chemotherapy | 52 (81)
Number of recurrences | 29 (44)
CONCLUSION
- Adjuvant mFOLFIRINOX for 3 months was feasible in patients with resected stage II-III ampullary cancers (pancreato-biliary subtype) with high treatment completion rates, but did not achieve statistical significance in improving 2-year RFS compared to historical controls treated with gemcitabine.
- Further trials and genomic data might provide further information on the management of these relatively rare subset of Gastrointestinal cancers.
DISCLOSURES & CONTACT
- Funding and Drug Support: The study received grants from Reliance Life Sciences and TRAC, along with an honorarium from Cadila.
- Correspondence: Dr Anant Ramaswamy (anantr13@gmail.com).
RESULTS
Survival plots and key findings:
- Recurrence Free Survival - Pancreatobiliary Cohort (Primary Endpoint)
- Overall Survival - Pancreatobiliary Cohort
- Recurrence Free Survival - Stage Wise
DrJorgeB_George@DrJorgeBarriuso
1) Slide: EOCRC and LOCRC are driven by distinct genetic HLA Class I signatures · 2) Slide: EOCRC vs LOCRC immune profiling conclusions
Differences in immune context for patients presenting colorectal cancer at a younger age (Early Onset) vs a more advanced age (Late Onset) presented by @josepereag #ESMO26
👉 could HLA-I diffs have an impact on designing ad-hoc immunotherapies?
#ESMOAmbassadors @myESMO https://t.co/vkGr9CJvcx
Efficacy Across the Three Abstracts and Chemotherapy Benchmarks
Measure | LBA57 Opamtistomig | 2392O Opamtistomig + EP/EC | TOPIC-NEC EP | 2393O Pumitamig + FOLFIRI | BEVANEC FOLFIRI
Setting | 3L+ EP-NEC | 1L EP-NEC | 1L digestive NEC | 2L NEN after platinum | 2L GEP-NEC or unknown
N | 96 | 69 FAS; 65 efficacy | 84 assigned; 77 measurable | 31 treated; 30 evaluable | 67 treated
ORR | 26.0% | 60.0% confirmed (39/65) | 54.5% | 40.0% confirmed | 18% (11/61)
DCR | 35.4% | 90.8% | Not reported | 86.7% | 57%
Median DOR | 9.8 mo | 10.2 mo | Not reported | 5.9 mo | 5.8 mo
Median PFS | 1.4 mo | 5.7 mo | 5.6 mo | 5.5 mo | 3.5 mo
OS | 8.7 mo; 12-mo 39.4% | NR; 18-mo 55.7% | 12.5 mo; 12-mo 52.1% | 12.8 mo; 12-mo 51.1% | 8.9 mo; 6-mo 60%
Evidence role | Single-arm drug-specific activity | Single-arm first-line signal | Phase III (EP vs IP) | Single-arm second-line signal | Non-comparative randomized phase II
Lu et al., ESMO 2026, LBA57; Zhang et al., ESMO 2026, 2392O; Xu et al., ESMO 2026, 2393O; Morizane et al., JAMA Oncol. 2022 Walter et al., Lancet Oncol. 2023
Jaydira Del Rivero
Herbert Loong, MBBS, FASCO@herbloong
1) Slide: GIST rapid oral abstracts 3717RO, 3718RO, 3719RO summary table by discussant Palma · 2) Response data: Putting GIST approaches together: mPFS and ORR by regimen and setting
A very comprehensive overview of the 3 key #GIST rapid oral abstracts by @dileo_palma.
Developing a rapidly developing field requiring multi-national collaborations in move this collective field forward.
@myESMO #ESMO26 #sarcoma @ctosociety #drugdevelopment https://t.co/ZIs1Bdje9E
[Slide 1]
08:30 - 10:00 Rapid oral: Sarcoma
CHAIRS: MARK DICKSON, PALMA DILEO, CESAR SERRANO
Secondary KIT mutations (exons 13/14/17/18) drive resistance; no single approved TKI covers them all, and 3L + benefit is modest (regorafenib mPFS 4.8 mo, avapritinib 4.2 mo)
Abstract | Strategy | Design / population | Headline result
3717RO Bezuclastinib + sunitinib | Combine complementary TKIs | Peak part 2: crossover after progression on 2L sunitinib (n=128) | mPFS 7.4 mo, ORR 29.7% (vs 5.7 mo, 20.3% on sunitinib)
3718RO Velzatinib ctDNA | Broad-spectrum KIT inhibitor + biomarker | StrateGIST 1 phase 1/1b; exploratory ctDNA analysis, all lines | mKIT clearance by wk 8 (~50% of pts): HR 0.57 for progression/death (0.51–0.65 across wk 2–8)
3719RO NB003 | Broad-spectrum KIT inhibitor | Phase I (n=158 KIT-mutant), median 3 prior TKIs | 3L: ORR 46.7%, mPFS 13.8 mo; 4L: ORR 45.7%, mPFS 11.0 mo; ≥5L: ORR 12.5%, mPFS 3.9 mo
Dr Palma Dileo
Palma Dileo
Invited Discussant 3717RO, 3718RO and 3719RO
MALAGA AUDITORIUM - HALL 3
[Slide 2]
08:30 - 10:00 Rapid oral: Sarcoma
CHAIRS: MARK DICKSON, PALMA DILEO, CESAR SERRANO
Putting it together: where might each approach fit?
Regimen / setting | mPFS (mo) | ORR (%)
Regorafenib (3L, reference) | 4.8 | –
Avapritinib (3L, reference) | 4.2 | –
Bezuclastinib + sunitinib after sunitinib (crossover) | 7.4 | 29.7
NB003, 3L | 13.8 | 46.7
NB003, 4L | 11.0 | 45.7
Bezuclastinib + sunitinib, 2L (Peak main) | 16.5 | 46
Messages for practice and trial design
• Treating earlier is likely better: benefit of combination falls from 16.5 to 7.4 mo after sunitinib failure
• Broad-spectrum single agents (NB003, velzatinib) show activity in heavily pretreated pts; randomized 3L data are awaited
• Combination vs single broad-spectrum agent: unresolved, and the toxicity trade-off differs
• ctDNA could serve all three: early efficacy readout, response-adapted strategies and enrichment, but needs prospective validation
Non-randomized and cross-trial data – not for direct comparison
Dr Palma Dileo
Palma Dileo
Invited Discussant 3717RO, 3718RO and 3719RO
MALAGA AUDITORIUM - HALL 3
Maurício Ribeiro, MD@mauriciofribei1
1) Slide: 3717RO: crossover to bezuclastinib + sunitinib after progression on sunitinib in GIST · 2) Biomarker data: 3718RO: velzatinib mKIT ctDNA clearance as an early biomarker of benefit · 3) Slide: GIST KIT-resistance abstracts take-home messages - Palma Dileo
#ESMO26 #GIST: three nice abstracts tackling the same problem (polyclonal resistance) from different angles. Resistance after imatinib is a mosaic of secondary KIT mutations and no approved KIT inhibitor addresses them all. Kudos to Dr. @RobinL_Jones, Dr Bauer, Dr Chi and Dr @dileo_palma for an excellent session. Great discussion by Dr. Dileo.
🔹 PEAK crossover bezuclastinib + sunitinib (SUT) after PD on 2L SUT:
• ORR 29.7% (56% if best response to SUT was PD);
• mPFS 7.4;
• Gr≥3 TRAEs 39%, discontinuation 2.3%
Caveat: non-randomized, benefit drops from the historical 16.5 mo upfront to 7.4 mo after SUT failure.
🔹 NB003 - final analysis of ph1 (n=158):
• ORR 46.7% in 3L and 45.7% in 4L, 12.5% in ≥5L
• mPFS 13.8 mo (3L), 11.0 mo (4L), 3.9 mo (≥5L)
• Responses across a variety of secondary mutations in ABP and AL.
Caveat: predominant Asian representation (67%), Gr≥3 anemia 55%, CPK rise 49%. Phase 3 GISTAR-1 (vs. Rego) will provide more definitive efficacy data in the 3rd-line setting, but will only accrue in Asia.
🔹 StrateGIST-1 —> longitudinal ctDNA analysis:
• Detectable baseline ctDNA: PFS 7.3 vs 16.6 mo (HR 0.39)
• Clearance (>99% drop in maxVAF) at wk 2/4/8: HR 0.51/0.65/0.57
• Mutation-agnostic maxVAF outperformed mean VAF and Guardant360 score
Caveat: exploratory, landmark bias, not shown independent of imaging or tumour burden. Hypothesis-generating.
💡 Take-Home:
1. Broader KIT coverage is the shared goal, and treating earlier is likely better.
2. Combination vs single broad-spectrum agent is unresolved, with different toxicity trade-offs (and access/costs, once these drugs start getting approved).
3. ctDNA could serve all three strategies, as an early efficacy readout, for response-adapted treatment and for trial enrichment, but needs prospective validation.
#ESMO2026 #ESMOAmbassadors @myESMO #GIST
[Slide 2]
3717RO – Crossover to bezuclastinib + sunitinib after progression on sunitinib
mPFS (months)
Sunitinib 2L (same pts) 5,7
Combination after crossover 7,4
Combination 2L (Peak main) 16,5
Third bar is a different (randomized, first-line-of-combination) population – shown for context only
29.7% ORR on combination (vs 20.3%)
56% ORR if best response to sunitinib was PD
39% Gr≥3 TRAEs (vs 72% upfront)
Encouraging
• Activity after sunitinib failure; 2 CRs in pts with PD on monotherapy
• No new safety signals; low discontinuation (2.3%)
• Supports the biological rationale of covering secondary mutations
Interpret with caution
• Non-randomized part, within-patient sequence, not a head-to-head; 95% CIs overlap (7.4 [5.6–11.0] vs 5.7 [3.8–7.3])
• Selected pts (sunitinib mPFS 5.7 mo here vs 9.2 mo in whole arm); shorter exposure (24 vs 61 wk) may explain lower Gr3+ AEs
• Message is for earlier use: 7.4 mo at crossover vs 16.5 mo upfront
Dr Palma Dileo
[Slide 3]
3718RO – Velzatinib: ctDNA clearance as an early biomarker of benefit
mPFS (months) by mKIT ctDNA clearance (>99% drop in maxVAF)
Cleared | Not cleared
Week 2: 11,0 | 5,0
Week 4: 9,5 | 5,5
Week 8: 11,0 | 5,5
Week 32: 13,7 | 10,4
HR 0.39 Baseline ctDNA detected vs not (PFS 7.3 vs 16.6 mo)
HR 0.51–0.65 Clearance, wk 2 / 4 / 8: HR 0.51 / 0.65 / 0.57 (all P<0.05)
HR 0.55 Week 32; P=0.068 (57% cleared)
Strengths
• Serial sampling; prognostic at baseline and dynamic on treatment
• Mutation-agnostic: maxVAF (KIT/PDGFRA) outperformed mean VAF and G360 score (HR 0.50 vs 0.81 / 0.69; n=73)
• Clearance across exons (67–82%)
Open questions
• Exploratory, ongoing, samples not all analysed; timepoint cohorts differ
• Landmark analysis: later PFS in cleared pts partly reflects survival to sampling
• Not independent of imaging; no adjustment for line or burden shown; maxVAF picked in 73-pt subset (HR 0.50 vs 0.57 in all pts at wk 8)
• Would a clearing-based decision change outcome?
Dr Palma Dileo
[Slide 4]
Take-home messages
1 Resistance in GIST is a mosaic of secondary KIT mutations: broader KIT coverage is the shared goal of all three abstracts.
2 Bezuclastinib + sunitinib rescues some pts after sunitinib failure, but its value is greatest when used earlier.
3 NB003 shows striking 3L/4L activity in a phase I; the randomized phase 3 against regorafenib will be the test.
4 Early mKIT ctDNA clearance on velzatinib tracks with PFS; it is hypothesis-generating and needs validation before guiding treatment.
Dr Palma Dileo
A pancreatic cancer doctor@DanZhaoMD
1) Slide: Forest plot: neoadjuvant vs upfront surgery OS meta-analysis in PDAC · 2) Slide: Forest plot: FOLFIRINOX vs gemcitabine-based regimens in PDAC RCTs
Dr. @BasGrootKoerkam gave a very nice talk about neoadjuvant therapy for PDAC including the respectable patients at #esmo26 pooled data suggesting benefits for neoadjuvant therapy. More evidence favor neoadjuvant therapy for older patients. https://t.co/eBbtgfkR08
[Slide 2]
Diagnosis & ABC staging | 1 Surgery or chemo first? | 2 Which regimen? | 3 Restaging: resect?
Patient 1: Surgery first or chemotherapy first?
Meta-analysis of RCTs (OS)
HR for death (95% CI)
Borderline resectable meta-analysis, n = 677
Resectable meta-analysis, n = 517
CISPD-1 resectable, n = 324
PREOPANC-3 resectable; perioperative vs adjuvant mFOLFIRINOX - Results 2027
Alliance A021806 resectable; perioperative vs adjuvant mFOLFIRINOX - Results 2027
0.60 (0.38–0.96)
0.90 (0.63–1.28)
0.73 (0.53–1.00)
← Favours neoadjuvant | Favours upfront surgery →
GUIDELINE Borderline resectable: chemotherapy first. Resectable: surgery first
Diamonds: meta-analysis (MA) of 9 RCTs incl. PREOPANC-1, PREP-02/JSAP-05, ESPAC-5, NEONAX, NORPACT-1. Square: CISPD-1, after the MA; single centre (China), EFS primary.
Dickerson LD et al. BJS Open 2025; van Dam JL et al. Eur J Cancer 2022 ★; Labori KJ et al. Lancet Gastroenterol Hepatol 2024; Bai X et al. Cancer Cell 2025;43:2259–67
[Slide 3]
Diagnosis & ABC staging | 1 Surgery or chemo first? | 2 Which regimen? | 3 Restaging: resect?
Patient 2: Which neoadjuvant regimen?
RCTs comparing FOLFIRINOX with gemcitabine-based regimens
HR for death (95% CI)
Metastatic and adjuvant
PRODIGE 4 metastatic 0.57 (0.45–0.73)
PRODIGE 24 adjuvant 0.64 (0.48–0.86)
Neoadjuvant and induction
SWOG S1505 † R; vs gem/nab-P 0.96 (0.58–1.59)
PREOPANC-2 R + BR; vs gem-CRT 0.88 (0.69–1.13)
NEOPAN LA; vs gemcitabine 1.02 (0.73–1.43)
← Favours FOLFIRINOX | Favours gemcitabine-based →
CASSANDRA (R + BR)
PAXG vs mFOLFIRINOX
EFS HR 0.63 (0.47–0.84)
OS not yet reported
MY VIEW For patient 2: FOLFIRINOX or gemcitabine-based regimen
† HR reconstructed from published KM curves (Guyot; 32 vs 28 deaths). R/BR/LA, resectable/borderline/locally advanced; gem-CRT, gemcitabine-based chemoradiotherapy
Conroy T et al. N Engl J Med 2011; 2018; Janssen QP et al. Lancet Oncol 2025 ★; Ducreux M et al. J Clin Oncol 2025; Sohal DPS et al. JAMA Oncol 2021; Reni M et al. Lancet 2026
🚨 #ESMO26 | Gastric & GEJ Cancer
From FLOT4 to MATTERHORN: perioperative immunotherapy improves survival without compromising surgical outcomes.
🔬 Next challenge: biomarkers and treatment de-escalation.
@OncoAlert #GastricCancer https://t.co/GA4IBnNOfF
[Slide 1]
Surgery alone is not enough
Landmark trials that shaped the current SoC
[survival curves by pathologic stage: Present p Stage 0, I, IIA, IIB, III, IIIA?, IV, IVA, IVB; Survival (%) vs Years 0–10]
2001: Intergroup 0116 - Adjuvant bolus FL + RT - 20% GEJ
2002: OE02 - Neoadjuvant CF - Oesophageal only
2006: MAGIC - Perioperative ECF
2011: ACTS-GC - Adjuvant S-1; FFCD / FNCLC - Perioperative CF
2012: CROSS - Neoadjuvant carboplatin and paclitaxel + RT - Oesophageal and GEJ only; CLASSIC - Adjuvant CAPOX
2019: FLOT4 / AIO - Perioperative FLOT
2021: RESOLVE - Perioperative or adjuvant SOX; PRODIGY - Neoadjuvant D-Ox-S-1
TOPGEAR - Perioperative chemotherapy ± neoadjuvant CRT
Daniela Molena, MD
[Slide 2]
FLOT 4: Establishing the Benchmark for the Next Generation of Trials
OS in ITT population (%)
FLOT
ECF / ECX
HR, 0.77 (95% CI, 0.63–0.94); p=0.012
Time (months)
No. at risk
FLOT 356 297 231 140 87 39 5
ECF / ECX 360 287 202 126 83 33 9
Primary endpoint results in ITT population:
mOS, 50 vs 35 months (HR, 0.77)
5-year OS, 45% vs 36%
Safety profile:
Toxic deaths, <1% for each group
Treatment-related SAEs, 27% vs 27%
1. Demonstrated an overall survival advantage
2. Improved pathological and surgical outcomes
3. Established a reproducible perioperative backbone
4. Became the standard of care for fit patients
5. Provided the foundation for immunotherapy trials
Daniela Molena, MD
Al-Batran SE, et al., Lancet 2019
Survival table
Endpoint: OS (ITT)
FLOT | 356 | 50 months
ECF / ECX | 360 | 35 months
HR: 0.77
HR CI: 0.63–0.94
P: 0.012
Landmark rates:
5-year: FLOT 45% | ECF / ECX 36%
[Slide 3]
MATTERHORN: A New Standard Is Born
0.71 EFS hazard ratio
67.4% 2-year EFS with durvalumab
19.2% Pathological complete response
2-year EFS
Durvalumab + FLOT 67.4%
FLOT alone 58.5%
pCR
Durvalumab + FLOT 19.2%
FLOT alone 7.2%
Durvalumab + FLOT | FLOT alone
| Durvalumab + FLOT (n=474) | Placebo + FLOT (n=474)
Median EFS, months (95% CI) | NR (40.7–NR) | 32.8 (27.9–NR)
HR (95% CI) | 0.71 (0.58–0.86)
Stratified log-rank p-value | <0.001
Daniela Molena, MD
Janjigian YY, et al. N Engl J Med 2025
[Slide 4]
Better Systemic Therapy, but Surgery Remains Central
18-mo OS Δ: 4.0 81.1% 77.1%
24-mo OS Δ: 5.1 75.5% 70.4%
36-mo OS Δ: 6.7 68.6% 61.9%
+34.5%
41%
Durvalumab + FLOT
Placebo + FLOT
FLOT (FLOT4 Trial)
ECF/ECX (FLOT4 Trial)
Surgery alone (Magic)
Median (range) duration of follow-up, mo
Durvalumab + FLOT: 43.0 (3.4–57.0)
Placebo + FLOT: 42.9 (0.0–56.5)
Time since randomization (mo)
No. of participants at risk | Total no. of events
Durvalumab + FLOT 474 464 438 422 403 389 377 367 351 338 334 323 316 255 182 112 71 29 6 1 0 | 160
Placebo + FLOT 474 457 439 414 395 374 355 338 324 310 298 293 278 221 167 99 61 23 7 0 0 | 192
Daniela Molena, MD
Survival table
Endpoint: OS (MATTERHORN, with FLOT4/MAGIC historical overlays)
Durvalumab + FLOT | 474
Placebo + FLOT | 474
Landmark rates:
18-mo: Durvalumab + FLOT 81.1% | Placebo + FLOT 77.1%
24-mo: Durvalumab + FLOT 75.5% | Placebo + FLOT 70.4%
36-mo: Durvalumab + FLOT 68.6% | Placebo + FLOT 61.9%
Vilma P. Barcia MD, PhD, MSc@DrVilmaPBarcia
1) Slide: Perioperative therapy in 2026: what have we learned? (Daniela Molena, gastric/GEJ) · 2) Slide: Perioperative therapy in 2026 summary - partial build (points 1-2) (Daniela Molena) · 3) Slide: The future: escalate, maintain or de-escalate perioperative therapy · 4) Biomarker data: ctDNA: detecting residual risk, not proving cure (Daniela Molena)
#ESMO26 | Gastric Cancer
Key takeaways:
- Durvalumab + FLOT improves survival.
- Surgery remains central. - cCR ≠ cure. - MSI-H/dMMR & ctDNA may guide personalization.
🎯 The future: not more treatment, but the RIGHT treatment.
@OncoAlert https://t.co/6wjrndC3NP
[Slide 1]
Perioperative Therapy in 2026: What Have We Learned?
1. Chemoimmunotherapy is changing the standard of care.
MATTERHORN demonstrates improved survival with durvalumab + FLOT in resectable gastric/GEJ cancer
2. Surgery remains central to curative-intent treatment.
Modern perioperative strategies improve outcomes while preserving surgical delivery
3. Response is important, but not synonymous with cure.
pCR is prognostic; cCR cannot yet reliably exclude residual disease or justify routine omission of surgery
4. The future is biomarker-driven personalization.
MSI-H/dMMR opens opportunities for de-escalation; ctDNA may help guide future treatment decisions
Daniela Molena, MD
[Slide 2]
Perioperative Therapy in 2026: What Have We Learned?
1. Chemoimmunotherapy is changing the standard of care.
MATTERHORN demonstrates improved survival with durvalumab + FLOT in resectable gastric/GEJ cancer
2. Surgery remains central to curative-intent treatment.
Modern perioperative strategies improve outcomes while preserving surgical delivery
Daniela Molena, MD
[Slide 3]
The Future: Escalate, Maintain, or De-escalate?
Personalizing Perioperative Therapy: The Next Frontier
ESCALATE - Persistent molecular disease or high-risk biology - Investigate intensified systemic therapy
MAINTAIN - Most patients with resectable disease - Evidence-based perioperative therapy + high-quality surgery
DE-ESCALATE - MSI-H/dMMR and exceptional responders - Chemotherapy-free strategies; organ preservation in clinical trials
The future is not more treatment for everyone, but the right treatment for each patient.
Daniela Molena, MD
[Slide 4]
ctDNA: Detecting Residual Risk, Not Proving Cure
Beyond Clinical Response: Can ctDNA Close the Gap?
After neoadjuvant therapy
Endoscopy + imaging + biopsies + molecular assessment
ctDNA undetectable - Associated with lower recurrence risk in some cohorts - Does not exclude residual local or nodal disease
ctDNA detectable - May identify molecular residual disease and increased recurrence risk - Whether treatment escalation improves survival remains under investigation
Can molecular response guide treatment escalation or de-escalation?
ctDNA complements clinical assessment; it does not yet establish pathological complete response.
Daniela Molena, MD
Katy Beckermann@katy_beckermann
1) Slide: ASTRA agentic system overview for tumor resectability assessment · 2) Trial design schema: ASTRA study design: retrospective, reader study, prospective validation · 3) Slide: 172RO ASTRA prospective validation: resectability confusion matrices, decision time and report
#ESMO26 Agentic AI in perihilar cholangiocarcinoma, tested prospectively: surgeons alone vs surgeons plus ASTRA, 29 patients each. Decision time dropped from 518 to 255 seconds.
🎯 False-positive unresectable calls: 0 of 18 radiologic and 0 of 7 clinical, vs 4 of 19 and 3 of 7. Sensitivity 90.9% vs 90.0% radiologic, 86.4% vs 77.3% clinical
⚠️ 29 per arm, one tumor type, and the discussant's question is tool-calling reliability
Hypothesis-generating. Human sign-off stays. Exciting to see the scalability and prospective validation of such type of tools
#ESMO26 #AIinMedicine #ClinicalAI #GUonc
[Slide 2]
ASTRA System Overview
ASTAR: Agentic System for Tumor Resectability Assessment
INPUT
Multimodal patient data
Specialized agents
• Data Aggregator
Consolidates multimodal clinical data
• Radiology Report Interpreter
Converts free-text MR reports into structured reports
• Surgical Candidacy Assessor
Assesses radiologic unresectability
• Multidisciplinary Consensus Simulator
Integrates clinical evidence to assess clinical unresectability
OUTPUT
• Structured MR report
• Unresectability
1 Input (Task, context) PACS EHR Curated guidelines
2 Observations (Reasoning, Planning) pCCA? Tool calls
3 Agentic Workflow (Human in the loop, RAG) Guidelines search Human interaction
4 Output (Structured report, Resectability)
Data Aggregator Agent: PACS EHR → MR report, Blood test, Medical record, Image report
Radiology Report Interpreter Agent: Free-text MR report → Structured MR report → Signed structured report
Surgical Candidacy Assessor Agent: Structured MR report → Radiologic Unresectability Yes / NO
Multidisciplinary Consensus Simulator Agent: Medical records, Image report, Test report → Clinical Unresectability Yes / NO
[Slide 3]
Study Design
Retrospective Evaluation → Reader study → Prospective validation → Silent trial
n =518 — Foundation model selection benchmark
n =104 — Unaided vs ASTRA-assisted
n =53 — Blinded vs expert MDT consensus
n =29 n =29 — Clinical co-pilot
Outcomes assessed
• Resectability assessment accuracy
• Report structuring accuracy
• Inter-rater agreement
• Pre-MDT report quality
• Pre-MDT briefing time
[Slide 4]
172RO (Huang et al)
1 Input (Task, context) PACS EHR Curated guidelines
2 Observations (Reasoning, Planning) pCCA? Tool calls
3 Agentic Workflow (Human in the loop, RAG) Guidelines search Human interaction
4 Output (Structured report, Resectability)
Data Aggregator Agent / Radiology Report Interpreter Agent / Surgical Candidacy Assessor Agent / Multidisciplinary Consensus Simulator Agent
Prospective validation
March 2025 - April 2026 External Validation
Surgeons only n =29 ← Real-world Deployment → Surgeons + ASTRA n =29
ASTRA performance: Accuracy/Recall/Precision/F1; Report quality score (Completeness, Correctness, Necessity, Safety)
Primary outcomes: Decision accuracy; Decision efficiency
Secondary outcomes: Report quality score (Completeness, Correctness, Necessity, Safety); User acceptance survey
ASTRA performance: Report structuring performance; Radiologist modification rate; Adoption rate
E Radiologic Unresectability
Control group (Ground Truth rows Yes/No; predicted No/Yes): Yes: 10.00% n=1 | 90.00% n=9; No: 78.95% n=15 | 21.05% n=4
Intervention group: Yes: 9.09% n=1 | 90.91% n=10; No: 100.00% n=18 | 0.00% n=0
Clinical Unresectability
Control group: Yes: 22.73% n=5 | 77.27% n=17; No: 57.14% n=4 | 42.86% n=3
Intervention group: Yes: 13.64% n=3 | 86.36% n=19; No: 100.00% n=7 | 0.00% n=0
F Time(s): 518 vs 255 ***
G Completeness: Control 5.2 / 48.3 / 32.8 / 13.8; Intervention 43.1 / 56.9
Correctness: Control 32.8 / 29.3 / 15.5 / 22.4; Intervention 27.6 / 55.2 / 10.3 / 6.9
Necessity: Control 3.4 / 39.7 / 34.5 / 22.4; Intervention 55.2 / 34.5 / 10.3
Safety: Control 1.7 / 34.5 / 27.6 / 10.3 / 25.9; Intervention 36.2 / 50 / 5.2 / 8.6
Score scale 5 4 3 2 1
Control Group Intervention Group
Marco Lorenzi - Agentic AI for cancer decision-making (172RO and 280RO)
Andrea Martirena@AndreaMartirena
Slide: Poster 1722eP: Long-term non-progressors on atezolizumab + bevacizumab for advanced HCC
Glad to have contributed to this real-world study from @RoyalFreeNHS, presented at #ESMO26 by @SamRozaOfficial.
📊 32% remained progression-free ≥12 months.
🔎 41.5% of patients with stable disease achieved long-term benefit.
Great collaboration with the Royal Free team! https://t.co/ksAZvjZpcI
Characterising long-term non-progressors receiving Atezolizumab and Bevacizumab for advanced hepatocellular carcinoma (HCC)
Dr Sam Rozewicz¹; Dr Andrea Martirena²; Menon Shanthakumar¹; Dr Robert Goldstein¹; Prof Timothy Meyer¹; Dr Alexa Childs¹
¹Royal Free Hospital, London, UK. ²Fundación Jiménez Díaz University Hospital, Madrid, Spain
NHS Royal Free London NHS Foundation Trust
Introduction:
• Atezolizumab and bevacizumab (AB) is an established first line treatment for advanced HCC. Despite an objective response rate (ORR) of 30% and improved median overall survival (mOS) compared with sorafenib, over 60% of patients receiving AB will progress within 12 months of starting treatment.
• In this study we aimed to characterise long-term non-progressors (LTNP) and assess clinicopathological factors associated with sustained benefit from AB in a real-world cohort.
Methods:
• Patients treated with AB at The Royal Free Hospital (London) between July 2020 and December 2024 were identified from MDT records and clinicopathological characteristics and survival outcomes retrospectively reviewed. Radiological response was assessed every 9-12 weeks using RECIST v1.1.
• We compared LTNP, defined as patients with progression-free survival of ≧12 months from treatment initiation with short-term progressors (STP), those who progressed <12 months.
Results:
Figure 1. Proportion of LTNP vs STP — Total 166 patients; LTNP (n=54) 32%; STP (n=112) 68%
Figure 2. Kaplan Meier Estimates of Overall Survival — mOS LTNP 29.2mths vs STP 7.7 mths HR 0.19 (95% CI 0.13-0.3)
• At 18 mths, 63% of LTNP had not progressed.
• Median treatment duration was 15 mths in LTNP v 2.8 mths in STP (p<0.01).
• 26.4% of LTNP discontinued B before A due to AE v 7.1% STP (p<0.01).
• For LTNP that did stop B, median time on treatment with both agents was 12.5 mths.
Table 1. Patient Characteristics
Patient characteristics | Overall, n=166 (%) | LTNP, n=54 (%) | STP, n=112 (%) | p value
Age, years, median | 70 | 71 | 69 | 0.625
Male gender | 143 (86.1) | 51 (94.4) | 92 (82.1) | 0.032
ECOG 0 | 78 (47) | 32 (59.3) | 46 (41.1) | 0.143
ECOG 1 | 82 (49.4) | 21 (38.9) | 61 (54.5) |
ECOG 2+ | 6 (3.6) | 1 (1.9) | 5 (4.5) |
Cirrhosis present | 117 (70.5) | 39 (72.2) | 78 (69.9) | 0.733
Aetiology of CLD — MASLD | 38 (22.9) | 13 (24.1) | 25 (22.3) | 0.833
ArLD | 30 (18.1) | 10 (18.5) | 20 (17.9) |
Viral hepatitis | 54 (32.5) | 18 (33.3) | 36 (32.1) |
Other | 18 (10.8) | 7 (13.0) | 11 (9.8) |
Portal vein thrombus | 72 (43.4) | 20 (37.0) | 52 (46.4) | 0.253
Extra-hepatic spread present | 29 (17.6) | 5 (9.3) | 24 (21.6) | 0.05
AFP ng/ml, median | 30.1 | 10.6 | 56.2 | 0.411
ALBI Grade 1 | 113 (68.1) | 39 (72.2) | 74 (66.1) | 0.436
ALBI Grade 2 | 53 (31.9) | 15 (27.8) | 38 (33.9) |
• LTNP were more likely to be male (94.4% v 82.1%, p=0.03) and less likely to have extra-hepatic disease (9.3% v 21.6%, p=0.05).
• There were no significant differences in other baseline characteristics: portal vein involvement, baseline AFP, ALBI grade, prior HCC therapy, ECOG PS, presence of cirrhosis and aetiology of liver disease.
• LTNP discontinued therapy due to PD (n=19), AE (9), liver decompensation (7) and death (4).
Figure 3. Radiological response per RECIST 1.1 in LTNP vs STP
Objective Response Rate (ORR) (CR + PR): LTNP (n=54) 58.5% | STP (n=112) 11.5% | p < 0.01
Stable Disease (SD): LTNP 41.5% | STP 29.2% | p < 0.01
• LTNP experienced higher ORR compared to STP
Figure 4. Frequency and management of ImAE in LTNP vs STP
Patients experiencing ImAE (% of patients): LTNP 37.7% | STP 23.0% | p=[illegible]
Stopped treatment due to ImAE (% of those with ImAE): LTNP 25.0% | STP 46.2% | p=[illegible]
Conclusion:
In this single centre, real world cohort, we demonstrate that 32% patients treated with first-line AB are LTNP which in turn is associated with improved survival. Objective radiological response is the strongest predictor of LTNP but 41.5 % of those with SD will also achieve LTNP.
FPN: 1722eP
Contact: Dr Sam Rozewicz
Email: samuel.Rozewicz@nhs.net
Disclosure statement: No conflicts of interest to declare
Vilma P. Barcia MD, PhD, MSc@DrVilmaPBarcia
1) Slide: Esophageal cancer: EFS CRT vs chemo +/- IO after surgery · 2) Kaplan-Meier survival data: Esophageal cancer: EFS by pCR status, CRT vs CT + · 3) Response data: Can clinical complete response replace pathological confirmation? · 4) Response data: Clinical complete response: what we can assess vs may miss
🚨 #ESMO26 | Upper GI
Can clinical complete response replace surgery?
🔬 cCR ≠ pCR ≠ cure. Imaging and biopsies may miss residual disease.
⚠️ Higher pCR does not necessarily mean better survival.
🎯 Is organ preservation the future?
@OncoAlert https://t.co/pHfatfcrc5
[Slide 1]
Higher pCR Does Not Necessarily Mean Better Survival
Event-free survival CRT vs Chemo ± IO
CRT
Chemo ± IO
HR = 0.59; P = 0.012
Years since Surgery
At Risk / Events rows [illegible]
• 650 (80%) CRT; 161 (20%) Chemo ± IO
• Median follow-up 29.9 months
• pCR higher in CRT (23% vs 14%)
• pN0 higher in CRT (61% vs 46%; both P < .001)
• R0 resection 96% in both groups
• 2-year EFS greater in Chemo ± IO (66% vs 53%; adjusted hazard ratio, 0.53; P = .007)
• 2-years OS not statistically different between groups
Daniela Molena, MD
Alkaali A, et al. JTCVS 2026
Survival table
Endpoint: Event-free survival
CRT | 650
Chemo ± IO | 161
HR: 0.59
P: 0.012
Landmark rates:
2-year: Chemo ± IO 66% | CRT 53%
[Slide 2]
pCR Is Prognostic, but Does Treatment Modality Matter?
Patients WITH pCR
n = 174
log-rank p = 0.024
HR not estimable (0 events in CT ± IO)
Patients WITHOUT pCR
n = 637
log-rank p < 0.001
HR 0.54 (95% CI 0.39–0.73)
Event-free survival (%)
Months from surgery
No. at risk
WITH pCR: CRT 151 113 91 67; CT ±IO 23 16 8 1
WITHOUT pCR: CRT 499 254 176 122; CT ±IO 138 85 37 10
— CRT — CT ± IO
• 650 (80%) CRT; 161 (20%) Chemo ± IO
• Median follow-up 29.9 months
• CRT achieves more regression
• Poor response (CAP 3) is 2.5× more common with CT ± IO (38% vs 15%)
• pCR after Chemo ± IO reflects local and systemic control
Daniela Molena, MD
Molena D., et al. ISDE oral presentation 2026
Survival table
Endpoint: Event-free survival by pCR status
WITH pCR (CRT 151 / CT±IO 23) | 174
WITHOUT pCR (CRT 499 / CT±IO 138) | 637
HR: 0.54 (without-pCR subgroup)
HR CI: 0.39–0.73
P: <0.001 (without pCR); 0.024 (with pCR)
[Slide 3]
FROM RESPONSE TO TREATMENT DECISIONS
Can Clinical Complete Response Safely Replace Pathological Confirmation?
pCR - Confirmed in resected tissue
cCR - Estimated by clinical testing
Cure - Demonstrated by durable outcomes
These are related, but not interchangeable endpoints.
Daniela Molena, MD
[Slide 4]
Clinical Complete Response: Can We Trust What We Cannot See?
What we can assess
• Endoscopy and biopsies
• EUS ± FNA
• CT and PET imaging
• Clinical examination
What we may miss
• Microscopic residual tumor
• Submucosal or deeper viable disease
• Residual nodal metastases
• Occult distant disease
cCR ≠ pCR ≠ Cure
Negative clinical assessments reduce suspicion of residual disease; they do not establish its absence.
Daniela Molena, MD
Prof Tom John@TommyJohn00
1) Response data: ppmSeq PCR-free error-corrected WGS for tumour-informed MRD (schematic) · 2) Biomarker data: ctDNA positivity and tumour fraction across post-op timepoints (WGS MRD cohort) · 3) Biomarker data: Tumour fraction at first ctDNA detection by recurrence site
Two diff presentations from Wan (Uk) and Tsukada (Japan): Really interesting data in CRC and NSCLC using WGS of plasma and tissue. Two diff methods, but equally sensitive with very low LOD. MRD+ = poorer outlook.
#LCSM #ESMO26 https://t.co/ZNqo7sxXDZ
[Slide 1]
ppmSeq reads both strands of each cfDNA molecule
PCR-free, error-corrected whole-genome sequencing (Ultima Genomics)
Standard WGS
Error or mutation?
PCR and sequencing errors contribute to sequencing noise
ppmSeq
Both strands: consensus call | One strand: likely error
Errors are removed using information from both strands
Tumour-informed MRD
Tumour (FFPE/FF) → Tumour WGS (CRAM); Normal (buffy coat) → Normal WGS (CRAM) → Somatic variant calling → Somatic variants (VCF)
cfDNA (plasma) [illegible] → Plasma WGS (CRAM) → Personalised variant query → ctDNA fraction (ppm); MRD status (landmark)
Schematic adapted from Ultima Genomics
[Slide 3]
ctDNA Positivity and Tumor Fraction across Timepoints
Distribution of tumor fraction
Tumour fraction (ppm) • Detected ○ Not detected
ultrasensitive level (< 100 ppm)
Baseline n = 233 | 100% positive
Post-1M n = 240 | 21.2% positive
Post-3M n = 218 | 14.7% positive
Post-6M n = 180 | 8.9% positive
Post-9M n = 125 | 12.8% positive
Post-12M n = 83 | 7.2% positive
Proportion of ultrasensitive detection
Baseline 9.4%
Post-1M 52.9%
Post-3M 50.0%
Post-6M 50.0%
Post-9M 50.0%
Post-12M 16.7%
Detection rate (%) — Detected ≥ 100 ppm / Detected < 100 ppm / Not detected
• ctDNA was detected in 100% of baseline samples (233/233).
[Slide 4]
Tumor Fraction by Recurrence Sites
Tumor fraction at first detection by the site of subsequent recurrence
Site of recurrence | n | Median tumor fraction at first detection | First detection < 100 ppm
Lung only | 5 | 29 ppm | 3/5
Peritoneum only | 2 | 943 ppm | 1/2
Other/multiple | 5 | 1,192 ppm | 0/5
Liver only | 11 | 1,455 ppm | 4/11
Vilma P. Barcia MD, PhD, MSc@DrVilmaPBarcia
1) Slide: Esophageal SCC: neoCRT vs neoCTx - pCR, recurrence pattern, non-cancer mortality · 2) Kaplan-Meier survival data: JCOG1109 NExT trial: OS neo-CF vs DCF and vs CF+RT · 3) Kaplan-Meier survival data: JCOG9907: neoadjuvant vs adjuvant CF in resectable · 4) Slide: NEOCRTEC5010: neoCRT + surgery vs surgery in ESCC - OS and DFS (Ken Kato)
#ESMO26 | Esophageal SCC: Higher pCR ≠ better outcomes.
- NeoCRT improves pCR vs chemotherapy (JCOG1109: 36.7% vs 18.6%).
- Higher distant recurrence with neoCRT (18.5% vs 12.5%).
- Higher non-cancer mortality (13.7% vs 4.5%).
@OncoAlert @myESMO https://t.co/OFT3sIo9XB
[Slide 1]
Which is optimal treatment; neoCRT or neoCTx?
➢ Better local tumor response with neoCRT than with chemotherapy alone:
• CROSS: pCR 49% in the OSCC subgroup
• JCOG1109: pCR 36.7% with neoCRT, 18.6% with triplet CTx
• NeoRes: pCR 28% with neoCRT, 9% with doublet CTx
P van Hagen et al, N Engl J Med 366:2074-84, 2012
Kato K, et al Lancet 2024. 404(10447):55-66.
Klevebro et al, Ann Oncol 27:660-667, 2016
➢ Different pattern of recurrence following neoCRT vs. neoCTx:
• CROSS: 5-year distant-only recurrence 27% with neoCRT and 28% with surgery alone
• JCOG1109: 5-year distant-only recurrence 18.5% with neoCRT and 12.5% with triplet CTx
➢ Tendency of higher non-cancer mortality following neoCRT:
• CROSS: 5-year non-cancer death 15% with neoCRT and 11% with surgery alone
• JCOG1109: 5-year non-cancer death 13.7% with neoCRT and 4.5% with triplet CTx
• NeoRes: 5-year non-cancer death 12.2% with neoCRT and 8.8% with doublet CTx
Eyck BE et al, J Clin Oncol; 20;39(18):1995-2004. 2021
Kato K, et al. J Clin Oncol 42(16_suppl): 4082, 2024
Von Dobeln GA, et al. Dis Esophagus 32(2): 1-11, 2019
Ken Kato, MD, PhD
[Slide 2]
JCOG1109 "NExT Trial"
Thoracic ESCC cStage II/III (UICC-TNM 7th) PS 0-1, 20-75 y.o.
Primary endpoint: Overall survival
Secondary endpoint: PFS, pCR, Safety
R → Neo-Doublet Chemotherapy : 5-FU+CDDP x2 / Neo-Triplet Chemotherapy: 5-FU+CDDP+Docetaxel x3 / Neo Doublet Chemoradiotherapy: 5-FU+CDDPx2 +RT 41.4Gy → Esophagectomy With D2-3 LN dissection
Overall survival : Neo CF vs Neo DCF
3 years: 72.1% | 62.6%
HR = 0.68(0.50-0.92) p = 0.006 (< 0.025)
No. of patients | Median (95% CI): Doublet chemotherapy 199 | 5.6y (3.9y-NE); Triplet chemotherapy 202 | NR (6.7y-NE)
Hazard ratio (95% CI) 0.68 (0.50-0.92), stratified log-rank test one-sided p = 0.006
No. at Risk: [Doublet] chemotherapy 199 178 143 123 98 66 38 19 4 0; [Triplet] chemotherapy 202 182 156 143 113 82 56 26 8 0
Overall survival : Neo CF vs Neo CF+RT
3 years: 68.3% | 62.6%
HR = 0.84(0.63-1.12) p = 0.12
No. of patients | Median (95% CI): Doublet-chemotherapy 199 | 5.6 y (3.9y-NE); Doublet-chemotherapy plus radiotherapy 200 | 7.0 y (5.2y-NE)
Hazard ratio (95% CI) 0.84 (0.63-1.12), stratified log-rank test one-sided p = 0.12
No. at Risk: Doublet-chemotherapy 199 178 143 123 98 66 38 19 4 0; Doublet-chemotherapy plus radiotherapy 200 182 151 133 111 79 47 19 4 0
Years after randomization
Ken Kato, MD, PhD
Kato K, et al Lancet 404(10447):55-66, 2024
Survival table
Endpoint: Overall survival (JCOG1109)
Arm | N | Median | Median CI
Neo-doublet CF | 199 | 5.6 y | 3.9y-NE
Neo-triplet DCF | 202 | NR | 6.7y-NE
Neo CF+RT | 200 | 7.0 y | 5.2y-NE
HR: DCF vs CF 0.68; CF+RT vs CF 0.84
HR CI: 0.50-0.92; 0.63-1.12
P: 0.006 (one-sided, <0.025); 0.12
Landmark rates:
3 years: Neo-triplet DCF 72.1% | Neo-doublet CF 62.6% | Neo CF+RT 68.3%
[Slide 3]
JCOG9907
Resectable, SCC (100%) cStage II/III Age 20-75 y.o PS0-1, No prior TX
Primary endpoint : PFS; Secondary endpoint : OS
R → Esophagectomy+ D-2or3 LN dissection → Adjuvant Chemotherapy : CDDP/5-FUx2course (expect pN0)
R → Neoadjuvant Chemotherapy : CDDP/5-FUx2 course → Esophagectomy+ D-2or3 LN dissection
Progression Free Survival: Pre group (n = 164); Post group (n = 166)
Hazard Ratio0.84 (95% CI 0.63–1.11)
Number at risk: Post 166 110 80 66 49 35 24 17 14; Pre 164 115 93 80 59 42 25 18 7
Overall Survival: Pre group (n = 164); Post group (n = 166)
Hazard Ratio0.73 (95% CI 0.54–0.99, P=0.04)
Number at risk: Post 166 138 112 84 55 38 24 17 14; Pre 164 147 119 102 76 53 30 22 11
Years
Ken Kato, MD, PhD
Ando et al.; Ann Surg Oncol.;19(1):68-74, 2012
Survival table
Endpoint: PFS (primary) and OS, JCOG9907
Pre group (neoadjuvant CF) | 164
Post group (adjuvant CF) | 166
HR: PFS 0.84; OS 0.73
HR CI: PFS 0.63–1.11; OS 0.54–0.99
P: OS 0.04
[Slide 4]
NEOCRTEC5010
ESCC T1-4N1M0/T4N0M0 18-70yo PS0-1
Primary endpoint : Overall survival
R → Surgery (n=227) / NeoCRT (40.0Gy)+Surgery(n=224) (Vinorelbine+CDDP)
Overall survival: Group CRT / Group S
HR, 0.71 (95% CI, 0.53 to 0.96); P = .025
Disease free survival: Group CRT / Group S
HR, 0.58 (95% CI, 0.43 to 0.78); P = .000
Follow-up (months)
Ken Kato, MD, PhD
Yang H et al, J Clin Oncol 36:2796-2803, 2018
Survival table
Endpoint: OS (primary) and DFS, NEOCRTEC5010
NeoCRT + Surgery (Group CRT) | 224
Surgery (Group S) | 227
HR: OS 0.71; DFS 0.58
HR CI: OS 0.53 to 0.96; DFS 0.43 to 0.78
P: OS .025; DFS .000 (as printed)
Annie Wong 黃毅敏@anmwongNZ
1) Slide: Lesion size and total burden vs response: T-VEC and RP1 + nivolumab (Kirane, ESMO 2026 melanoma) · 2) Slide: Surgical principles of TIL procurement and site selection table (Kirane, ESMO 2026) · 3) Slide: Case 2: TIL procurement and palliation in one operation (Kirane, ESMO 2026)
Size does matter (for intralesional injections/TIL) in #melsm #ESMO26
Really informative talk @amandakirane
@StanfordMed https://t.co/M26SQELbHi
[Slide 1]
Lesion size and total burden both associate with response
T-VEC
Response probability by lesion size, n = 27
[Curve: Probability of response, % vs Maximum lesion diameter, mm (0-60)]
50% at 1.5 cm, under 10% above 3 cm
RP1 + nivolumab
ORR by total target-lesion size, n = 140
20 mm or less | 63%
21 to 50 | 39%
51 to 100 | 35%
101 to 150 | 15%
more than 150 | 12%
63% at 20 mm or less, 12% above 150 mm
Masoud SJ et al. Ann Surg Oncol 2019;26:4633. Yamada MM et al. JITC 2025;13:e013564. FDA CTGTAC briefing document, 30 July 2026.
[Slide 2]
Surgical principles of TIL procurement
Choose the site for the product and the patient
Lymph node and subcutaneous metastases first; manufacture failure 2.8% from nodes, 19.4% from subcutaneous tissue
Minimize morbidity, preserve fitness for lymphodepletion
Complications in 17% of 93 procurements, almost all Clavien-Dindo I to II; recovery about 21 days
The hybrid patient
Can harvest and palliation be one operation?
Site selection
Tumor Size | 1.5 cm or greater
Tumor Location | Risk of contamination: avoid intraluminal sites
Extent of Surgery | Complete resection often easier but not necessary; Low threshold for drain to avoid infected seroma during subsequent therapy
Pathologic features | Reduce adiposity and necrotic tissue; Tumor periphery may be enriched for TIL
Prior Therapy | Assessment of radiographic response to prior therapies, areas of progression; Caution in sites in prior radiation fields or previous infections. In general, harvest from prior radiated area only when there is progression after radiation
Tas L et al. Br J Surg 2025;112:znaf090. Kirane and Ariyan, J Cell Ther 2024. Table from prior lecture.
[Slide 3]
Case 2. Procurement and palliation in one operation
Progression on anti-PD-1 → Referred for TIL: post-RT axillary tumor, deemed unresectable → Open wound into tumor: Superinfection and sepsis → One operation: TIL procured from a separate site; axillary resection with latissimus advancement flap → Lymphodepletion and infusion → Complete response to TIL
Axillary tumor and wound: Bulky axillary tumor; Open wound into tumor; Recurrent infection and sepsis
Resection and flap: Palliative resection + latissimus flap; Posterior donor site; TIL procurement from a separate site
After TIL: Systemic response — Before TIL / After TIL; H&N nodes; Pancreatic mass; Peritoneal nodules; PET schematic; Recovered for lymphodepletion and TIL; Resolution of previously avid disease
Schematic depiction of the clinical course. PET findings illustrated from the case description, not actual patient scans.
Lorenza Rimassa@LorenzaRimassa
Slide: What makes arcotatug tavatecan different? — Filippo Pietrantonio, MD (ESMO 2026 discussant, gastric/GEJ)
@FilippoPietran4 discussing abstracts of systemic therapies for patients with gastric, esophageal, and GEJ cancer across stages at #ESMO26 #ESMOAmbassadors
@myESMO @LizzySmyth1 https://t.co/NOPx2CfgMe
What makes arcotatug tavatecan different?
A CLDN18.2-targeted "delivery vehicle", rather than an immune-effector antibody
Arcotatug tavatecan DAR 4:1
[Antibody-drug conjugate schematic with labels:] Anti-CLDN18.2-antibody; Exatecan payload TOPO I inhibitor; Glycan-based conjugated cleavable linker; Fc-silenced to mitigate side effects
Selectively delivers cytotoxin into CLDN18.2+ tumours
➢ CLDN18.2 ADC: internalization releases exatecan, a potent TOP1 inhibitor with bystander killing; myelosuppression is the main toxicity.
➢ Fc-silenced design minimizes ADCC/CDC, distinguishing it from zolbetuximab and potentially reducing on-target/off-tumor gastric mucosal toxicity.
➢ CLDN18.2 expression levels and heterogeneity may be particularly relevant for effective payload delivery.
Filippo Pietrantonio, MD
Liu J et al, Nat Med 2025; Shitara et al, ESMO 2026
Elene Mariamidze@EMariamidze
1) Slide: BTC: delayed diagnosis an ongoing issue slide (Lamarca, ESMO 2026 educational session) · 2) Slide: BTC: precision medicine is real - targetable alterations in advanced BTC slide
Amazing talk about btc by our one and only @DrAngelaLamarca
#ESMOAmbassadors #ESMO26
@myESMO https://t.co/YD2lJGmjgJ
[Slide 1]
BTC: Delayed Diagnosis an Ongoing Issue1
- 35 patients: iCCA (42.9%), dCCA (17.1%), gallbladder (14.3%), ampullary (14.3%) and pCCA (11.4%)
- The majority of patients (60%) had metastases at diagnosis. Only 37.1% underwent surgery and 17.1% received no treatment
1 Treatment options [pie]: Surgery 37.1% | No treatment 17.1% | First-line treatment 45.8%
Conclusion
- Biliary tumors are often diagnosed at advanced stages due to significant diagnostic delays caused by non-specific symptoms.
- These delays limit curative treatment options and worsen prognosis.
- Improved early detection strategies and awareness are crucial to enhancing outcomes and survival rates.
BTC, biliary tract cancer; dCCA, distal cholangiocarcinoma; iCCA, intrahepatic cholangiocarcinoma; pCCA, perihilar cholangiocarcinoma.
1. Martirena A et al. Presented at CCF 2025.
[Slide 2]
BTC: Precision Medicine is Real1
Advanced BTC [pie]: GBC (35%) | eCCA (30%) | iCCA (25%) | AMP (5%)
Distribution of targetable alterations in advanced BTC [stacked bars for iCCA, eCCA, GBC]
Categories: FGFR2 fusions; FGFR2 mutations; IDH1 mutation; IDH2 mutation; HER2 overexpression; HER2 mutation; BRAF V600E; MSI-H/dMMR; TMB-high; RET fusion; NTRK fusion; NRG1 fusion; RAS mutations; MTAP deletion; MDM2 amplification; MET amplification; Others
Approved therapies [legend]
Overview of the main potentially targetable alterations identified in advanced BTC (aBTC). It is expected that half of patients diagnosed with aBTC will have a diagnosis of eCCA, followed by iCCA (one quarter) and GBC (one quarter). Within the targetable alterations, FGFR2 fusions and IDH1 mutations are most frequent in iCCA, while HER-2 amplifications are mainly seen in eCCA and GBC. Other alterations seem to have a similar distribution within BTC subgroups. Green bars highlight the targets with approved therapies; many others are currently in development.
aBTC, advanced biliary tract cancer; AMP, ampullary tumor; BRAF, B-Raf proto-oncogene; BTC, biliary tract cancer; dMMR, deficient mismatch repair; eCCA, extrahepatic cholangiocarcinoma; FGFR2, fibroblast growth factor receptor 2; GBC, gallbladder cancer; HER2, human epidermal growth factor receptor 2; iCCA, intrahepatic cholangiocarcinoma; IDH1/2, isocitrate dehydrogenase 1/2; MDM2, mouse double minute 2 homolog; MET, mesenchymal-epithelial transition factor; MSI-H, microsatellite instability-high; MTAP, methylthioadenosine phosphorylase; NRG1, neuregulin 1; NTRK, neurotrophic tyrosine receptor kinase; RAS, rat sarcoma virus; RET, rearranged during transfection; TMB, tumor mutational burden.
1. Lamarca A et al. J Hepatol. 2026; 85:794-807.
Evelyn Wong@EvelynWongYT
1) Biomarker data: Discussant: Neoadjuvant immunotherapy in dMMR/MSI-H GEA — cross-study table · 2) Slide: Discussant: How to define cCR in GEA? (Feng Wang, invited discussant 2877RO/2878RO/LBA81) · 3) Biomarker data: Discussant: Operation-related complications vs serious irAE in dMMR/MSI-H GEA · 4) Slide: Discussant: Mono PD-1 blockade in GEA — sufficient and for how long? (Feng Wang)
Can we confidently tell our patients they can avoid surgery? 👀
Enjoyed Dr @FengWan25720657 discussion #ESMO26. Encouraging results, but important questions remain:
👉 How reliably can we define cCR?
👉 How long to continue IO?
👉 What abt pts who don’t respond?
#ESMOAmbassadors https://t.co/FChfJbdK69
[Slide 1]
Neoadjuvant immunotherapy in dMMR/MSI-H GEA
Around 60% cCR rate of ICI (3-6 months) in peri-operative dMMR/MSI-H gastric cancer
Study | Regimen/Intent | Duration | Result
NEONIPIGA | Nivo*6 + Ipi*2 → surgery → nivo*9 cycles | Pre-O 3months Post-O 9 months | 29 operated pCR 59% MPR 79%
INFINITY | Durva*3 + Treme*1 → surgery or W &W | Pre-O 3 months | pCR 60% in 15 resected pts cCR 76% in 17 W&W pts
Pan-cancer (GEA) | Dostarlimab*9 | Pre-O 6 months | pCR 52.9% in 17 pts
IMHOTEP (GEA) | Pembro* 1–2 → surgery → Pembro*9 | Pre-O 1.5-3 months Post-O 9 months | pCR 19.4% in 29 pts
Can response-guided immunotherapy modification enable organ preservation in GEA?
1. André T et al., J Clin Oncol. 2023
2. Raimondi A et al., Ann Oncol. 2025
3. Fouchardiere C et al., Ann Oncol. 2024
4. Cercek A et al., N Engl J Med. 2025
Feng Wang
5
[Slide 2]
How to define cCR in GEA?
Clinical complete response (cCR) at 1 year, defined as at 1 year after the start of treatment with dostarlimab, are:
- alive
- without tumor resection
- free of disease progression with a CT of the thorax/abdomen/pelvis normal
- with complete or near complete endoscopy (Grade 3 or 4)
- with negative biopsies
cCR under endoscopy [endoscopy image]
Residual disease under EUS [EUS image with arrow]
1 year evaluation was not enough.
Submucosal residual disease may be missed under endoscopy.
Feng Wang
7
[Livestream side panel: video of speaker at podium] Feng Wang — Invited Discussant 2877RO, 2878RO and LBA81
[Slide 3]
Operation related complications vs serious irAE
High incidences of surgical complications
[Pie chart] Non-Fistulas (n = 5) | Fistulas (n = 4)
1 postoperative death due to a fistula complication
The operation-related complication rate was higher than the 2-6% reported for D2 surgery in East Asia.
dMMR/MSI-H GEA cohort receiving radical resection without ICI in SYSUCC
[KM curve] 5-year RFS rate: 64%
[KM curve] 5-year OS rate: 77%
Grade 3-4 dostarlimab-related AEs: 21%
Treatment interruption for SAE (n=5)
What is the incidence of long term irAE?
Feng Wang
8
Unpublished Data
[Slide 4]
Mono PD-1 Blockade in GEA: is it sufficient, and for how long?
Short-course dual ICI significantly increased pCR rates in dMMR colon cancer
Inclusion criteria
• Previously untreated colon cancer
• MSI-H or dMMR
• Radiologically assessed stage IIB-III (cT4 or N+)
• ECOG PS 0 or 1
R 1:1 → Sintilimab 200 mg Q3W*2 + IBI310 1 mg/kg Q6W*1 | Sintilimab 200 mg Q3W*2 → Surgery
Primary endpoint: pCR rate
Secondary endpoint: EFS, OS, RVT, R0 resection rate
[Waterfall: Pathologic tumor regression (%); legend anti-PD1+anti-CTLA4, anti-PD1]
Inter-group difference: 28.3% (95% CI: 10.8 - 45.7) p = 0.0015
pCR rate: anti-PD1 46.7% | anti-PD1+ anti-CTLA4 78.4%
A longer course of neoadjuvant ICI was associated with higher CR rates in locally advanced dMMR CRC
[Bubble plot: Complete Response (%) vs Median Duration of Treatment (mo); labelled studies include Cercek et al., 2024 (anti-PD-1); Kothari et al., 2022 (anti-PD-1); Pei et al., 2023 (anti-PD-1); Xie et al., 2023 (anti-PD-1); Ludford et al., 2023 (anti-PD-1); J. Li et al., 2024 (PICC); Zhang et al., 2022 (anti-PD-1); Chen et al., 2023 (anti-PD-1); de la Fouchardiere et al., 2024 (IMHOTEP) (anti-PD-1); Y. Li et al., 2024 (anti-PD-L1); Shiu et al., 2024 (NEOPRISM-CRC) (anti-PD-1); Xu et al., 2024 (NEOSHOT) (anti-PD-1); Avallone et al., 2020 (NICOLE) (anti-PD-1); Type of Cancer: Colorectal, Colon, Rectal; No. of Patients 5/10/25/50/75]
Probit treatment-duration coefficient, 0.36 (95% CI, 0.26–0.47) P<0.001 for treatment-duration coefficient P=0.08 for testing for goodness of fit
1. Wang F et al., Cancer Cell 2025
2. Rousseau B et al., NEJM 2025
Feng Wang
9
Evelyn Wong@EvelynWongYT
1) Kaplan-Meier survival data: Adjuvant therapy in resected BTC: BILCAP long-term RFS KM curves · 2) Trial design schema: Adjuvant CisGem vs capecitabine in resected BTC: study design · 3) Kaplan-Meier survival data: Adjuvant CisGem vs capecitabine in resected BTC: primary DFS KM curve · 4) Slide: Adjuvant Gem-Cis vs capecitabine in BTC: non-inferiority mindset, DFS HR and QoL
Agree with Sebastian Mondaca at #ESMO26: capecitabine leaves much room for improvement in adj BTC. But tt should raise our expectations for alternatives. B4 adopting GemCis, we need meaningful gains in efficacy or QOL. What are we improving for our patients? #ESMOAmbassadors https://t.co/39mjaAoEMC
[Slide 1]
Adjuvant therapy in resected BTC
• Capecitabine
• S-1
Panel C: RFS (proportion) vs Time (months) 0-144; Treatment: Observation / Capecitabine; HR 0.81 (0.65 to 1.01)
No. at risk:
Observation
At risk | 224 | 124 | 93 | 76 | 71 | 66 | 55 | 49 | 35 | 24 | 16 | 8 | 2
Censored | 0 | 1 | 2 | 5 | 5 | 5 | 14 | 20 | 33 | 43 | 49 | 57 | 63
Events | 0 | 99 | 129 | 143 | 148 | 153 | 155 | 155 | 156 | 157 | 159 | 159 | 159
Capecitabine
At risk | 223 | 149 | 109 | 88 | 84 | 71 | 59 | 51 | 39 | 25 | 15 | 7 | 4
Censored | 0 | 6 | 6 | 9 | 9 | 9 | 19 | 27 | 38 | 51 | 61 | 69 | 72
Events | 0 | 68 | 108 | 126 | 130 | 143 | 145 | 145 | 146 | 147 | 147 | 147 | 147
Panel D: RFS (proportion) vs Time (months) 0-144; Treatment: Observation / Capecitabine; HR 0.77 (0.61 to 0.97)
No. at risk:
Observation
At risk | 220 | 121 | 90 | 74 | 69 | 64 | 53 | 47 | 33 | 23 | 16 | 8 | 2
Censored | 0 | 1 | 2 | 5 | 5 | 5 | 14 | 20 | 33 | 42 | 48 | 56 | 62
Events | 0 | 98 | 128 | 141 | 146 | 151 | 153 | 153 | 154 | 155 | 156 | 156 | 156
Capecitabine
At risk | 210 | 146 | 108 | 88 | 84 | 71 | 59 | 51 | 39 | 25 | 15 | 7 | 4
Censored | 0 | 2 | 2 | 5 | 5 | 5 | 15 | 23 | 34 | 47 | 57 | 65 | 68
Events | 0 | 62 | 100 | 117 | 121 | 134 | 136 | 136 | 137 | 138 | 138 | 138 | 138
5-year RFS benefit 3% ITT
OS HR 0.79 (0.63 - 1.00)
Multiple studies with negative results
- GEMOX (PRODIGE 12)
- BCAT
Meta-analysis of 4 phase III RCTs (n=1,308): benefit with 5-FU–based therapy (OS HR 0.78), no benefit with gemcitabine-based therapy (OS HR 1.03)
• Bridgewater J et al. Long-Term Outcomes and Exploratory Analyses of the Randomized Phase III BILCAP Study. J Clin Oncol. 2022 Jun 20;40(18):2048-2057
• Akkus E et al. Adjuvant chemotherapy compared to observation in resected biliary tract cancers: Survival meta-analysis of phase-III randomized controlled trials. Eur J Cancer. 2025 May 2:220:115342
Sebastián Mondaca, MD, MBA
Survival table
Endpoint: RFS (BILCAP long-term; panels C and D, populations not labeled on slide)
Observation (panel C) | 224
Capecitabine (panel C) | 223
Observation (panel D) | 220
Capecitabine (panel D) | 210
HR: C: 0.81; D: 0.77
HR CI: C: 0.65 to 1.01; D: 0.61 to 0.97
Landmark rates:
5 years: Capecitabine vs observation (ITT) RFS benefit 3%
[Slide 2]
Study design
Key inclusion criteria
• Age 18 years or older
• Histologically confirmed CCA or muscle-invasive gallbladder cancer
• Macroscopically complete resection with curative intent (R0 and R1)
• ECOG 0 or 1
• Adequate renal, haematological, and liver function
• Start of adjuvant treatment within 6 to 16 weeks after definitive surgery
R 1:1
Group A CisGem (ABC 02): 8 cycles cisplatin 25 mg/m2 and gemcitabine 1000 mg/m2 on day 1 and 8 of a 21 day cycle
CT or MRI q 3 months for 2 years, imaging q 6 months for 3 additional years
Group B Capecitabine (BILCAP): 8 cycles capecitabine 1.250 mg/m2 BID on days 1 through 14 of a 21 day cycle
Primary endpoint
• Disease-free survival (DFS), i.e. recurrence or death due to any cause
Secondary endpoints
• Overall survival (OS)
• Cumulative Recurrence
• Safety (CTCAE version 4.03)
• Quality of life (QoL) monitored with EORTC QLQ-C30 and BIL 21
We expect and improvement in DFS from 50.9% with capecitabine to 60.2% with CisGem, resulting in a hazard ratio (HR) of 0.75. Our statistical analysis plan (SAP) pre-defined the difference in restricted mean survival time (RMST) over 3 years to quantify the treatment effect in case of violation of the proportional hazard assumption.
Sebastián Mondaca, MD, MBA
[Slide 3]
Primary outcome: DFS
Group A CisGem | Group B Capecitabine
RMST (3 years) Δ 2.6 months, p=0.011
Disease-free survival probability ; Time since randomization (years) 0-5
Group A | 297 | 191 | 140 | 110 | 75 | 35
Group B | 294 | 169 | 122 | 101 | 72 | 30
RMST has several advantages:
- No PH assumption
- Clinically intuitive
- Absolute measure
...but it is blind to what happens after the truncation time
Tail of the curve
Truncation time was prespecified
Sebastián Mondaca, MD, MBA
Survival table
Endpoint: DFS
Group A CisGem | 297
Group B Capecitabine | 294
P: 0.011 (RMST difference at 3 years)
[Slide 4]
The non-inferiority mindset
At least, Gem-Cis does not seem to be worse than capecitabine (DFS HR 0.82; 95% CI 0.67 - 1.01)
1- An alternative should be preferred if there is a benefit in QoL or in another area
2-When the benefit of the SOC is limited, you have to be careful when adopting an alternative without proven benefit
[Chart] QLQ-C30 global health status (+/- SD) vs Time since randomization (months) 3 6 9 12 15 18 21 24
Group A CisGem | Group B Capecitabine
Sebastián Mondaca, MD, MBA
Nirmal Raut@oncologician
Kaplan-Meier survival data: Disease-free survival, mFOLFIRINOX vs mFOLFOX6 in high-risk stage III colon
In Stage 3 high risk CRC , mFOLRINOX is not better than mFOLFOX @Annals_Oncology #ESMO2026 https://t.co/aqDgeFSDI9
1) Slide: Caroline Chung - Context is the bridge across the AI chasm · 2) Slide: Caroline Chung - AI reaches patients as a system (system-level validation diagram) · 3) Slide: Caroline Chung - AI headlines often break down in the real world (claim vs counter-evidence table) · 4) Slide: Caroline Chung - Three levels of validation
Excellent insights from @ca_chung at #ESMO26 on bridging the gap between AI development and clinical implementation!
Model performance alone is not enough. We need system-level validation that considers real-world workflows, data quality & patient outcomes. #ESMOAmbassadors https://t.co/rhqbXoI2Nr
[Slide 1]
13:30 - 15:00 Transforming oncology with generative AI and autonomous tools
CHAIRS: EVANGELIA CHRISTODOULOU, JAKOB KATHER
Context is the bridge across the AI chasm
[image of two bridge spans labeled 'Publication & Pilot' and 'Implementation & Impact']
"...the so-called 'AI chasm', that is the gulf between developing a scientifically sound algorithm and its use in any meaningful real-world applications."
P. Keane & E. Topol, npj Digital Medicine 2018
The chasm occurs where the development context and the deployment context diverge:
1 The question the model answers vs. the decision in front of us
2 The quality of training data vs. the data at the site of implementation
3 The people (patients, clinicians, staff), process and technology behind each
Caroline Chung, MD, MSc
[Speaker panel] Caroline Chung — Validating AI for oncology: Navigating the road to clinical implementation
CADIZ AUDITORIUM - NCC
[Slide 2]
13:30 - 15:00 Transforming oncology with generative AI and autonomous tools
CHAIRS: EVANGELIA CHRISTODOULOU, JAKOB KATHER
AI reaches patients as a system
Model validation is only evaluating one part of the system
System-level validation: the whole path, from patient data to outcome
Model-level validation
Patient data — Imaging, pathology, molecular, EHR → AI system — Models, retrieval, tools → Interface & workflow — What, when, to whom →
Clinical decision quality: Clinician decides → Accept / Modify or override / Abstain or escalate → Action → patient outcome
Monitor performance and context over time [feedback loop to Patient data]
Each component of the system will influence the overall ability to achieve the set goal (i.e. purpose).
Caroline Chung, MD, MSc
[Speaker panel] Caroline Chung — Validating AI for oncology: Navigating the road to clinical implementation
CADIZ AUDITORIUM - NCC
[Slide 3]
13:30 - 15:00 Transforming oncology with generative AI and autonomous tools
CHAIRS: EVANGELIA CHRISTODOULOU, JAKOB KATHER
AI headlines often break down in the real world
CLAIM | COUNTER-EVIDENCE | SOURCE
AI takes a better history | Outside text-chat OSCEs, accuracy drops when vignettes become multi-turn patient conversations | Johri et al., Nat Med 2025
AI out-diagnoses physicians | Real ED notes: physicians 0.83 vs GPT-4-turbo ≤0.58 on admission; only 5% of 519 LLM studies used real data | Williams, Nat Commun 2024 · Bedi, JAMA 2025
Removing the human is free | Unassisted adenoma detection fell 28.4% → 22.4% after AI; wrong AI cut expert mammography accuracy to 45.5% | Budzyń, Lancet Gastro Hep 2025 · Dratsch, Radiology 2023
These are failures to define the purpose, not failures of algorithm design.
Caroline Chung, MD, MSc
[Speaker panel] Caroline Chung — Validating AI for oncology: Navigating the road to clinical implementation
CADIZ AUDITORIUM - NCC
[Slide 4]
13:30 - 15:00 Transforming oncology with generative AI and autonomous tools
CHAIRS: EVANGELIA CHRISTODOULOU, JAKOB KATHER
Three levels of validation
Purpose sets the metric at every level · context is measured throughout
Real-world implementation — Does it support the right decision here, for these patients? — Metric: clinical decision quality in the workflow
Pressure testing — Raises confidence it will be robust across real-world data quality — Metric: breakdown threshold and how it fails
Controlled environment — The foundation: can it do the intended task under known conditions? — Metric: discrimination and calibration of intended performance
[arrow] Increasing complexity / Increasing robustness / Baseline level of model performance
Caroline Chung, MD, MSc
[Speaker panel] Caroline Chung — Validating AI for oncology: Navigating the road to clinical implementation
CADIZ AUDITORIUM - NCC
JOSE ALEJANDRO PEREZ FIDAL@PerezFidal
Slide: Peak crossover title slide with author list (Robin Jones et al., ESMO26)
Fantastic presentation of the PEAK trial by Prof R Jones @RobinL_Jones in #ESMO2026 @myesmo about the results of patients with crossover to bezuclastinib +sunitinib from the Suni arm. 56%ORR and PFS 7.4 m (longer than in previous Suni line?!! a new combo alternative is here! https://t.co/z7kQDyO7Tb
Phase 3 Peak Crossover: Bezuclastinib + Sunitinib Combination Following Sunitinib Monotherapy in Patients With GIST
Robin Jones,1 Neeta Somaiah,2 Andrew J. Wagner,3 Jonathan C. Trent,4 Sebastian Bauer,5 Margaret von Mehren,6 Michael C. Heinrich,7 Min-Hee Ryu,8 Breelyn A. Wilky,9 Albiruni R. A. Razak,10 Omar Farooq Khan,11 Silvia Gasperoni,12 Rashmi Chugh,13 Antoine Italiano,14 Amanda Pilla,15 Liangxing Zou,15 Celeste LaHaie,15 William D. Tap16
1. Royal Marsden Hospital, Sutton, UK; 2. MD Anderson Cancer Center, Houston, TX, USA; 3. Dana-Farber Cancer Institute, Boston, MA, USA; 4. University of Miami - Sylvester Cancer Center, Miami, FL, USA; 5. Universitaetsklinikum Essen, Essen-Stadtbezirke III, Germany; 6. Fox Chase Cancer Center, Philadelphia, PA, USA; 7. Oregon Health & Science University (OHSU), Portland, OR, USA; 8. Asan Medical Center, Seoul, South Korea; 9. University of Colorado, Denver, CO, USA; 10. Princess Margaret Hospital, Toronto, Canada; 11. Cumming School of Medicine, University of Calgary, Calgary, Alberta, Canada; 12. University Hospital of Careggi, Florence, Italy; 13. University of Michigan Rogel Comprehensive Cancer Center, Ann Arbor, MI, USA; 14. Institut Bergonie, Bordeaux, France; 15. Cogent Biosciences, Boulder, CO, USA; 16. David H. Koch Center for Cancer Care at Memorial Sloan Kettering Cancer Center, New York, NY, USA.
23-27 October 2026
Elene Mariamidze@EMariamidze
Slide: SBRT local control for large HCC: literature summary slide (ESMO 2026)
Size matters in SBRT in HCC but its an inverse relation .
#ESMOAmbassadors #ESMO26
@myESMO https://t.co/vp186ysiyP
SBRT is an effective local therapy for large HCCs
• 1 year LC 87% 102 HCC med 7.2cm (1.4 – 23.1cm) (Bujold), 30-54 Gy in 6
• 1 year LC 92% 16 HCC med 7.5 cm (5.1 – 9.7 cm) (Beaton)
• 2 year LC 75% 156 HCC med 12.7 cm (5 - 25.7 cm) (Wong), 4Gy x 6-10 +/- TACE
• 3 year LC 72% 34 HCC 4-10 cm (Kuo)
• 3 year LC 82% 55 HCC >10 cm (Kuo)
[Paper excerpts:]
Sequential Phase I and II Trials of Stereotactic Body Radiotherapy for Locally Advanced Hepatocellular Carcinoma — Alexis Bujold, Christine A. Massey, John J. Kim, James Brierley, Charles Cho, Rebecca K.S. Wong, Rob E. Dinniwell, Zahra Kassam, Jolie Ringash, Bernard Cummings, Jenna Sykes, Morris Sherman, Jennifer J. Knox, and Laura A. Dawson
Radiation dose is associated with improved local control for large, but not small, hepatocellular c[arcinoma — obscured] — Uri Amit, Jahan J Mohiuddin, Shwetha Manjunath, Nikhil Grand[i — obscured]
Long-Term Outcome of Stereotactically Designed Hypofractionated Image Guided Radiation Therapy in Large, Unresectable Hepatocellular Carcinoma — Natalie Sean Man Wong, MBBS, MRes(Med), FRCR; Francis Ann Shing Lee, MBChB, FRCR; Venus Wan Yan Lee, PhD; ...
Multimodality Treatment with [obscured]
Stereotactic Body Radiotherapy for Large Unresectable Hepatocellular Carcinomas – A Single Institution Phase II Study — L. Beaton, E.M. Dunne, R. Yeung, T. Rackley, B. Weber, C. Mar, C.J. Yong-Hing, E.M. Yoshida, K. DeVries, R. Lee, C. Duzenli, S.K. Loewen, M. Liu, D. Schellenberg, R. Ma
Impact of tumor size on outcome after stereotactic body radiation therapy for inoperable hepatocellular carcinoma — Hsing-Tao Kuo, Jenny Que, Li-Ching Lin, Ching-Chieh Yang, Lok-Beng Koay, Chia-Hui Lin
[Callout box]
• Local control high for large HCC
• Lower survival and PFS as volume of HCC increases
DrJorgeB_George@DrJorgeBarriuso
1) Slide: IM96 GUCY2C-targeted CAR-T in colorectal cancer: background, mechanism and IIT data · 2) Response data: IM96 GUCY2C CAR-T: antitumor activity at all dose levels, swimmer and waterfall
GUCY2C one of the colorectal cancer stemness markers is going to capture the attention of the GI community in the near future. Yesterday a CART approach 🎯 was presented at #ESMO26 with promising results Others to come Watch the space!
#ESMOAmbassadors @myESMO @GrupoTTD @_SEOM https://t.co/fdllBpUZz1
[Slide 1]
IM96: A GUCY2C-targeted CAR-T
Global Disease Burden
• 1.93 million new cases each year, 3rd most common cancer worldwide1
• 2nd leading cause of cancer death1
• 15% 5-year survival for mCRC2
The Efficacy Ceiling
• ≈ 95% (pMMR/MSS) remains immunotherapy-refractory
• Currently available 3rd-line drugs with 1.0%-1.6% ORR and 1.9-2.0 months mPFS
Product | Regorafenib3,4 | Trifluridine/tipiracil5,6
ORR | 1.0% | 1.6%
mPFS (Month) | 1.9 | 2.0
GUCY2C (Guanylate cyclase 2C)
• Ectopically expressed in a variety of gastrointestinal malignancies
• Overexpression in >80% of colorectal cancer patients
• Intestinally-restricted expression in normal tissues
IM96 CAR-T
• Autologous CAR-T cell product with tuned tonic signaling
[Diagram: Humanized scFv; Specific killing; GUCY2C; Gastrointestinal tumor cell; IM96 CAR-T; CD28; CD3ζ]
IIT Data Published in ASCO and JCO
• In patients with colorectal cancer who received ≥2 prior lines of therapy, safety was manageable;
• The 12–20*10^8 dose cohort demonstrated an ORR of 38.5% and mPFS of 7 months (Qi C, et al . J Clin Oncol. 2026 ).
• As of August 2026, one patient with target lesion CR achieved an OS of 38 months.
Variable | DL3 and DL4 groups: All (N=13) | Liver metastasis (N=6)
Objective response | 38.5% | 33.3%
Disease control rate | 69.2% | 83.3%
Median progression free survival-months | 7.0 | 7.0
6-month overall survival | 91.7% | 83.3%
Chang Liu
Reference: 1. CA Cancer J Clin. 2024; 74(3): 229-263.; 2. CA Cancer J Clin. 2026;e70043.; 3. Lancet. 2013, 381: 303-312; 4. Lancet Oncol. 2015, 16: 619-629; 5. N Engl J Med 2015;372:1909-1919; 6. J Clin Oncol. 2017, 36: 350-358
[Slide 2]
Antitumor Activity Observed at All Dose Levels
• The overall ORR was 39% (7/18), with 42% in the 20×10^8 cohort and 33% in the 12×10^8 cohort.
• The overall DCR was 94% (17/18), with 100% in the 20×10^8 cohort and 83% in the 12×10^8 cohort.
• Depth of response was superior in the 20×10^8 cohort versus the 12×10^8 cohort.
[Swimmer plot: Pt01–Pt18; 20*10^8 (Pt07–Pt18), 12*10^8 (Pt01–Pt06); legend: PD, SD, PR, Ongoing, Withdraw, OS, Death; x-axis Month Post CAR-T Infusion 0–15]
As of August 11, 2026
[Waterfall Plot: Best Change from Baseline (%) by Patient ID; Dose Group 12x10^8 cells, 20x10^8 cells]
Best response labels left to right: PD, SD, SD, SD, SD, SD, SD, SD, SD, SD, SD, PR, PR, PR, PR, PR, PR, PR
As of August 11, 2026
Chang Liu
Juan OConnor@Juanmaoconnor
Trial design schema: Anti PD(L)-1 positive phase 3 trials in gastric/GEJ cancer
Five positive phase III trials of anti-PD-(L)1 + chemotherapy in advanced gastric/GEJ cancer. Survival benefit, with PD-L1 expression key to interpreting its magnitude. #ESMO26 #GIOnc @coutinho Anelisa excellent review in gastric cancer 👏 https://t.co/4KpRjBIfJ8
Anti PD(L)-1 Positive phase 3 trials
Immunotherapy
PD(L)1
• CT + nivolumab
• CT + pembrolizumab
• CT + tislelizumab
• CT + sintilimab
• CT + sugemalimab
Study | n | Arms | CT | mOS (m); HR
CM649 | 1.581 | CT + Nivolumab / CT | Capox or Folfox | 14.4 (CPS ≥5) / 11.1; HR 0.71; p 0.0001 [box: CPS ≥1: 14.0 / 11.3]
KN 859 | 1.579 | CT + Pembrolizumab / CT | Capox (86%) or Cisplatin + 5FU | 12.9 (ITT) / 11.5 / HR 0.78 [box: CPS ≥1: 13.0 / 11.4]
RATIONALE 305 | 997 | CT + Tislelizumab / CT | Capox (93%) or Cisplatin + 5FU | 15.0 (ITT) / 12.9 / HR: 0.80; p 0.001 [box: TAP ≥5: 17.2 / 12.6 / HR: 0.74; P 0.006]
ORIENT16 | 650 | CT + Sintilimab / CT | Capox | 15.2 (ITT) / 12.3 / HR: 0.77, p 0.009 [box: CPS ≥5: 18.4 / 12.9 / HR 0.66; 0.002]
GEMSTONE 303 (antiPDL1) | 479 | CT + Sugemalimab / CT | Capox | 15.6 (CPS ≥5) / 12.6 / HR: 0.75; p 0.006
CM649: primary endpoint amendment: OS or PFS by blinded independent central review, in PD-L1 (CPS) ≥5 patients
# CM649: Primary endpoint in PDL1 CPS ≥5; KN859: CPS ≥1; Rationale 305: All and TAP ≥5%
Orient16: All. CPS ≥5: OS: 18.4 Gemstone 303: CPS ≥5 required for inclusion
Anelisa K. Coutinho, MD
Janjigian et al. Lancet ;398:27–40, 2021 | Rha et al. Lancet Oncol. 24:1181–1195, 2023 | Xu et al. JAMA. 330:2064–2074, 2023 | Qiu et al. BMJ. 385:e078876, 2024 | Zhang et al. JAMA. 333:1305–1314, 2025 | Janjigian et al. Ann Oncol 37:787–797, 2026
[Photo also shows stage with ESMO Congress Madrid 2026 backdrop and a seated panelist]
Benjamin P. Geisler@ben_geisler
1) Biomarker data: Poster 4355P (METIMMOX biomarker analysis) photographed from a distance · 2) Biomarker data: Poster 4355P: Biomarker signals in MSS/pMMR mCRC are predominantly
Are you at #ESMO26?
Come see our #CRC #biomarker poster (prognostic vs. predictive) poster 4355P: hall 5, section B (for biomarkers), first row at the very left.
We'll be there for the presenter hour: 15:15-16:00
#ESMO https://t.co/6WXXeUc48U
[Slide 3]
4355P
Biomarker signals in MSS/pMMR metastatic colorectal cancer (mCRC) are predominantly prognostic, not predictive – lessons from the randomized phase-2 METIMMOX trial
Benjamin P. Geisler1,2@, Megan Othus3, Sebastian Meltzer2, Paula A. Bousquet2, Emily A. Burger1,4, Eline Aas1,5, Anne H. Ree2,6
1Department of Health Management and Health Economics, University of Oslo, Oslo, Norway; 2Department of Oncology, Akershus University Hospital, Lørenskog, Norway; 3Fred Hutchinson Cancer Center, Seattle WA, United States; 4Center for Health Decision Science, Harvard T. H. Chan School of Public Health, Boston MA, United States; 5Division for Health Services, Norwegian Institute of Public Health, Oslo, Norway; 6Institute of Clinical Medicine, University of Oslo, Oslo, Norway
Background
[I]mmune checkpoint blockade is ineffective in unselected MSS/pMMR mCRC.
[M]ETIMMOX (randomized phase 2; NCT03388190): alternating oxaliplatin-based chemotherapy (FLOX) + nivolumab vs FLOX alone; identical PFS.
[P]ost hoc subgroup signals (TMB/BRAF, CRP, TLR) conflated prognostic and predictive effects; we separated them in one pre-specified interaction model per endpoint.
Methods
○ 68 complete cases (59 deaths; 63 PFS events).
○ Biomarkers before nivolumab: TMB ≥9 mut/Mb or BRAF V600E; CRP <5 mg/L after 2 FLOX cycles common to both arms (by chance 47% vs 19% positive).
○ TLR ≥10% at the first on-treatment CT: analyzed as intermediate endpoint with a week-9 landmark.
○ Per endpoint (PFS, OS): one Firth-corrected Cox model with age, sex, treatment, biomarker main effects and treatment × biomarker interactions (Figure 1); profile-likelihood 95% CIs, PLRT.
○ Ridge-penalized Cox as co-primary stability estimator.
[Figure 1: DAG - Age/Sex, TMB/BRAF, CRP → PFS/OS; partially obscured by presenter]
Results
Figure 2. Kaplan-Meier survival by biomarker status and treatment arm
a) CRP <5 mg/L at week 4 (n = 68) b) TMB ≥9 mut/Mb or BRAF V600E (n = 68) c) TLR ≥10%, week-9 landmark (n = 65)
[Overall survival panels a-c; Progression-free survival panels d-f; x-axis Weeks since randomization / Weeks since week-9 landmark]
Legend: FLOX/nivolumab, biomarker-positive; FLOX/nivolumab, biomarker-negative; FLOX alone, biomarker-positive; FLOX alone, biomarker-negative
○ No marginal treatment effect: OS HR 0.96 (95% CI 0.58–1.61); PFS HR 0.77 (0.44–1.38).
○ Prognostic: CRP <5 mg/L and TMB/BRAF positivity were associated with longer PFS (HR 0.39 each) and, for CRP, longer OS (HR 0.49), regardless of treatment (Table 1, Figure 2).
○ Not predictive: no treatment × biomarker interaction reached significance (Figure 3). Largest signal: CRP × treatment for PFS, HR 0.26 (0.06–1.34), p = 0.10, but it shrinks toward 1 under ridge (HR 0.66) and is weaker for OS (HR 0.65).
○ TLR: strongly prognostic (landmark HR 0.35 OS, 0.21 PFS), but more frequent with FLOX alone (76% vs 53%), with inconsistent interactions (HR 2.47 OS, 0.88 PFS): a marker of chemotherapy-responsive disease, not of nivolumab benefit.
Table 1. Hazard ratios (95% profile-likelihood CI) from Firth-corrected Cox regression
Term | Model | OS HR (95% CI) | p | Ridge HR | PFS HR (95% CI) | p | Ridge HR
Treatment (FLOX/nivolumab vs FLOX) | Univariable | 0.96 (0.58–1.61) | 0.87 | – | 0.77 (0.44–1.38) | 0.38 | –
CRP <5 mg/L at week 4 | Univariable (prognostic) | 0.49 (0.27–0.84) | 0.009 | – | 0.39 (0.20–0.73) | 0.003 | –
TMB ≥9 mut/Mb or BRAF V600E | Univariable (prognostic) | 0.68 (0.40–1.13) | 0.14 | – | 0.39 (0.21–0.73) | 0.003 | –
TLR ≥10% (week-9 landmark)† | Univariable (prognostic) | 0.35 (0.21–0.61) | <0.001 | – | 0.21 (0.11–0.42) | <0.001 | –
CRP × treatment | Unified interaction model | 0.65 (0.19–2.60) | 0.52 | 0.80 | 0.26 (0.06–1.34) | 0.10 | 0.66
TMB/BRAF × treatment | Unified interaction model | 0.95 (0.32–2.82) | 0.92 | 0.91 | 0.65 (0.18–2.41) | 0.52 | 0.74
TLR × treatment | Landmark responder model† | 2.47 (0.75–7.75) | 0.14 | 1.13 | 0.88 (0.21–3.38) | 0.85 | 0.63
[Table footnote: small print, partially illegible]
Figure 3. Treatment × biomarker interactions [forest plot, small print illegible]
Conclusion
In this exploratory analysis, biomarker signals in MSS/pMMR mCRC were predominantly prognostic rather than predictive.
The CRP × treatment interaction for PFS is hypothesis-generating, and evaluation in adequately powered prospective studies could be considered.
@ b.p.geisler@medisin.uio.no
Disclosure: B.P. Geisler has no potential conflicts of interest to declare. Funding: [small print, partially illegible] ...
JOSE ALEJANDRO PEREZ FIDAL@PerezFidal
1) Biomarker data: StrateGIST velzatinib: PFS by week-8 ctDNA clearance across three · 2) Biomarker data: StrateGIST velzatinib ctDNA clearance analysis conclusions
Very interesting data of the clearance of the ctDNA during velzatinib treatment in the STRATEGIST https://t.co/XEFdqMbdHK appears to be a trono predictor of improved outcomes !! In #ESMO26 @myESMO https://t.co/zU1wfCUTrw
[Slide 1]
Among Three Methods Tested, Clearance of mKIT maxVAF Had the Strongest Correlation With PFSa
Guardant G360 molecular response scoreb
HR=0.69 P=0.182
Clearance / No clearance
mPFS: 9.2m vs 5.5m
Mean VAF (all variants)c
HR=0.81 P=0.465
mPFS: 9.2m vs 5.6m
maxVAF (KIT/PDGFRA only)d
HR=0.5 P=0.0104
mPFS: 11m vs 5.5m
PFS probability
Progression-free survival (months)
At Risk
Clearance defined as >99% reduction in ctDNA as assessed by each modality. Each analysis included 73 common patients to determine the most accurate method to use.
ctDNA, circulating tumor DNA; G360, Guardant Health 360; HR, hazard ratio; maxVAF, maximum variant allele frequency; mKIT, mutant KIT; mPFS, median progression-free survival; mRECIST, Modified Response Evaluation Criteria in Solid Tumors; VAF, variant allele frequency.
actDNA clearance was defined as a >99% reduction of mKIT VAF (which includes KIT and PDGFRA) from baseline. In this analysis, clinical activity was assessed by mRECIST v1.1 and plasma samples were analyzed at baseline and weeks 2, 4, 8, and 32, using G360 (74-gene panel). Results presented here examine ctDNA clearance at week 8. Artificial Intelligence (AI) technology was used as an assistant for coding, but not for the generation of figures. bGuardant uses a proprietary algorithm to calculate molecular response based on mean VAF and clonal hematopoiesis variants filtering. cMean VAF is calculated using all somatic variants, without filtering variants associated with clonal hematopoiesis. dMaxVAF is the highest VAF of a single KIT/PDGFRA mutation and could differ between cycle 1 day 1 and an on-treatment timepoint.
Sebastian Bauer
Survival table
Endpoint: PFS by week-8 ctDNA clearance (clearance vs no clearance), three methods
G360 molecular response score: clearance vs no clearance | 9.2 mo vs 5.5 mo
Mean VAF (all variants): clearance vs no clearance | 9.2 mo vs 5.6 mo
maxVAF (KIT/PDGFRA only): clearance vs no clearance | 11 mo vs 5.5 mo
HR: G360: 0.69; mean VAF: 0.81; maxVAF: 0.5
P: G360: 0.182; mean VAF: 0.465; maxVAF: 0.0104
[Slide 2]
Conclusions
In this exploratory analysis, mKIT ctDNA clearancea was associated with longer PFS – at week 8, there was a 40–50% reduction in risk of progression compared to those without clearance
ctDNA clearance with velzatinib was rapid and increased over time (30% after 2 weeks and ~50% after 8 weeks)
ctDNA clearance could be a useful predictive biomarker for KIT-directed treatments with broad mutational coverage; however, further analyses with a larger sample size and longer follow-up are needed
Further research (that considers treatment line) in later phase trials (StrateGIST 3 and StrateGIST Frontline) will explore the role of ctDNA monitoring in optimizing outcomes for patients with advanced GIST
ctDNA, circulating tumor DNA; GIST, gastrointestinal stromal tumor; mKIT, mutant KIT; PFS, progression-free survival.
actDNA clearance was defined as a >99% reduction of mKIT/mPDGFRA VAF from baseline.
Sebastian Bauer
Juan OConnor@Juanmaoconnor
Trial design schema: Biomarker reassessment at progression in gastric cancer schema (Raghav Sundar)
Precision oncology in gastric cancer is a moving target. Reassessing biomarkers at progression with tissue ± ctDNA may help guide treatment sequencing. #ESMO26 @sundar__raghav great talk! https://t.co/4tABzkpddG
8. Organoids for Running Virtual Trials
KEY ISSUE
Limitations of conventional clinical trials.
Patient-derived organoids enable ex vivo testing of multiple treatment options, with potential integration into cancer digital twins and virtual trials.
KEY INSIGHT
Organoid-based virtual trials could improve treatment selection and accelerate drug development.
ESMO COMMITMENT
ESMO supports translational research and the evaluation of patient-derived organoids as predictive biomarkers for precision oncology.
Patient-Derived Organoids Predict Treatment Response in Metastatic Colorectal Cancer
Smabers LP et al., Clinical Cancer Research (2025)
Immuneering Corp@Immuneering
Response data: MEK inhibitors in PDAC: atebimetinib + mGnP phase 2a response waterfall, OS curve
Great to see atebimetinib & MAPKeeper 301 awareness building!
At #ESMO26 @MacarullaTeresa, Head of Medical Oncology at @hospitalclinic included atebimetinib and our MAPKeeper 301 Phase 3 clinical trial in her presentation “Pancreatic Cancer: From biology to emerging therapies” https://t.co/evlvT2YZE4
Pancreatic cancer: From biology to emerging therapies
CHAIRS: IRIT BEN-AHARON, MAEVE LOWERY
MEK inhibitors in PDAC
Atebimetinib is a novel allosteric small molecule inhibitor of MEK1/2
Atebimetinib (320 mg QD) + mGnP
DCR: 82% [95 CI 69, 91]
ORR: 36% [95 CI 23, 51]
Participant Population: First-line (1L) metastatic Pancreatic Ductal Adenocarcinoma (PDAC)
MAPKeeper 301
• First line (1L) PDAC
• Metastatic setting
• ECOG PS 0-1
R 1:1
N=255 Atebimetinib + mGnP1
N=255 Gem/nab-Pac 1L SoC Chemotherapy2
Primary Endpoints: OS
Secondary Endpoints: PFS, DCR, ORR, QoL
NCT07562152
Phase 2a | Atebimetinib (320 mg QD) + mGnP OS, N=55
— Ph2a IMRX (320 mg atebi + mGnP, N=55)
IMRX - Phase 2a (N=55, atebi + mGnP)
17.3 mo
OS Probability
Months
Censored Participant off study
Censored Participant still on study
At risk / Events / Censored
Chung et al, presented at 2026 ASCO Meeting
Survival table
Endpoint: Overall survival, phase 2a single arm
Atebimetinib 320 mg QD + mGnP (IMRX phase 2a) | 55 | 17.3 mo
Targeted Oncology@TargetedOnc
Slide: T-cell engager trials in upper GI cancers: CLDN18.2 x CD3 and 4-1BB co-stimulation agents
BITE therapy is coming in Gastric/GEJ/pancreas/HCC. Onc community practices need to continue to develop their BITE programs and infrastructure #ESMO2026 #AONoncology #Communityoncology #DrSamMikhail #cancercare https://t.co/M9r5GTF7Ir
[Slide 1]
EFFICACY
• 17/18 (94%) patients had a pathologic response:
• 15/18 (83%) an MPR, meeting the primary endpoint;
• 13/18 (72%) had a pCR;
• Two patients had a partial response and one patient with 70% RVT was a non-responder.
• In the patient with a synchronous colon and rectal tumor, the rectal tumor showed a complete endoscopic response and patient opted for rectal organ preservation, while surgery was performed for the colon tumor (partial response)
• Radiographic assessment did not accurately predict pathologic response
Pathologic Response n = 18
Legend: - ypN- ; + ypN+
Tumor Regression (%) | reference lines: Pathologic response; MPR
Radiologic response legend: Complete Response | Partial Response | Stable Disease
SURVIVAL
After a median FU of 15 months (range 13,7 – 21,6):
• All patients were alive;
• One patient (partial responder; ypT4abN2), who received adjuvant chemotherapy, developed peritoneal metastases a year later;
• One patient with an MPR experienced a solitary lymph node metastasis 6 months after surgery;
• The patient with complete clinical response of the rectal tumor has no signs of regrowth at 7 months FU.
Corresponding email address: m.chalabi@nki.nl
[Slide 2]
METHODS
• Investigator-initiated, single center, phase II platform study
• Patients with colorectal, non-metastatic, resectable, dMMR adenocarcinoma. MMR deficiency confirmed by IHC
• Botensilimab 50 mg I.V. on D1 + balstilimab 450 mg I.V. on D1 and D22, followed by surgery within 8 weeks after start of treatment
• PRIMARY ENDPOINT: Major pathologic response (MPR, ≤ 10% residual viable tumor, RVT, in primary tumor and lymph nodes);
• Simon's two-stage design: 8 patients in stage 1, expanding to 18 if > 2 MPRs. Primary endpoint met if ≥ 7/18 MPRs.
• SECONDARY ENDPOINTS:
• Pathologic complete response (pCR, no RVT in both primary tumor and lymph nodes), partial pathologic response (10 – 50 % RVT), no pathologic response (> 50% RVT);
• EFS, DFS, OS;
• Translational analyses including WES, scRNAseq, and ctDNA.
Baseline | D1 week 0: Cycle 1 bot 50 mg /bal 450 mg | D22 week 3: Cycle 2 bal 450 mg | +/- week 8: Surgery
Screening Endoscopy (PET-)CT scan | +/- week 8 (PET-)CT scan
Targeted Oncology@TargetedOnc
1) Slide: Pancreatic cancer in young population is on the rise - birth cohort effect chart · 2) Slide: Early-onset pancreatic cancer demographics - age-adjusted incidence trends by age group · 3) Slide: Early-onset pancreatic cancer - lessons from EOGI cancer: the exposome (Irit Ben-Aharon)
Pancreas cancer incidence is rising in younger patients. Modifiable risk factors include alcohol, smoking and metabolic syndrome #ESMO26 #PanCan #pancreaticCancer #Pancreaticcancerawarenes #CommunityOncology #aonOncology #DrSamMikhail https://t.co/uvEprHNp2D
[Slide 2]
Pancreatic Cancer In Young Population Is On The Rise
• Median age at onset is 71y; PC is considered a disease of older population.
• Yet, in the past decades the early-onset component is on the rise regardless of the general increase in incidence.
Pancreas
Cohort rate ratio
There is a Birth Cohort Effect:
The incidence rate is approximately two-to-three times higher in the 1990 birth cohort than in the 1955 birth cohort for pancreatic cancer in both male and female individuals ((2.61 [2.22–3.07]).
Irit Ben-Aharon MD, PhD
Sung et al., Lancet Pub Health 2024
[Slide 3]
Early-Onset Pancreatic Cancer - Demographics
A Aged ≥55 B Aged <55 C Aged 35-54 D Aged 15-34
Men Women
Age-Adjusted Incidence Rate (per 100,000 population)
Year
Cancer cases (N = 283 817)a
All ages
Men 141 520 (49.8)
Women 142 297 (50.1)
Aged ≥55 y
Men 123 156 (43.3)
Women 128 204 (45.1)
Aged <55 y
Men 18 334 (6.5)
Women 14 035 (4.9)
Aged 35-54 y
Men 17 692 (6.2)
Women 13 139 (4.6)
Aged 15-34 y
Men 642 (0.2)
Women 896 (0.3)
Irit Ben-Aharon MD, PhD
Gadaam et al. [illegible]
Abboud et al, [illegible]
[Slide 4]
Early-Onset Pancreatic Cancer – Lessons from EOGI Cancer
Exposome – a term that collectively describes the effect of lifestyle and environmental factors, and may be divided into 3 compartments:
• Specific external exposome
Diet, drugs, biological agents, screen use etc.
• General external exposome
Air pollution, traffic, noise etc.
• Internal exposome (host factors)
Microbiome, genetics, aging
Irit Ben-Aharon MD, PhD
CancerNetwork®@CancerNetwrk
1) Slide: LBA18 BEAGLE-MDT phase 2 patient summary ratings by role (Ashraf, ESMO 2026) · 2) Slide: LBA18 BEAGLE-MDT AI colorectal MDT decision support conclusions (Ashraf, ESMO 2026)
📍 @drarturoai In the room at #ESMO26 for LBA18: @ShazadAshraf88 showed AI that preps the colorectal tumor board before it meets. It earned a 9/10 rating from clinicians and found open trials for 92% of cases, where trials were discussed in fewer than 4% of real cases. Synthetic cases so far; shadow mode is next.
Stay tuned for more coverage!
#crcsm #AIOncology #CNRealtimeReport
[Slide 2]
RESULTS · PHASE 2 · PATIENT SUMMARY
Patient summaries rated 9.0 / 10 by 15 Clinicians & AHPs
145 reviews · 15 MDT members, 6 roles · every case, ready or deferred
All Clinicians & AHPs | 9.0 / 10 | 92% | 134 of 145 rated 8-10
Medical oncologists | 9.2 / 10 | 93% | 28 of 30 rated 8-10
Colorectal surgeons | 9.0 / 10 | 94% | 67 of 71 rated 8-10
Mean summary rating by role (1–10)
Colorectal surgeon (7) | 8.98
Nurse & MDT coordinator (2) | 9.2
Medical oncologist (3) | 9.2
Pathologist (2) | 10
Shazad Ashraf
[Slide 3]
Conclusions
THE PROBLEM
In 14,180 MDT cases, 8.2% were deferred and trials were discussed in only 3.9%.
PHASE 1 · ABSTRACT
Across 15 synthetic cases, BEAGLE®-MDT scored 9.2-10.0 / 10 for summaries, management and trial matching.
PHASE 2 · NEW SINCE ABSTRACT
Across 15 MDT members, the new deferral gate matched clinicians in 83% of reviews; open trials identified for 92% of cases.
WHAT COMES NEXT
Improve trial identification and patient/referrer letters. Shadow-mode and prospective evaluation to demonstrate fewer deferrals, more trial access, and safety.
BEAGLE®-MDT is designed to support, not replace, multidisciplinary clinical expertise.
PeerView@PeerView
Slide: ePoster 518eP - Progress Towards Personalised Care in Advanced CCA: Impact of an Online Micro-Learning
Today at #ESMO26: View our virtual ePoster 518eP on personalised care in advanced #cholangiocarcinoma, attached below.
2,491 clinicians in 72 countries took part in our micro-learning CME activity. Learners outperformed matched non-participants by 40 percentage points on average.
Thank you to our authors Ben Johnson, Michael Beyer, Rianna Hanif, Jessica Massey, Angela Lamarca, Nicola Normanno, Rachna Shroff & @Servier for grant support
Progress Towards Personalised Care in Advanced CCA:
Impact of an Online Micro-Learning Educational Initiative on Clinician Knowledge, Competence, and Practice Readiness
Ben Johnson1, Michael Beyer1, Rianna Hanif1, Jessica Massey1, Angela Lamarca2, Nicola Normanno3, Rachna Shroff4†
1PVI, PeerView Institute for Medical Education, London, UK; 2Fundacion Jimenez Diaz University Hospital, Madrid, Spain; 3IRCCS Istituto Romagnolo per lo Studio dei Tumori "Dino Amadori" – IRST S.r.l., Meldola, Italy; 4University of Arizona Cancer Center (UACC), University of Arizona College of Medicine – Tucson, Tucson, Arizona, USA.
† In memoriam: Dr. Shroff was instrumental in the development of this activity. We are grateful for her contributions to this activity and the field of medicine.
Background & Methods
The goal of precision oncology is to deliver the right treatment to the right patient, at the right dose and at the right time. In cholangiocarcinoma (CCA), key actionable alterations, including FGFR2 alterations, IDH1/2 mutations, BRAF V600E mutations, HER2 overexpression and alterations, NTRK fusions and MSI-H/dMMR status, now inform personalised treatment selection. As the therapeutic landscape evolves, clinicians require practical support to interpret molecular findings and integrate evidence-based targeted approaches into patient-centred care.
Design: PeerView deployed a CME-certified, online video-based micro-learning activity that blended the clinical journey of a patient with advanced CCA with expert guidance and relevant clinical evidence on implementing targeted treatment approaches. Five assessment questions were administered to learners after the education and to a demographically matched group of non-participants to evaluate differences in knowledge and competence. Here, we report the findings 7 months after launching this initiative.
Programme Reach
2,491 learners across 72 countries(a)
34,386 patients with advanced CCA potentially impacted per month(b)
1,309 supplementary material downloads, demonstrating active engagement beyond passive viewing
Interprofessional audience comprising oncologists (42%), gastroenterologists (13%), pathologists (11%), nurses/NPs/PAs (9%) and other HCPs (25%)
a Data cut-off: 7 months from launch (November 2025-June 2026).
b Estimated from participant-reported monthly patient load.
Impact on Knowledge & Competence
The objective of this initiative was to improve the understanding and practical application of precision approaches in the management of advanced CCA.
40 percentage point (pp) mean difference across all assessed knowledge and competence domains
[legend] Non-participants / Learners
57 pp difference — 35% → 92% — in understanding of the clinical landscape for the management of advanced CCA and the differences in available targeted therapies
38 pp difference — 45% → 83% — in the ability to formulate team-based, personalised CCA clinical care plans that align therapy with a patient's molecular profiling results and support treatment across the care continuum
8 pp difference — 75% → 83% — in the ability to integrate evidence-based molecular profiling tools and interpret results to inform therapeutic decision-making in advanced CCA
✓ Following participation, no learners selected 'I'm not sure' on any of the five assessed knowledge/competence questions. These findings suggest meaningfully increased confidence in applying the educational content.
★ Key finding: Understanding of evidence on emerging combination targeted therapy represented the largest knowledge gap between non-participants and learners. On a question assessing this area, 16% of non-participants and 92% of learners responded correctly—a 76-pp difference and the largest of any assessed question. This suggests that clinicians in the target audience may benefit from accessible updates as the therapeutic landscape evolves.
Ongoing Unmet Needs
Self-reported practice considerations among non-participants (n = 50)
84% reported opportunities for further support in applying updated treatment guidance in routine practice
68% described practical challenges in ensuring timely, comprehensive molecular profiling
72% identified a need for further support in recognising appropriate clinical trial referral opportunities
Key Themes Identified for Future Education
Open-ended requests for more information/future education among non-participants (n = 50)
1 Therapeutic sequencing after frontline chemoimmunotherapy — Uncertainty about optimal treatment decisions following progression on frontline regimens was the most frequently cited clinical challenge.
2 Targeted therapy safety in community settings — Targeted therapy toxicities were a particular area of uncertainty for non-specialist and community-based clinicians. Recognition and grading of toxicities and dose-modification protocols represent a distinct, actionable educational gap.
3 Keeping pace with the emerging evidence base — Rapidly evolving early-phase combination trial data represented the largest driver of knowledge gaps in this programme. Clinicians require accessible, evidence-based updates to translate emerging findings confidently into clinical decision-making.
The corresponding author has no conflicts of interest to share.
Corresponding author contact: ben.johnson@peerview.com
Jointly accredited CME activity | PVI, PeerView Institute for Medical Education
This activity is supported by an educational grant from Servier.
[Back to search button]
Pancreas Centre BC@PancreasBC
Slide: E-poster: metabolic comorbidities in pancreatic ductal adenocarcinoma patients with pathogenic
Elizabeth Fung presented an e-poster at #ESMO2026 on Oct 23: “Analysis of metabolic comorbidities in patients with pancreatic ductal adenocarcinoma and pathogenic germline variants,” co-authored by the #PancreasCentreBC co-directors Drs. Daniel Renouf and David Schaeffer. @myesmo https://t.co/UGVN8oPRHg
Analysis of metabolic comorbidities in patients with pancreatic ductal adenocarcinoma and pathogenic germline variants
Elizabeth A. Fung, Phoebe T.M. Cheng, Joanna M. Karasinska, Carol Cremin, Eugene Cheung, Steve E. Kalloger, James T. Topham, Lan Valerie Tao, Haley M. Beckmann, David F. Schaeffer, Kasmintan Schrader, Daniel J. Renouf
PANCREAS CENTRE BC
BC CANCER
CONCLUSIONS
• HRR PGV+ patients are more likely to present with BMI ≥25 compared to PGV- patients and other PGV+ subtypes.
• PGV+ patients have a trend towards lower rates of diabetes and/or dyslipidemia compared to PGV- patients (p=0.08).
• HRR PGV+ patients treated with FFX have significantly greater OS than patients treated with GA. No survival differences are observed within PGV- and cell cycle PGV+ patients.
Secondary commentary
KOL infographics 62
Summary graphics that physicians, media and companies designed themselves (branded cards, redraws, watchlists and top-10 lists). They are commentary, not the presented data, so they sit here in compact form. Click a thumbnail to enlarge it on this page.
GI 62
1) KOL infographic: KOL-made RAS(ON) landscape table 1/2: monotherapy · 2) KOL infographic: KOL-made RAS(ON) table 2/2: What changed? ESMO and recent
🚨SANO 5y: surveillance vs surgery after cCR
OS 50% vs 54% (NS)
Distant mets 46% vs 29% (P<.01)
Reminder: only 41.4 Gy/23 fx, a pre-op, arguably non-definitive dose, especially with/ ~75% adenocarcinoma.
Nonsignificant OS doesn't establish noninferiority.
#ESMO26 #RadOnc #OncTwitter
SANO
Surgery vs surveillance after CRT (41.4 Gy in 23 fractions)
Locally advanced esophageal cancer
~75% adenocarcinoma
cCR after CRT
n = 309
→ RANDOMIZE
Standard surgery (n = 111) | 5-year OS 54% | 5-year distant metastases 29%
Active surveillance (n = 198) | 5-year OS 50% | 5-year distant metastases 46%
Hospital-level randomization
12 hospitals; stepped-wedge
Counts include crossover
OS: HR 1.17 (95% CI 0.77-1.77), surveillance vs surgery; not statistically significant.
Distant metastases: cumulative incidence; P < .01. Primary endpoint: 2-year OS (NI margin: 15 points).
van der Wilk et al. Lancet Oncol 2025;26:425-436. 5-year update: ESMO 2026, LBA78.
Schema and summary by Jeffrey Ryckman, MD: (AGITG/TROG) randomised phase 2 design + results summary
MASTERPLAN full publication is out!!
The RT volumes are worth a closer look. CTV = primary GTV + nodal GTV + tumour-vessel interface. The TVI extends 5 mm proximally and 5 mm distally along involved/closely adjacent vessels, for patients where surgery is likely. PTV = CTV/ITV + 5 mm. No elective nodal irradiation, and no elective perineural or celiac/SMA plexus volume specified in the protocol. That is a focused target, with gross nodal disease included.
Real-time RTQA is a big part of this story. Review identified 36 major planning deviations in 12 patients, reduced to 2 deviations in 2 patients after QA. All plans passed independent review before treatment. As a radiation oncologist, I want that detail alongside the outcomes. Reproducing the treatment means reproducing the contour review, OAR constraints and image guidance too.
Also worth keeping the treatment delivery denominator in view: only 40/49 patients assigned to SBRT actually received it (82%). The efficacy analysis is intention-to-treat. It should not be read as an outcome series of patients who all completed SBRT.
The surgical numbers need some unpacking. All comparisons below are chemo + SBRT vs chemo alone:
✅ Underwent surgery: 62% vs 44% (29/47 vs 11/25).
✅ Completed resection: 53% vs 44% (25/47 vs 11/25).
✅ R0 among all resected patients: 52% vs 36% (13/25 vs 4/11).
✅ R0 in the resected POPC subset: 62% vs 40% (13/21 vs 4/10).
POPC is the potentially operable cohort. So the 62% surgery figure includes exploration without resection, while the 62% R0 figure applies only to resected POPC patients. These are different endpoints with different denominators. None of those between-arm surgical comparisons was statistically significant. The paper also defines R0 as more than 1 mm clearance.
Adjuvant chemo is another important difference: 80% vs 36% of resected patients received it (20/25 vs 4/11). That complicates attribution within the treatment pathway. Early progression in the control group may have contributed, so this is a post-randomisation imbalance with more than one possible explanation. The post-hoc analyses were directionally consistent, but the authors explicitly caution about selection bias.
For the planning details: PTV_EVAL excluded the GI PRVs, with a minimum 3 mm PRV expansion. OAR constraints took priority over target coverage. Duodenum, stomach and small bowel D0.5cc were each constrained to <33 Gy, with V30 <5 cc. Delivery used standard linacs; breath hold was recommended, and fiducials were placed in 35/40 patients (88%). This is relevant to how we would implement the approach in practice.
With no elective nodes, isolated regional nodal relapse was 4% vs 8% (2/49 vs 2/25). Reassuring, although that does not establish the optimal elective volume (especially considering these patients went to surgery - ASTRO/NRG recommends inclusion of elective perineural coverage). Overall G3+ AEs were 70% vs 64% (33/47 vs 16/25). One G3 pancreatitis and one G2 small bowel obstruction were attributed to SBRT. The practical takeaway for me is to keep the target definition and prospective QA attached to the results, and to be precise about what the surgery and R0 numbers actually measure.
MASTERPLAN (AGITG/TROG)
Randomised phase 2 • 14 hospitals in Australia / New Zealand • Lancet Oncology 2026
ELIGIBILITY
Localised PDAC
Age ≥18, ECOG 0–1
High-risk resectable*
Borderline resectable
Locally advanced or
medically inoperable
ITT n=74
Randomise
2:1
Experimental : control
CONTROL · Chemotherapy alone · n=25
Induction chemo
12 weeks
No protocol SBRT
EXPERIMENTAL · Chemotherapy + SBRT · n=49
Induction chemo
12 weeks
SBRT 40 Gy/5 fx
If no progression
Restage + surgical assessment
If suitable: surgery, then
12 wk adjuvant chemotherapy
If unsuitable: up to 12 wk
further chemotherapy;
reassess
Induction in both arms: mFOLFIRINOX or gemcitabine / nab-paclitaxel
*High risk: >4 cm, extrapancreatic extension or node-positive disease. POPC = potentially operable; IPC = inoperable.
Primary: 12-month locoregional recurrence (LRR). Selected secondary: PFS, OS, resection, R0, safety, QoL.
RESULTS • SBRT + CHEMOTHERAPY vs CHEMOTHERAPY ALONE • HR intervals are 95% CIs
12-month LRR
20.2% vs 52.0%
sHR 0.44 (0.22–0.88), p=0.022
Median PFS
11.9 vs 6.3 mo
HR 0.44 (0.26–0.75)
Median OS
22.0 vs 14.0 mo
HR 0.45 (0.25–0.81)
Grade ≥3 AEs
70% vs 64%
33/47 vs 16/25
Sources: main PDF pp3–6, 9, 11. OS is exploratory. RT: CTV = GTVp + GTVn + TVI (if surgery likely), PTV +5 mm, no ENI, prospective RTQA (A pp42–43, 47).
1) Schema and summary by Jeffrey Ryckman, MD: UNION phase III design/results graphic: SCRT + camrelizumab/CAPOX vs LCCRT + CAPOX · 2) Schema and summary by Jeffrey Ryckman, MD: STELLAR II graphic: SCRT-based TNT ± sintilimab in pMMR LARC (ASTRO 2026) · 3) Schema and summary by Jeffrey Ryckman, MD: TORCH-iTNT graphic: CAPOX + toripalimab ± SCRT in pMMR LARC (ASTRO 2026)
Jeff Ryckman@jryckman3
Post text
Full UNION paper is out in Lancet Oncol. Supplement Table S4 caught my eye: median time from RT start to surgery was 72 vs 113 days (SCRT/IO vs control), yet pCR was 39.8% vs 15.3%.
I would've expected LOWER pCR with surgery that much sooner(!), as we've seen in past short-course RT trials. Makes that response signal even more interesting!
Adding ICI in rectal cancer sure seems enticing! Are we entering a new frontier?!?
---
#ASTRO26 STELLAR II (Li): phase 2/3, 588 pts w/ pMMR LARC, SCRT 25/5 → CAPOX x4 +/- sintilimab. Adding sintilimab increased CR (pCR + cCR) from 27% → 52% (p<0.001). pCR among operated pts went from 19% → 42%. G3-4 toxicity also went up, 20% → 28%. Looking forward to the primary phase 3 endpoint, 3y DFS, which is still pending.
---
#ASTRO26 TORCH-iTNT (Wang) asks a different question: randomized phase II, pMMR LARC, CAPOX + toripalimab x6 w/ vs w/o SCRT 25/5. CR was 37% w/o RT → 62% w/ SCRT. IO in both arms here.
---
Unlike UNION, both ASTRO trials allowed watch-and-wait / organ preservation, so CR includes cCR. These aren't all pCR comparisons. Oh and of course standard caveat that cross trial comparisons are a sin.
UNION enrolled only surgery-intended pts, and both arms got just 2 cycles of consolidation chemo vs the 4-6 now recommended. I wonder how this compares w/ modern TNT, especially when organ preservation is the goal.
https://t.co/0D7ygEoO7I
#ESMO26 #radonc #OncTwitter #CRCSM
ESMO26 LBA8
HARMONi-GI1 | Phase III
Ivonescimab + Chemo beats Durvalumab + Chemo
First-line treatment for advanced biliary tract cancer
PD-1/VEGF bispecific antibody improves survival over standard durvalumab
Overall Survival
14.9 vs 12.1 months
HR 0.75
(95% CI 0.61–0.92)
P = 0.0031
Progression-Free Survival
8.4 vs 5.8 months
HR 0.61
(95% CI 0.51–0.72)
P < 0.0001
Objective Response Rate
53.8% vs 32.5%
Ivonescimab + chemo vs Durvalumab + chemo
P < 0.0001
VERDICT
Ivonescimab + chemo could be a new first-line standard for advanced biliary tract cancer.
@DrRishabhOnco
N = 682 (China, Phase 3)
Ivonescimab or Durvalumab + gemcitabine/cisplatin (Q3W, 8 cycles) → maintenance
Generally well tolerated
No new safety signals
Schema and summary by Jeffrey Ryckman, MD: chemo +/- pancreatic SBRT 40 Gy/5 fx, 12-month LRR 20.2% vs 52.0%
Encouraging pancreas SBRT data from MASTERPLAN. Adding 40 Gy/5 fx cut 12mo locoregional recurrence from 52% to 20% (P=.022).
OS 22 vs 14mo, but this is a 74-pt phase II with mixed resectability. Promising; not definitive OS evidence.
#ESMO26 #radonc
https://t.co/V1L9O30kcB https://t.co/mQ9DiXp7qH
[ESMO logo] GOOD SCIENCE BETTER MEDICINE BEST PRACTICE
ESMO 2026
MASTERPLAN
Can 5 Fractions of SBRT Improve Survival in Pancreatic Cancer?
Randomized Phase II | n = 74
Smaller fractions. Bigger impact?
STUDY DESIGN
Adding SBRT (40 Gy/5 fractions) to chemotherapy in locally advanced pancreatic cancer.
Chemotherapy alone VS Chemotherapy + SBRT (40 Gy/5 fractions)
KEY RESULTS
12-month locoregional recurrence: 20.2% vs 52% [SBRT + Chemo / Chemo alone] p = 0.022
Median OS: [illustrative curve] 22 vs 14 months p = 0.006 [SBRT + Chemo / Chemo alone]
Median PFS: [illustrative curve] 11.9 vs 6.3 months p = 0.002 [SBRT + Chemo / Chemo alone]
Severe toxicity: No statistically significant difference in severe toxicity. SBRT + Chemo vs Chemo alone
TAKE-HOME
Better local control and an encouraging 8-month median OS difference.
Reference
MASTERRLAN: A randomized phase II trial.
ESMO 2026. Abstract / Presentation.
Dr Najeed Aadil
Clinical Oncology & Radiation Medicine
KOL infographic: CLARITY-Gastric 01 (CG-01) LBA7 KOL-made infographic
🚨 ESMO26: A major breakthrough in CLDN18.2+ gastric cancer!
CLARITY-Gastric 01 (Phase III)
Sonesitatug vedotin vs physician’s choice:
🔹 3L+ OS: 10.0 vs 5.0 months (HR 0.47)
🔹 2L+ OS: 10.6 vs 6.4 months (HR 0.58)
🔹 Grade ≥3 TRAEs: 36.4% vs 44.8%
⚠️ PFS did not meet the prespecified significance threshold.
Verdict: A promising new ADC with substantial survival benefit, even in heavily pretreated patients.
#ESMO26 @myESMO @ESMO_open @ASCO @OncoAlert
Is this going to be story for #ESMO2026 day 3 ?
One thing is for sure , u may love it or u may not love it but u can not ignore it -ivonescimab
After NSCLC , it is BTC . @dr_yakupergun @JackWestMD @GABOUALFA @GIcancerDoc @GlopesMd @Timothee_MD @OncBrothers @OncoAlert @myESMO https://t.co/YhV7obtNt7
ESMO 2026 - DAY 3
HARMONi-GI1 DELIVERS
A NEW STEP FORWARD IN BILIARY TRACT CANCER!
HARMONi-GI1
Ivonescimab + Gem/Cis
LONGER SURVIVAL FOR OUR PATIENTS!
Median OS 14.9 months
OS HR 0.75
HARMONi-GI1
Ivonescimab + gemcitabine/cisplatin
First-line, unresectable or metastatic biliary tract cancer (China-only phase III study)
Median OS: 14.9 months (HR 0.75)
A practice-changing signal for first-line biliary tract cancer from HARMONi-GI1 at ESMO 2026 (Day 3).
KOL infographic: KOL text summary (phone screenshot): five Day 3 ESMO26 studies from a radiation
Day 3 at #ESMO26: five studies worth a closer look through a radiation oncology lens. My take on the key results and what they could mean for practice in GU, GI and lung cancers.
#RadOnc #SBRT https://t.co/iYTssWpk8o
Day 3 of ESMO - European Society for Medical Oncology 2026. Five studies that caught my attention from a radiation oncology perspective, focusing on GU, gastrointestinal and lung cancers:
DASL-HiCaP | Prostate cancer
Adding darolutamide to ADT and RT improved 4-year metastasis-free survival: 95% vs 88% (HR 0.42). Strong evidence for intensification in very high-risk disease. Postoperative RT patients were also included, although benefit in this subgroup needs clarification. Overall survival follow-up continues.
MASTERPLAN | Pancreatic cancer
SBRT (40 Gy/5 fractions) reduced 12-month locoregional recurrence from 52% to 20%, with median overall survival of 22 vs 14 months. Encouraging randomised phase II results, requiring confirmation in a larger trial.
UNION | Rectal cancer
Three-year event-free survival reached 91% with short-course RT, CAPOX and camrelizumab, compared with 77% with long-course chemoradiotherapy and CAPOX. A potential step forward for immunotherapy within a combined treatment strategy.
SARON | Oligometastatic NSCLC
Consolidative RT improved local control and progression-free survival, without a demonstrated overall survival benefit. These findings reinforce the need to individualise treatment and consider the RT approach used.
SANO | Oesophageal cancer
After complete clinical response, 5-year overall survival was 50% with surveillance vs 54% with surgery, but distant metastases were higher: 46% vs 29%. An option to discuss carefully with selected patients, requiring close surveillance and timely surgery for regrowth.
Plenty to discuss at our next multidisciplinary meetings.
1) KOL infographic: MV Onco infographic: (LBA8) ivonescimab vs durvalumab + GemCis in 1L BTC · 2) KOL infographic: MV Onco infographic: (LBA8) part 1/3 — rationale & design · 3) KOL infographic: MV Onco infographic: (LBA8) part 2/3 — efficacy (OS, PFS, ORR) · 4) KOL infographic: MV Onco infographic: (LBA8) part 3/3 — safety & verdict
HARMONi-GI1 | ESMO 2026 | LBA8
TWO TARGETS BEAT ONE! 🎯
Ivonescimab (PD-1 × VEGF) challenges durvalumab (PD-L1) in 1L advanced biliary tract cancer.
Phase III | n=682 | Both + GemCis
📊 OS: 14.9 vs 12.1 mo | HR 0.75 (p=0.0031)
PFS: 8.4 vs 5.8 mo | HR 0.61
ORR: 53.8% vs 32.5%
✅ Significant OS benefit against an established immunotherapy standard.
⚠️ Safety appears manageable, but VEGF-related toxicity deserves scrutiny. China-only population and 14.3-month median follow-up warrant caution.
The verdict: A compelling new first-line contender. Global practice change will require further validation and regulatory approval.
Ref: Zhou J et al. HARMONi-GI1. ESMO 2026; LBA8.
@myESMO @OncoAlert #ESMO26 #BTC #Ivonescimab #MVOnco
🚨 #ESMO26 | SANO Trial (LBA78)
Can we skip surgery after complete response to neoadjuvant CRT in oesophageal cancer?
5-year outcomes (n=309):
🔹 OS: 50% vs 54% (HR 1.17)
🔹 Distant metastases: 46% vs 29% (p<0.01)
🔹 43% spared non-beneficial oesophagectomy.
🎯 Verdict: Active surveillance offers organ preservation without a statistically significant OS difference, but higher distant metastases raise concern.
Could surveillance become a standard option for carefully selected patients?
@ESMO_open @my_esmo @ASCO @oncoalert
#SANO #EsophagealCancer
SANO
LBA78 | ESMO 2026
Active surveillance vs standard surgery after nCRT in oesophageal cancer
5-year results of a cluster-randomised trial
Patient population
Locally advanced oesophageal cancer with complete clinical response after nCRT
[check] No tumour on endoscopy, EUS or PET-CT
Active surveillance n = 198
VS
Standard surgery n = 111
5-year overall survival
50% (95% CI 34–57) Active surveillance
54% (95% CI 46–64) Standard surgery
HR 1.17 (95% CI 0.77–1.77)
Not statistically significant
5-year disease-free survival
HR 1.39
(95% CI 0.94–2.06)
Not statistically significant
5-year distant metastases
46% Active surveillance
29% Standard surgery
P < 0.01
Higher with active surveillance
43% avoided non-beneficial oesophagectomy
Take-home message
Similar 5-year OS with active surveillance in selected patients, but higher distant metastases. Organ preservation is feasible, with need for close follow-up.
@DrRishabhOnco #ESMO26 @ESMO_open @my_esmo
Schema and summary by Jeffrey Ryckman, MD: pembrolizumab + definitive CRT in esophageal/GEJ cancer, EFS CPS>=10 HR 0.97
KEYNOTE-975: adding pembro to definitive CRT didn't improve EFS in CPS>=10 esophageal/GEJ cancer. HR 0.97 (95% CI 0.77-1.23).
Hierarchy stopped there; OS wasn't formally tested. Another reason not to assume IO helps every CRT backbone.
#ESMO26 #radonc
https://t.co/JCWWmcCZHS https://t.co/SCdkZqxsjS
KEYNOTE-975
Pembrolizumab added to definitive CRT for esophageal cancer
Locally advanced
Esophageal / GEJ
Not surgical
candidates
n = 703
→ RANDOMIZE
CRT + placebo (n = 354) | Median EFS, CPS >=10* 14.7 mo
CRT + pembro (n = 349) | Median EFS, CPS >=10* 15.2 mo
*EFS in CPS >=10: HR 0.97 (95% CI 0.77-1.23), P = .3994; not statistically significant.
CPS >=10 OS: 35.0 vs 32.2 months; HR 1.00 (0.77-1.30), not formally tested after hierarchy failure.
Shah et al. ESMO 2026, 2875O. Phase III. CRT: FP + 50/60 Gy or FOLFOX + 50 Gy; up to 1 year of IO.
Schema and summary by Jeffrey Ryckman, MD: ARION: durvalumab + definitive CRT in esophageal cancer, 12-month central PFS 48.6% vs 48.9%
Jeff Ryckman@jryckman3
Post text
ARION adds to the negative IO+CRT story in esophageal cancer.
Durvalumab + FOLFOX/50 Gy in 25 fx: PFS HR 0.91 (95% CI 0.55-1.49), OS HR 0.99.
Only 112 pts, mostly SCC. No demonstrated benefit from adding durva here.
#ESMO26 #radonc
https://t.co/Pu9UrF0lrp https://t.co/EpbsJUnuQf
ARION
Durvalumab added to definitive CRT for esophageal cancer
Locally advanced
Esophageal cancer
77% squamous
n = 112
→ RANDOMIZE
FOLFOX + RT (n = 54) | 12-month central PFS* 48.9%
+ durvalumab (n = 58) | 12-month central PFS* 48.6%
*Primary endpoint: centrally reviewed PFS. HR 0.91 (95% CI 0.55-1.49), P = .351; not significant.
OS HR 0.99 (0.59-1.68), P = .489; not statistically significant. Reported P values are one-sided.
Modesto et al. ESMO 2026, 2879RO. Randomized phase II. IMRT 50 Gy/25 fx + FOLFOX; durvalumab monthly x12.
1) KOL infographic: (LBA82) MV Onco infographic: daraxonrasib OS/PFS headline · 2) KOL infographic: Part 1 infographic: design, OS, PFS · 3) KOL infographic: Part 2 infographic: OS HR by RAS mutation subgroup
🚨 KEYNOTE-975: NEGATIVE🚨
703 pts with unresectable esophageal/GEJ cancer
Pembro + dCRT vs dCRT
❌ EFS (PD-L1 CPS≥10): 15.2 vs 14.7m (HR 0.97)
❌ OS: 32.2 vs 35.0m (HR 1.00)
Study stopped after EFS endpoint not met.
#ESMO26 https://t.co/e4K5rKw4s5
2875O | KEYNOTE-975
Pembrolizumab or placebo plus concurrent definitive chemoradiotherapy in esophageal and gastroesophageal junction (GEJ) cancer: The phase 3 randomized KEYNOTE-975 study
Speaker: Manish A. Shah (New York, United States of America)
Lecture Time 13:50 – 14:00
Background
The role of immunotherapy in patients with locally advanced, esophageal cancer (EC) treated with definitive chemoradiotherapy (dCRT) is not established. KEYNOTE-975 (NCT04210115) is an international phase 3, randomized, double-blind, placebo-controlled multicenter study that examines dCRT ± pembrolizumab (pembro) in patients with previously untreated locally advanced unresectable esophageal and GEJ cancer. We report results from the second interim analysis (IA2).
Methods
Eligible patients with histologically confirmed cTX N+ M0 or cT2-T4a NX M0 esophageal squamous cell cancer (ESCC) or adenocarcinoma (EAC) or GEJ cancer, or cTX N+ M1 cervical or upper thoracic EC with supraclavicular lymph node metastases only, ECOG PS 0-1, and who were ineligible for curative surgery but suitable for dCRT, were randomized 1:1 to:
Pembrolizumab 200 mg Q3W for 8 cycles then 400 mg Q6W for 5 cycles + dCRT
vs
Placebo + dCRT
dCRT: site choice of 5-fluorouracil + cisplatin (FP) with radiotherapy (RT) 50 Gy or 60 Gy, or FOLFOX with RT 50 Gy.
Dual-primary endpoints were event-free survival (EFS) by investigator and overall survival (OS) in patients with PD-L1 combined positive score (CPS) ≥10, CPS ≥1, and all patients.
Data cut-off: January 21, 2026.
Results
A total of 703 patients were randomized (349 pembro + dCRT; 354 placebo + dCRT).
Median follow-up: 47.1 months (range, 21.7–70.2) in all patients.
Event-free survival (PD-L1 CPS ≥10)
Median 15.2 vs 14.7 months; HR 0.97 (95% CI, 0.77–1.23)
P = 0.3994 (boundary for significance 0.0193) → not improved with pembrolizumab.
Overall survival (PD-L1 CPS ≥10)
Median 32.2 vs 35.0 months; HR 1.00 (95% CI, 0.77–1.30)
Nominal P = 0.5003.
As EFS was not positive in PD-L1 CPS ≥10, EFS in PD-L1 CPS ≥1 and all patients, and OS were not tested for statistical significance, and the study was stopped.
Safety
Grade ≥3 AEs occurred in 100% of patients in each arm.
Grade 5 AEs: 44 (13%) with pembro vs 37 (10%) with placebo.
Discontinuation due to any AE: 117 (34%) with pembro vs 97 (27%) with placebo.
Conclusions
Pembrolizumab + dCRT vs placebo + dCRT did not significantly improve EFS in untreated unresectable esophageal or GEJ cancer with PD-L1 CPS ≥10. No new safety signals were observed.
1) KOL infographic: Part 1/4 - zanidatamab rationale and trial design (MV Onco infographic) · 2) KOL infographic: Part 3/4 - treatment exposure and tolerability (MV Onco infographic) · 3) KOL infographic: Part 4/4 - PD-L1 subgroups and clinical perspective
🚨 HERIZON-GEA-01 | ESMO 2026 — A New HER2 Standard?
Four slides. One important shift in first-line HER2+ gastroesophageal cancer.
🔹 Part 1: Why zanidatamab? Bispecific HER2 targeting and trial design.
🔹 Part 2: Three arms, three survival outcomes. OS HR 0.76 for Zani + CT and 0.65 for the triplet versus trastuzumab + CT.
🔹 Part 3: Longer treatment exposure, with no new safety signals reported.
🔹 Part 4: Who really needs PD-1 blockade? Added tislelizumab showed a numerical OS benefit, but missed statistical significance (P = 0.0502).
Take-home: Zanidatamab strengthens the HER2 backbone. The incremental value of tislelizumab remains uncertain.
📖 Shitara K et al. N Engl J Med. 2026;394:2002–2014. ESMO 2026, LBA79 (updated OS).
@myESMO @OncoAlert @larvol
#ESMO26 #HERIZONGEA01 #GastricCancer #HER2 #Zanidatamab #MVOnco
[Slide 1]
HERIZON-GEA-01 | ESMO 2026
WHY ZANIDATAMAB?
PART 1/4 | RATIONALE & DESIGN
MV Onco
ZANI; ECD 2; ECD 4; HER2; HER2
TWO EPITOPES. ONE ANTIBODY.
HER2 clustering ↑ | HER signalling ↓ | Immune killing ↑
PHASE III | N = 914 | 1:1:1
HER2+ untreated advanced/metastatic GEA
IHC 3+ or IHC 2+/ISH+ | ECOG 0–1
ARM A Trastuzumab + CT n = 308
ARM B Zanidatamab + CT n = 304
ARM C Zanidatamab + Tislelizumab + CT n = 302
CT: CAPOX or 5-FU/cisplatin | Primary endpoints: PFS + OS
IA2 | Median follow-up 35.3 months
TAKE-HOME
→ CAN ZANI REPLACE TRASTUZUMAB?
→ DOES ADDING TISLELIZUMAB HELP?
[Slide 3]
HERIZON-GEA-01 | ESMO 2026
THE SAFETY & TREATMENT STORY
PART 3/4 | EXPOSURE & TOLERABILITY
MV Onco
1 HOW LONG WERE PATIENTS TREATED?
MEDIAN TREATMENT DURATION
Zani + TIS + CT | 46.6 weeks
Zani + CT | 31.1 weeks
Tras + CT | 30.0 weeks
HER2 antibody exposure: 40.5 / 30.1 / 28.2 weeks, respectively.
2 SAFETY — A BALANCED VIEW
LONGER EXPOSURE | ONGOING MONITORING
✓ No new safety signals reported
✓ Safety consistent with IA1
✓ Prolonged treatment manageable
Longer exposure ≠ proof of better tolerability.
3 THE PRACTICAL REGIMEN
ZANIDATAMAB IV Q3W: < 70 kg → 1,800 mg; ≥ 70 kg → 2,400 mg
TISLELIZUMAB IV Q3W: 200 mg
CHEMOTHERAPY: CAPOX or 5-FU/cisplatin. Chemotherapy could be discontinued after ≥ 6 cycles.
4 TWO PRACTICAL PRECAUTIONS
INFUSION REACTIONS Protocol-mandated prophylaxis.
DIARRHOEA Protocol-mandated prophylaxis.
5 TAKE-HOME
LONGER TREATMENT EXPOSURE, WITHOUT NEW REPORTED SAFETY SIGNALS.
Updated detailed toxicity rates are needed for a fuller comparison.
[Slide 4]
HERIZON-GEA-01 | ESMO 2026
A NEW STANDARD — BUT FOR WHOM?
PART 4/4 | CLINICAL PERSPECTIVE
MV Onco
1 THE CLINICAL CROSSROADS
WHO REALLY NEEDS PD-1 BLOCKADE?
ZANI + CT | PD-L1 | ZANI + TIS + CT
2 CAN PD-L1 GUIDE US?
Incremental effect of TIS: Triplet vs Zani + CT
PD-L1 TAP | OS HR (95% CI)
< 1% | 0.76 (0.52 – 1.10)
≥ 1% | 0.77 (0.58 – 1.02)
BOTH CONFIDENCE INTERVALS CROSS 1.
No validated PD-L1 cutoff to select added TIS.
3 WHAT HAS CHANGED IN PRACTICE?
ESTABLISHED Zanidatamab + CT improves OS over trastuzumab + CT.
PROMISING, NOT PROVEN Incremental OS benefit from adding tislelizumab.
STILL UNRESOLVED Optimal selection for PD-1 blockade.
4 THE REAL-WORLD QUESTION
Who truly needs TIS? | Can biomarkers guide treatment intensity? | How do toxicity, cost and access affect Indian practice?
5 TAKE-HOME
✓ ZANIDATAMAB ESTABLISHES A NEW HER2-DIRECTED BACKBONE.
✓ THE ADDED VALUE OF TISLELIZUMAB REMAINS UNCERTAIN.
A stronger HER2 backbone. An unanswered immunotherapy question.
4 studies I’m watching today at #ESMO26
Presidential Symposium II (16:30 CET): KRAScendo 1, SAFFRON, CLARITY-Gastric 01 and HARMONi-GI1.
Which one are you waiting for?
I’ll post notes right after each LBA.
#Oncology https://t.co/2qVqWcF773
drozdogan.com · Evidence Notes | #ESMO26 · PS II
4 STUDIES I AM WATCHING TODAY
Presidential Symposium II · 16:30 CET
Notes shared right after each LBA
MUSTAFA ÖZDOĞAN MD · MADRID 2026
Curious about all four · absolute benefit first, then HR, then what stays open
LBA5 | Lung | KRAScendo 1
Previously treated KRAS G12C-mutated advanced NSCLC
divarasib vs sotorasib or adagrasib
THE QUESTION: Can a next-generation inhibitor beat today's options head to head?
LBA6 | Lung | SAFFRON
EGFR-mutated, MET-overexpressed and/or amplified NSCLC after osimertinib
osimertinib + savolitinib vs platinum–pemetrexed
THE QUESTION: Does MET-targeted therapy beat chemotherapy after progression on osimertinib?
LBA7 | Gastric | CLARITY-Gastric 01
CLDN18.2-positive advanced gastro-oesophageal carcinoma, second line or later
sonesitatug vedotin
THE QUESTION: How much can a CLDN18.2-directed ADC add in later lines?
LBA8 | Biliary | HARMONi-GI1
First-line advanced biliary tract cancer
ivonescimab + chemotherapy vs durvalumab + chemotherapy
THE QUESTION: Can it improve on the current durvalumab–chemotherapy standard?
YOUR TURN: Which one are you waiting for?
Independent commentary · INN only · session details may change
@ozdogan_md
KOL infographic: MV Onco infographic: (LBA8) 'The Topaz Ring Changes Hands' — ivonescimab
💍 THE TOPAZ RING CHANGES HANDS!
At ESMO 2026, HARMONi-GI1 challenges the TOPAZ-1 standard in 1L advanced biliary tract cancer.
Ivonescimab + GemCis vs Durvalumab + GemCis
📊 Median OS: 14.9 vs 12.1 months | HR 0.75
Dual PD-1 × VEGF targeting delivers a survival advantage over PD-L1 inhibition.
💎 The ring has a new contender. Will practice follow?
Ref: HARMONi-GI1, ESMO 2026, LBA8.
@myESMO @OncoAlert @larvol #ESMO26 #BiliaryTractCancer #MVOnco
[Slide 1]
CLARITY-Gastric01 | ESMO 2026 | LBA7
MV Onco
A GIANT OS LEAP. A TINY PFS STEP!
I DOUBLED MEDIAN SURVIVAL!
BUT PFS BARELY MOVED!
3L+ OVERALL SURVIVAL
Sone-Ve 10.0 MONTHS
Control 5.0 MONTHS
HR 0.47
p <0.001
Sone-Ve (sonesitatug vedotin)
CLDN18.2-targeted MMAE ADC
2L+ PFS (ITT)
Sone-Ve 4.2 MONTHS
Control 3.8 MONTHS
HR 0.77
PRESPECIFIED SIGNIFICANCE THRESHOLD MISSED
1 BROADER TARGETING
CLDN18.2 ≥25%
MMAE ADC
2 2L+ OVERALL SURVIVAL
10.6 vs 6.4 MONTHS
OS HR 0.58
Sone-Ve vs investigator's choice
3 GRADE ≥3 TRAEs
36.4% vs 44.8%
Sone-Ve vs control
A REMARKABLE SURVIVAL WIN – BUT WHY THE OS-PFS DISCONNECT?
POTENTIALLY PRACTICE-CHANGING. QUESTIONS REMAIN.
[Slide 2]
CLARITY-Gastric01 | ESMO 2026 | LBA7
THE CLDN18.2 ADC CHALLENGER! MV Onco
PART 1/3 | RATIONALE & DESIGN
1. WHAT IS SONE-VE?
• SONESITATUG VEDOTIN
• CLDN18.2-directed ADC
• Antibody + MMAE payload
• CLDN18.2 binding → Internalisation → Microtubule disruption
• Targeted delivery of cytotoxic chemotherapy.
2. WHO WAS ELIGIBLE?
• Advanced gastric / GEJ carcinoma
• Progression after ≥1 systemic regimen
• CLDN18.2 ≥25%
• Any membranous staining intensity
• Second line and beyond (2L+)
Broader CLDN18.2 expression threshold!
3. TRIAL DESIGN
GLOBAL PHASE III | OPEN-LABEL
532 patients — selected-dose comparison
• SONE-VE (n=267)
2.2 mg/kg
VS
• INVESTIGATOR'S CHOICE (n=265)
• 2L → Ramucirumab + paclitaxel / taxane
• 3L+ → Irinotecan / trifluridine-tipiracil / apatinib*
• Taxane = paclitaxel or docetaxel; apatinib China only.
• 594 total randomised, including initial dose-selection patients.
4. WHAT WERE THE ENDPOINTS?
TWO CO-PRIMARY ENDPOINTS
• 3L+ → Overall survival
• 2L+ → PFS (BICR)
KEY SECONDARY ENDPOINT
• 2L+ → Overall survival
TAKE-HOME
CAN A CLDN18.2 ADC IMPROVE SURVIVAL BEYOND STANDARD CHEMOTHERAPY?
NEXT → OS DOUBLES. PFS STUMBLES!
[Slide 3]
CLARITY-Gastric01 | ESMO 2026 | LBA7
OS DOUBLES. PFS STUMBLES! MV Onco
PART 2/3 | EFFICACY
1. THE BIG SURVIVAL WIN — 3L+
THIRD LINE & BEYOND — PRIMARY OS ENDPOINT
SONE-VE | 10.0 months
INVESTIGATOR'S CHOICE | 5.0 months
n = 178 vs 177
OS HR 0.47
95% CI 0.36–0.62 | p < 0.001
MEDIAN SURVIVAL DOUBLED!
2. THE BENEFIT EXTENDS TO 2L+
SECOND LINE & BEYOND — ITT OS (KEY SECONDARY ENDPOINT)
SONE-VE | 10.6 months
INVESTIGATOR'S CHOICE | 6.4 months
n = 267 vs 265
OS HR 0.58
95% CI 0.47–0.73 | p < 0.001
+ 4.2 MONTHS MEDIAN OS
3. THE PFS PARADOX!
ITT PFS (BICR) — CO-PRIMARY ENDPOINT
SONE-VE | 4.2 months
INVESTIGATOR'S CHOICE | 3.8 months
PFS HR 0.77
95% CI 0.62–0.96 | p = 0.05
PRESPECIFIED SIGNIFICANCE THRESHOLD NOT MET
BICR-assessed PFS • Co-primary endpoint
3L+ OS: 5.0 months → 10.0 months (I made a giant leap!)
2L+ ITT PFS: 3.8 months → 4.2 months (I barely moved!)
TAKE-HOME
A powerful OS benefit — despite missing the PFS threshold.
WHY THE DISCONNECT?
NEXT → SAFETY & THE CLINICAL VERDICT
[Slide 4]
CLARITY-Gastric01 | ESMO 2026 | LBA7
A NEW STANDARD — OR MORE QUESTIONS? MV Onco
PART 3/3 | SAFETY & VERDICT
1. WAS SONE-VE SAFER?
GRADE ≥3 TREATMENT-RELATED AEs
36.4% vs 44.8%
SONE-VE | INVESTIGATOR'S CHOICE
• GI toxicity: 11.1% vs 6.3%
• Haematological toxicity: 7.7% vs 15.9%
• TRAE-related deaths: 1.1% vs 0.8%
• Less severe haematological toxicity, but more GI toxicity.
2. DOES CLDN18.2 EXPRESSION MATTER?
OVERALL SURVIVAL — 2L+ ITT
• CLDN18.2 ≥75% | HR 0.59
• CLDN18.2 ≥25% to <75% | HR 0.63
• OS benefit observed across both expression subgroups.
Exploratory subgroup findings.
3. THE BIG UNANSWERED QUESTION!
OS HR 0.47 (3L+) | PFS HR 0.77 (2L+)
Different analysis populations.
Possible influences:
• Post-progression treatment
• Timing of treatment effects
• Differences in survival-curve patterns
EXPLANATION NOT YET ESTABLISHED!
Median follow-up: 8.6 months.
4. CLINICAL VERDICT
THE GOOD
• Striking 3L+ OS advantage
• Broader CLDN18.2 eligibility (≥25%)
• Numerically fewer grade ≥3 TRAEs
THE CAUTION
• Co-primary PFS threshold missed
• OS–PFS discordance unexplained
• Longer follow-up and sequencing data needed
TAKE-HOME
A POWERFUL SURVIVAL SIGNAL.
POTENTIALLY PRACTICE-CHANGING — BUT QUESTIONS REMAIN.
Schema and summary by Jeffrey Ryckman, MD: UNION schema: SCRT + CAPOX + camrelizumab vs long-course CRT, 3-year EFS (Lin, ESMO 2026 3530O)
Jeff Ryckman@jryckman3
Post text
UNION: 3y EFS 91% vs 77% with SCRT/CAPOX/camrelizumab vs long-course CRT/CAPOX in rectal cancer. HR 0.33 (95% CI 0.15-0.71).
Impressive signal. But RT schedule and IO both changed, so this doesn't isolate the benefit of either.
#ESMO26 #radonc
https://t.co/IU5gid4jyS https://t.co/8GwAXPEpzH
SANO — SAY NO to routine surgery!
After nCRT and complete clinical response in oesophageal cancer:
5-year OS: 50% vs 54% — no significant difference.
Distant metastases: 46% vs 29% — significantly higher with surveillance.
The message: Organ preservation is feasible, but surveillance is not risk-free.
Surgery when needed — NOT surgery never!
#ESMO26 #SANO #MVOnco @myESMO @OncoAlert
SANO | ESMO 2026 | LBA78
SAY NO TO ROUTINE SURGERY?
But NOT to surgery when needed!
MV Onco
OESOPHAGEAL CANCER
nCRT → Complete Clinical Response
ACTIVE SURVEILLANCE | IMMEDIATE SURGERY
Preserved oesophagus | Oesophagectomy
WHAT HAPPENED AT 5 YEARS?
OVERALL SURVIVAL: 50% Surveillance vs 54% Surgery
No statistically significant difference.
DISTANT METASTASES: 46% Surveillance vs 29% Surgery
Significantly MORE with surveillance!
SANO SAYS: Surveillance is feasible in selected patients. BUT more distant metastases raise concern.
SURGERY AS NEEDED – NOT SURGERY NEVER!
Careful selection • Close surveillance • Timely salvage surgery
KOL infographic: ctDNA kinetics case: BRAF V600E mCRC on FOLFIRI + encorafenib + cetuximab
Pashtoon Kasi MD, MS@pashtoonkasi
Post text
@UGrewalMD #ESMO26 we have had many patients get to conversion therapy & resection of oligo-metastatic disease. Rendered NED.
Against treatment nihilism for patients with metastatic BRAFV600E mutant colorectal cancer.
With better systemic options, surgery depending on sites is an option. https://t.co/1ZVYNhh1eY
1) KOL infographic: radiation oncology perspective: eight selected trial highlights · 2) KOL infographic: Screenshot of KOL post text: radiation oncology perspective · 3) KOL infographic: Screenshot of KOL post text: radiation oncology perspective
As #ESMO26 ends in Madrid, eight trials caught my attention from a radiation oncology perspective.
From treatment intensification to organ preservation, positive and negative results give us plenty to discuss at our MDT meetings.
My highlights below 👇
#RadOnc #SBRT https://t.co/IqszNOxeNe
[Slide 1]
ESMO 2026
A radiation oncology perspective
Selected trial highlights
01 DASL-HiCaP | Prostate
Darolutamide + ADT + RT: 4-year MFS 95% vs 88%
02 PE-PE | Kidney
Pembrolizumab + local therapy: median RFS 25.4 vs 11.0 months
03 MASTERPLAN | Pancreas
SBRT: 12-month recurrence 20% vs 52%; median OS 22 vs 14 months
04 UNION | Rectum
Combined treatment: 3-year EFS 91% vs 77%
05 SARON | Lung
Improved local control and PFS; no demonstrated OS benefit
06 SANO | Oesophagus
5-year OS: 50% vs 54%; no statistically significant difference
07 KEYNOTE-975 | Oesophagus
No significant EFS benefit from adding pembrolizumab
08 NRG-GY020 | Endometrium
No significant RFS improvement with pembrolizumab
Randomised trial results • Interpretation and patient selection matter
[Slide 2]
As ESMO - European Society for Medical Oncology 2026 comes to an end today in Madrid, I wanted to share an updated selection of studies that caught my attention from a radiation oncology perspective:
DASL-HiCaP | Prostate cancer
Adding darolutamide to ADT and radiotherapy improved 4-year metastasis-free survival from 88% to 95% (HR 0.42). Patients receiving postoperative radiotherapy were also included, although the benefit in this subgroup needs further clarification. Overall survival follow-up continues.
PE-PE | Oligometastatic renal cell carcinoma
Adding pembrolizumab to metastasis-directed therapy improved median relapse-free survival from 11.0 to 25.4 months (HR 0.47). Most patients received SABR. Promising phase II results, although overall survival data remain immature and side effects need to be considered.
MASTERPLAN | Pancreatic cancer
Adding SBRT (40 Gy in 5 fractions) to chemotherapy reduced 12-month locoregional recurrence from 52% to 20%. Median overall survival also favoured SBRT: 22 versus 14 months (HR 0.45). Encouraging phase II results, although the survival finding was a secondary endpoint and requires confirmation in a larger trial.
UNION | Rectal cancer
A strategy combining short-course radiotherapy, CAPOX and camrelizumab improved 3-year event-free survival: 91% versus 77% with long-course chemoradiotherapy and CAPOX. As both radiotherapy and systemic treatment differed between groups, the contribution of each component cannot be separated.
[Slide 3]
SARON | Oligometastatic NSCLC
Consolidative radiotherapy improved local control and progression-free survival, without a demonstrated overall survival benefit. Patient selection remains essential.
SANO | Oesophageal cancer
After a complete clinical response to neoadjuvant chemoradiotherapy, 5-year overall survival was 50% with active surveillance versus 54% with surgery, with no statistically significant difference. However, distant metastases were more frequent with surveillance: 46% versus 29%. An option for carefully selected patients, with close follow-up.
KEYNOTE-975 | Oesophageal cancer
Adding pembrolizumab to definitive chemoradiotherapy did not improve the primary event-free survival endpoint in patients with PD-L1 CPS ≥10.
NRG-GY020 | Endometrial cancer
Adding pembrolizumab to adjuvant radiotherapy did not significantly improve recurrence-free survival in early-stage, high-intermediate-risk dMMR endometrial cancer, and side effects were more frequent.
KOL infographic: (LBA78) evidence-notes infographic
Similar five-year survival — but seventeen more patients in a hundred develop distant metastases under active surveillance. SANO (LBA78, #ESMO26)
Surgery As Needed for Oesophageal cancer; multicentre stepped-wedge cluster-randomised non-inferiority phase 3 after CROSS-style neoadjuvant chemoradiotherapy and complete clinical response.
@Annals_Oncology @myESMO @OncoAlert @ErasmusMC
IROCAS
Phase III: adjuvant mFOLFIRINOX vs mFOLFOX6
R0-resected pT4 and/or N2 colon adenocarcinoma n=795
1:1 RANDOMIZE
mFOLFOX6 (n=397) q2w ×12 cycles | 3y DFS 66.3% | G≥3 diarrhea 3.8%
mFOLFIRINOX (n=398) q2w ×12 cycles | 3y DFS 65.6% | G≥3 diarrhea 15.6%
DFS HR 1.07 (mFOLFIRINOX vs mFOLFOX6)
Ann Oncol. DOI: 10.1016/j.annonc.2026.10.104. ESMO 2026, LBA29.
Primary endpoint: 3-year DFS (ITT).
Design from verified ESMO abstract; paper full text not read.
1) KOL infographic: (LBA78) MV Onco infographic: active surveillance vs oesophagectomy headline · 2) KOL infographic: Part 1 infographic: design and 5-year survival · 3) KOL infographic: Part 2 infographic: distant metastasis paradox and trade-off
🚨 SANO | ESMO 2026 | LBA78
SAVE THE OESOPHAGUS. BUT AT WHAT COST?
Can we safely avoid oesophagectomy after complete clinical response to neoadjuvant chemoradiotherapy?
🔹 SANO 5-year results (N=309)
Active surveillance vs surgery:
• 5-year OS: 50% vs 54% (HR 1.17)
• DFS: HR 1.39
• Distant metastases: 46% vs 29% (P < 0.01)
• 43% avoided an oesophagectomy classified as non-beneficial.
⚠️ The paradox: No statistically significant OS difference, yet 17 percentage points MORE distant metastases with surveillance.
TAKE-HOME
Organ preservation is feasible in selected patients, but long-term oncological equivalence remains uncertain. Careful selection, intensive surveillance and access to salvage surgery are essential.
Are we preserving the oesophagus at the cost of distant disease control?
📖 Ref: Gangaram-Panday SS et al. SANO trial: 5-year results. ESMO 2026; LBA78.
#MVOnco #ESMO2026 #SANO #EsophagealCancer #Oncology
[Slide 1]
SANO | ESMO 2026 | LBA78
Save the Oesophagus.
But at what cost?
MV Onco
COMPLETE CLINICAL RESPONSE (cCR)
[illustration: oesophagus branching to two strategies]
ACTIVE SURVEILLANCE
OESOPHAGECTOMY
OESOPHAGUS PRESERVED
5-year OS: 50%
5-year OS: 54%
[illustrations: liver, lungs, bone with metastases]
Distant metastases: 46%
Distant metastases: 29%
SIMILAR SURVIVAL.
+17% POINTS DISTANT METASTASES.
Does organ preservation compromise distant disease control?
Association observed; causality not established.
[Slide 2]
SANO | ESMO 2026 | LBA78
Part 1 – Can We Avoid Oesophagectomy After Complete Response?
MV Onco
01 THE CLINICAL QUESTION
• Locally advanced oesophageal cancer.
• Complete clinical response (cCR) after neoadjuvant chemoradiotherapy:
• Must everyone undergo oesophagectomy?
• Or can we monitor and operate only when needed?
02 THE SANO TRIAL
• Multcicentre, cluster-randomised trial.
• N = 309
• Active surveillance: 198 patients
• Standard surgery: 111 patients
• Median follow-up: 76 months
• cCR assessed by endoscopic biopsies, EUS and PET-CT.
03 FIVE-YEAR SURVIVAL
Active Surveillance vs Surgery
• 5-year OS:
50% vs 54%
HR 1.17 (95% CI 0.77–1.77)
No statistically significant difference.
• DFS:
HR 1.39 (95% CI 0.94–2.06)
No statistically significant difference.
No significant difference ≠ Proven equivalence.
04 HOW MANY AVOIDED SURGERY?
43% (85/198)
• Avoided an oesophagectomy classified as non-beneficial.
• Included patients with sustained cCR or early distant metastatic progression.
Organ preservation is feasible in selected patients.
BUT THERE IS A CATCH...
SAME SURVIVAL. MORE METASTASES?
Continued in Part 2.
[Slide 3]
SANO | ESMO 2026 | LBA78
Part 2 – Same Survival. More Metastases?
MV Onco
01 THE DISTANT METASTASIS PARADOX
5-year cumulative incidence:
Active Surveillance vs Surgery
46% vs 29%
+17 percentage points
P < 0.01
Significantly MORE distant metastases with surveillance.
Yet 5-year OS was not significantly different.
02 HOW CAN THIS HAPPEN?
Possible explanations:
• Subsequent treatments may influence survival.
• Longer follow-up may reveal survival differences.
• The study may lack precision to detect an OS difference.
The mechanism remains unproven.
Does residual local disease contribute to distant spread?
An important hypothesis — NOT established.
03 THE ORGAN-PRESERVATION TRADE-OFF
WHAT WE GAIN
• 43% avoided an oesophagectomy classified as non-beneficial.
• Earlier results showed better quality of life.
WHAT CONCERNS US
• Higher distant-metastasis incidence.
• Uncertain long-term oncological equivalence.
Organ preservation ≠ Risk-free surveillance.
04 TAKE-HOME
Active surveillance is a feasible option in carefully selected patients achieving cCR after nCRT.
Requires:
• Expert multidisciplinary assessment.
• Intensive surveillance.
• Timely salvage surgery when indicated.
5-year OS: No significant difference.
Distant metastases: Significantly higher.
THE KEY QUESTION: Are we preserving the oesophagus at the cost of distant disease control?
KOL infographic: MV Onco infographic: vs KEYNOTE-811 cross-trial comparison table
HERIZON-GEA-01 vs KEYNOTE-811
TWO TRIALS. TWO HER2 STRATEGIES.
MV Onco
Parameter | HERIZON-GEA-01 | KEYNOTE-811
Phase / N | III / 914 | III / 698
Experimental arm | Zani + TIS + CT | Tras + Pembro + CT
Control arm | Tras + CT | Tras + CT
PD-L1 eligibility | All-comers | All-comers
PD-L1 assay | TAP | CPS
Median follow-up | 35.3 mo | 50.2 mo
Median PFS | 12.4 vs 8.1 mo | 10.0 vs 8.1 mo
PFS HR | 0.63 | 0.73
Median OS | 27.0 vs 19.6 mo | 20.0 vs 16.8 mo
OS HR | 0.65 | 0.80
PD-L1 negative OS HR | 0.70 (0.44-1.13) | 1.10 (0.72-1.68)
PD-L1 positive OS HR | 0.68 (0.52-0.89) | 0.79 (0.66-0.95)
Grade ≥3 AEs | 83.3% vs 74.5% | 59% vs 51%
Core message | Stronger HER2 backbone | Proven IO addition
➤ HERIZON: ZANIDATAMAB APPEARS TO ESTABLISH A STRONGER HER2 BACKBONE.
➤ KEYNOTE-811: PEMBROLIZUMAB CLEARLY ADDS BENEFIT TO TRASTUZUMAB + CT.
➤ ADDITIONAL BENEFIT OF TISLELIZUMAB OVER ZANI + CT REMAINS UNCERTAIN (HR 0.81; P = 0.0502).
NO HEAD-TO-HEAD COMPARISON • TAP ≠ CPS
KOL infographic: KOL-made AI-style branded summary graphic
WHAT IF THE CLOCK MATTERS? ⏰
RT–immunotherapy trials can produce strikingly different results. KEYNOTE-975 was negative but when is IO actually given relative to RT?
Future RT–IO trials should not treat chronotherapy as an afterthought.
Presented by @MDmanishshah #ESMO26 https://t.co/BSCCkCYxos
KEYNOTE-975 | 2026
SAME DRUG, DIFFERENT TIMING?
Adding pembrolizumab to definitive chemoradiotherapy did not improve outcomes in unresectable esophageal and gastroesophageal junction cancer.
Could the clock be part of the problem?
We may be ignoring when we give immunotherapy.
STUDY DESIGN
Unresectable esophageal and gastroesophageal junction cancer | Phase 3 | KEYNOTE-975 | n ≈ 703
Patients: Unresectable esophageal and gastroesophageal junction cancer, n ≈ 703
Definitive chemoradiotherapy (standard of care) 50 or 60 Gy (chosen by centers, not randomized) ← R → Definitive chemoradiotherapy + pembrolizumab
KEY RESULTS
EFS (PD-L1 CPS ≥10): HR 0.97; Median 15.2 vs 14.7 months
EFS (all patients): HR 0.94
OS (all patients): HR 1.00; Median 32.2 vs 35.0 months (Some reports listed OS as 0.99.)
No clinically meaningful improvement in EFS or OS with the addition of pembrolizumab.
WHY IT MATTERS?
A negative result raises biology + timing questions.
Concurrent RT–immunotherapy trials can produce heterogeneous results.
Immunotherapy trial design should not ignore chronotherapy.
How should immunotherapy timing be scheduled in patients receiving radiotherapy?
EXPERT TAKEAWAY
Not every negative study means the combination is worthless.
It may mean the right patient, the right context, and the right timing are still unresolved.
drozdogan.com Source: KEYNOTE-975 • ESMO 2026 (LBA)
1) KOL infographic: (LBA77) MV Onco infographic: IBI343 vs chemotherapy headline · 2) KOL infographic: Part 1 infographic: design, PFS/ORR, OS results · 3) KOL infographic: Part 2 infographic: mechanism, safety, sequencing
G-HOPE-001 | ESMO 2026 | LBA77
SAME TARGET. NEW WEAPON. 🎯
Can a CLDN18.2-targeted ADC outperform chemotherapy in heavily pretreated gastric/GEJ cancer?
Arcotatug tavatecan (IBI343) vs chemotherapy | Phase III | N=408
🔹 PFS: 5.5 vs 2.9 months (HR 0.47)
🔹 ORR: 23.6% vs 5.3%
🔹 OS: 9.9 vs 7.4 months (HR 0.63; immature)
🔹 Grade ≥3 TEAEs: 45.8% vs 57.9%
🔹 ILD: No cases observed.
TAKE-HOME
A 53% reduction in progression/death hazard with a favourable safety signal.
But mature OS and efficacy after prior zolbetuximab remain key unanswered questions.
Ref: Shitara K et al. G-HOPE-001. ESMO 2026; LBA77.
#MVOnco #ESMO2026 #GastricCancer #CLDN182 #ADC
AZUR-1 (LBA87):
Single-arm dostarlimab 500 mg q3w x9 in dMMR/MSI-H LARC.
cCR12 by central review, the registry primary: 47% (54/116). Investigator-assessed: 68% among 144 pts. ICR confirmed cCR later, with different evaluable populations.
The dostarlimab-alone surveillance path avoids RT, chemo and surgery.
#ESMO26 #OncTwitter
https://t.co/rOJbf5J8i8
drozdogan.com · Evidence Notes
#ESMO26 · LBA7
CLARITY-Gastric 01
CLDN18.2-positive advanced gastric/GEJ cancer · second line or later
sonesitatug vedotin vs investigator's choice · Rui-Hua Xu
OS met in 2L+ and 3L+ · BICR PFS not significant
STUDY DESIGN
2L+ (267 vs 265) n = 532
3L+ (178 vs 177) n = 355
Control Investigator's
Primary OS in 3L+
ABSOLUTE OUTCOMES · MEDIAN OS
Second line or later (ITT)
Sonesitatug 10.6
Control 6.4
months (median)
Absolute Δ +4.2 mo
Relative HR 0.58 (0.47–0.73)
12-mo OS 42.6% vs 27.8%
Third line or later (primary)
Sonesitatug 10.0
Control 5.0
months (median)
Absolute Δ +5.0 mo
Relative HR 0.47 (0.36–0.62)
12-mo OS 38.1% vs 18.1%
Control = investigator's choice of therapy
THE TAKE
Clear OS benefit in later lines, but BICR PFS missed significance (HR 0.77, p = 0.053)
CLDN18.2 LEVEL · SAFETY
OS · CLDN18.2 ≥75% HR 0.59 95% CI 0.45–0.78
OS · CLDN18.2 25–<75% HR 0.63 95% CI 0.42–0.94
Grade ≥3 TRAEs 36.4% vs 44.8% no new safety signals
Investigator-assessed PFS (exploratory) HR 0.59, 4.4 vs 3.0 mo · ORR, discontinuations, ocular and neuropathy events not in the release
HOW TO READ
Absolute first: +4.2 mo OS in 2L+ and +5.0 mo in 3L+. OS is the strength, BICR PFS was not significant, and the control is investigator's choice. Check ORR, discontinuations and ocular/neuropathy events on the slides.
Schema and summary by Jeffrey Ryckman, MD: HRS-4642 + GnP with or without adebrelimab, perioperative KRAS
Perioperative responses w/ HRS-4642 + GnP ± adebrelimab in KRAS G12D-mutant pancreatic cancer (LBA85).
📌 Phase 2, 30 pts per cohort; cohorts are not randomized against each other. Cohort 1: HRS-4642 + GnP; Cohort 2: HRS-4642 + GnP + adebrelimab.
📌 All pts ECOG 1 at baseline. Resectability status at baseline unclear from the abstract (only stage reported: I/II/III 3%/67%/30% in Cohort 1 vs 0%/60%/40% in Cohort 2). All received neoadjuvant therapy.
📌 ORR 63% (19 PR) and 87% (26 PR), respectively; tumor shrinkage in all pts. All pts w/ baseline CA19-9 >ULN had a ≥50% reduction.
📌 Surgery in 23 and 29 pts, respectively. Among resected pts: R0 100% and MPR 17% in both cohorts.
📌 6-mo EFS 87% and 96%, respectively.
📌 TRAEs in all pts; grade ≥3 TRAEs 47% and 53%, respectively, most commonly neutropenia and leukopenia. No fatal TRAEs; none precluded surgery.
https://t.co/GTq3vjFTpC
#ESMO26 #PancreaticCancer
drozdogan.com · Evidence Notes
#ESMO26 · 3438O
NOUS-209
Lynch syndrome · cancer interception revaccination
Phase 1b/2 neoantigen vaccine · ~1 yr after initial series · Vilar-Sanchez
Presented Oct 25 · early-phase · immunogenicity ≠ proven prevention
STUDY DESIGN
Phase
1b / 2
Revax compare
n ≈ 28
Colonoscopy F/U
n = 17
Hall
Granada 4
RE-VAX PATHWAY · ~1 year after GAd prime + MVA boost
Initial · GAd → MVA
RAND
Arm A · full
Arm B · MVA-only
Arm A · full re-prime-boost
GAd at wk 52 → MVA at wk 60
Same vaccine again
Arm B · MVA-only booster
MVA at wk 52 (single neoantigen boost)
Strongest T-cell boost
T-CELL BOOST AFTER RE-VAX · Apoape n≈28 (amber)
Arm B · MVA-only ~93%
Arm A · full regimen ~64%
Absolute: ~93 of 100 boosted (MVA-only) vs ~64 of 100 (full) · not prevention efficacy
COLONOSCOPY SIGNAL · SAFETY
Follow-up colonoscopy
0 CRC · 0 advanced adenoma
n = 17 evaluable · Larvol / Apoape
MDACC: no advanced CRC on F/U scopes
Tolerability
Well tolerated
No severe side effects (MDACC)
No vaccine-attributed SAE (SITC)
Prior lock · Nature Medicine D'Alise 2026 (Ph1b/2)
Safe · durable T-cell responses · no new advanced adenomas at 1 yr · amber if mixing datasets
CLINIC ASK
Which re-vax schedule for the next study — and will adenoma / CRC endpoints be powered?
HOW TO READ · AMBER
Early-phase · no placebo-controlled prevention efficacy yet.
Small n for colonoscopy follow-up (n=17) · boost % from secondary coverage (Apoape).
Immunogenicity ≠ proven cancer prevention.
FDA Fast Track / planned registrational trial = development context, not efficacy.
Prior Nature Medicine Ph1b/2 and this oral's n=17 F/U are related but not one dataset.
Independent commentary · Nous-209 / neoantigen vaccine · not practice-changing alone
@ozdogan_md
Schema and summary by Jeffrey Ryckman, MD: active surveillance vs standard surgery after nCRT - study schema summary
Full SANO paper is out! (Ann Oncol, open access)
What it adds:
Death from esophageal cancer at 5y: 40% with active surveillance vs 30% with surgery (HR 1.67, 95% CI 1.02–2.73). Other-cause death: 10% vs 15% (HR 0.49, 0.22–1.09). These are competing-risk secondary outcomes.
Of 91 metastases in the surveillance arm, 44 came after delayed oesophagectomy, a median 11.1 mo after regrowth (not after surgery). 22 were found within 6 mo of nCRT.
Regrowth was associated with later metastasis (HR 2.49), but the trial can't separate seeding from biology.
Regrowth risk comes early: ~21% remaining if still in cCR at 1 year, 2% at 3 years.
The "43% spared esophagectomy" figure includes patients with early metastases. Durable organ preservation: 32% in cCR at last evaluation, and 21% completed 5 years of surveillance.
The protocol does define volumes (§8.3.2): regional nodes within ≥3 cm craniocaudal, 3 mm radial CTV, 1 cm PTV. There's no RTQA or adherence analysis.
Adjuvant systemic therapy isn't reported.
The authors now call it "selectively delayed surgery rather than surgery avoidance." Fair.
#ESMO26 #radonc @KrishanJethwa
https://t.co/n5RpZK9zls
SANO: active surveillance vs standard surgery after nCRT
Stepped-wedge cluster-randomised non-inferiority trial (Netherlands); mITT N=309
Locally advanced oesophageal / OGJ carcinoma -> nCRT (CROSS): Carbo AUC2 + pacli 50 mg/m² wkly ×5, 41.4 Gy / 23 fx -> Clinical complete response: Endoscopy/biopsy, EUS, PET-CT
-> CONTROL n=111: Standard surgery, Oesophagectomy after cCR
-> EXPERIMENTAL n=198: Active surveillance, Surgery only for locoregional regrowth without distant metastases
Primary endpoint: 2-year OS (non-inferiority). Long-term: 5-year OS, DFS, distant metastases.
5y OS: surgery 54% (95% CI 46-64) vs AS 50% (95% CI 43-57); HR 1.17 (95% CI 0.77-1.77). 5y distant mets 29% vs 46%.
Panday et al. Ann Oncol 2026. doi:10.1016/j.annonc.2026.10.1290
KOL infographic: Text excerpt: relevant ongoing first-line biliary tract cancer trials
📊 HARMONi-GI1 - Phase 3 (Akeso release, ESMO LBA8)
🎯 First-line advanced biliary tract cancer, China
💊 Ivonescimab (PD-1/VEGF) + gem-cis vs durvalumab + gem-cis
👥 682 patients, interim analysis
✅ OS 14.9 vs 12.1 mo, HR 0.75
✅ PFS 8.4 vs 5.8 mo, HR 0.61
📈 ORR 53.8% vs 32.5%
🩸 Grade ≥3 bleeding 1.5% vs 1.8%
⚠️ China only, interim analysis
A head-to-head win over TOPAZ-1. The US ECOG-ACRIN trial will decide it for Western patients.
Potential new SOC? Yes, but:
⚠️ This is an interim analysis with immature follow-up. Median follow-up was 14.3 months, and the 18-month OS difference rests on few patients still at risk. TOPAZ-1's benefit grew with longer follow-up (HR 0.80 → 0.76 → 0.74 → 0.75). Durability needs to be confirmed in both directions.
⚠️ Post-progression treatment was imbalanced. Only 31.8% of the ivonescimab arm received further therapy vs 45.9% of controls. This would normally dilute an OS benefit, so the HR may be conservative. However, the reasons for the gap (clinical decline, toxicity, how the denominator was defined) need to be in the full report.
⚠️ Subsequent therapy differs from US practice. In the US, second-line care for BTC increasingly involves targeted agents for FGFR2, IDH1, HER2, and others. Whether a China-only OS result carries over depends partly on that downstream care. FDA has stressed that subsequent therapies must match US practice when OS is the endpoint
#BTC #Cholangiocarcinoma
https://t.co/vnJvi5WVcR
Relevant ongoing first-line trials:
• ARTEMIDE-Biliary02 (NCT07221253): phase 3 trial of rilvegostomig vs durvalumab, each with GemCis, as first-line treatment. Like HARMONi-GI1, it compares a novel agent against the durvalumab regimen.
• NCT06467357: phase 3 trial of T-DXd plus rilvegostomig vs standard of care (GemCis + durvalumab) in HER2-expressing advanced BTC.
• NCT06282575: phase 3 trial of zanidatamab added to standard of care (GemCis + pembrolizumab or durvalumab) in HER2-positive advanced BTC.
Schema and summary by Jeffrey Ryckman, MD: ARION / PRODIGE 67 summary card: durvalumab added to definitive CRT in esophageal cancer
Jeff Ryckman@jryckman3
Post text
50 Gy completion was 97%; FOLFOX completion 70%; median durvalumab delivery 9 courses. Grade 3–5 treatment-related adverse events were ~75% in both arms, with no safety signal reported.
In patients <65 years, 1-year OS was 90% vs 55.6% (p=0.07): exploratory and hypothesis-generating only.
The presenter's open questions included large prophylactic nodal irradiation fields, optimal RT–IO timing (sequential vs concurrent), and patient selection and biomarkers beyond CPS.
#ESMO26
ARION / PRODIGE 67
Durvalumab added to definitive CRT in esophageal cancer
Locally advanced esophageal cancer
77% SCC
WHO PS 0–1
n=112
Randomized phase II
RANDOMIZE
12-mo PFS* (abstract) | 12-mo OS (abstract)
IMRT 50 Gy/25 fx + FOLFOX ×6 (n=54): 48.9% | 67.9%
Same CRT + durvalumab 1500 mg q4w up to 12 mo (n=58): 48.6% | 75.1%
Adjusted HRs, durvalumab vs control (abstract): PFS 0.91 (95% CI 0.55–1.49); OS 0.99 (95% CI 0.59–1.68)
*Primary endpoint: centrally reviewed PFS; not significant.
Grade 3–5 TRAEs 75.4% vs 75.5% (presented; arms not labeled); RT completion 97%.
Modesto A, ESMO 2026 #2879RO (abstract + presented slides)
KOL infographic: trial long-term results infographic (Dr Najeed Aadil, KOL-made)
SANO 5Y : AS after nCRT showed no statistically significant OS difference vs immediate esophagectomy (50% vs 54%), but distant metastases were higher (46% vs 29%). Organ preservation is promising, but careful selection and rigorous surveillance are essential.
#ESMO2026 https://t.co/mDFE7lJShi
[ESMO logo] GOOD SCIENCE BETTER MEDICINE BEST PRACTICE
ESMO 2026
SANO TRIAL: LONG-TERM RESULTS
Active Surveillance vs Standard Surgery after nCRT in Esophageal Cancer
Phase III Multi-Center Randomized Non-Inferiority Trial | n = 309
[Illustration of oesophagus/stomach] Organ preservation? Surveillance vs surgery?
STUDY DESIGN
Active Surveillance (AS): Evaluating clinical response at regular intervals; surgery only on regrowth
VS
Standard Surgery: Oesophagectomy after neoadjuvant chemoradiotherapy (nCRT)
KEY RESULTS
5-YEAR OUTCOMES & EVIDENCE: 50% vs 54% Active Surveillance vs Standard Surgery
5-Year Overall Survival (OS): [stylized curve; y-axis labels 10, 10, 20, 10, 0; x-axis Months 0, 6, 12, 18, 24] Active Surveillance / Standard Surgery. HR 1.17 (95% CI: 0.77–1.77) No significant differences
Disease-Free Survival (DFS): HR 1.39 CI: (95% CI: 0.94–2.06) Statistically comparable DFS between between surveillance & immediate surgery
5-Year Distant Metastases: [donut] 46% vs Surgery. 46% vs 29% p < 0.01 (Significantly higher in Surveillance)
TAKE-HOME & CLINICAL CONSIDERATIONS: No significant difference in overall survival (5-year OS 50% vs 54%), supporting active surveillance for organ preservation. However, the significantly higher rate of distant metastases (46% vs 29%) and wide confidence intervals call for cautious patient selection and rigorous follow-up.
Reference: Lancet Oncol 2025; 26: 425–436 | ESMO 2026 Presentation / Abstract
Dr Najeed Aadil, Clinical Oncology & Radiation Medicine
Schema and summary by Jeffrey Ryckman, MD: subgroup forest card: pembrolizumab + dCRT vs placebo + dCRT, EFS and OS
@MDmanishshah @DaisukeKotani @KrishanJethwa @ArndtVogel No clear EFS or OS benefit from adding pembro to dCRT.
Subgroup differences remain exploratory.
RT dose was a stratification factor; neither dose subgroup shows a clear pembro benefit. https://t.co/twBw9qJ1Me
JRHG
ONCOLOGÍA MÉDICA
Dr. José Ramón Hernández García
ESMO 2026 · MADRID · GI · COLORRECTAL dMMR
NEOASIS • INMUNOTERAPIA NEOADYUVANTE EN COLORRECTAL dMMR
Respuestas patológicas altísimas con un esquema corto —aún en fase II.
ESCENARIO
CCR dMMR resecable, no metastásico (colon y recto).
DISEÑO
Fase 2, n=18. Botensilimab (anti-CTLA-4, Fc-enhanced) + balstilimab (anti-PD-1) neoadyuvante de curso corto.
RESULTADOS
MPR 83% (15/18) — primario cumplido.
pCR 72% (13/18).
SEGURIDAD
irAE grado 1–2 en 72%.
1 colitis grado 3.
2 casos de íleo.
PRESERVACIÓN DE ÓRGANO
1 caso: recto preservado tras respuesta endoscópica completa.
DOBLE BLOQUEO INMUNE
Botensilimab anti-CTLA-4 (Fc-enhanced)
Balstilimab anti-PD-1
Célula dendrítica
CTLA-4
Linfocito T activado
PD-1
Tumor colorrectal dMMR
Mayor activación de linfocitos T contra el tumor dMMR en el microambiente tumoral.
RESULTADOS PATOLÓGICOS
MPR 83% (15/18)
pCR 72% (13/18)
Respuesta patológica mayor (MPR)
Respuesta patológica completa (pCR)
Respuestas patológicas excepcionales PERO cohorte muy pequeña (n=18), fase II · toxicidad inmune del anti-CTLA-4 no trivial · consolida el paradigma de IO neoadyuvante en dMMR y la preservación de órgano.
1. Clinical Fellowship in Gastrointestinal Oncology · Netherlands Cancer Institute – Antoni van Leeuwenhoek Hospital (NCI-Amsterdam)
2. Dr. José Ramón Hernández García | Oncólogo Médico e Internista | Profesor Titular Posgrado UNAM-HGM | Doble Certificación CMO | Cédula Especialidad: 12776288
3. Consultorios OIS: 55 5393 1227 · 55 5833 7407 | WhatsApp OIS: +52 55 6881 2207
4. NCCN Guidelines® / ESMO Clinical Practice Guidelines · Fuente: NEOASIS (837P), ESMO 2026
KOL infographic: MedJ ESMO 2026 highlights card: sonesitatug vedotin (Sone-Ve) in later-line
Sone-Ve doubled median OS in 3L+ CLDN18.2-positive advanced GEC, although one dual primary endpoint was missed.
At the European Society for Medical Oncology @myESMO Congress 2026, principal investigator Prof. Rui-Hua Xu of Sun Yat-sen University Cancer Center @sysu_1924 presented results from the phase 3 CLARITY-Gastric01 trial (LBA7).
▪ Selected-dose ITT analysis: 532 patients
▪ 3L+ OS: 10.0 vs 5.0 months; HR 0.47
▪ 2L+ ITT OS: 10.6 vs 6.4 months; HR 0.58
▪ ITT BICR-PFS: 4.2 vs 3.8 months; P=0.053
▪ Grade ≥3 TRAEs: 36.4% vs 44.8%
The OS signal spanned high and lower CLDN18.2 expression, but the negative PFS endpoint is an important qualifier. Results remain conference-reported.
🔗 Read the full article via the link in the comments below.
#MedJ #ESMO26 #GastricCancer #GastroesophagealCancer #CLDN182 #ADC #ClinicalTrials
MEDJ | ESMO 2026 HIGHLIGHTS
PROF. RUIHUA XU
Sone-Ve Extends Survival in Later-Line CLDN18.2-Positive Gastroesophageal Cancer
Key Points:
1. The selected-dose ITT analysis compared Sone-Ve with investigator's choice in 532 patients.
2. Principal investigator Rui-Hua Xu of Sun Yat-sen University Cancer Center presented LBA7.
3. In 3L+, median OS was 10.0 versus 5.0 months (HR 0.47).
4. ITT BICR-PFS was 4.2 versus 3.8 months and missed significance (P=0.053).
5. Grade ≥3 TRAEs were lower with Sone-Ve, while gastrointestinal adverse events were more frequent.
MedJ
ESMO
KOL infographic: BioPharmCatalyst ESMO 2026 Day 3 table of company press
#ESMO26 Day 3 (Sunday): 15 press releases, 13 tickers, $2.56T combined market cap.
None of it is priced yet. Friday's close is the last print.
Full table below. Save it for Monday's open. https://t.co/0jpgiekcUd
BioPharm CATALYST
ESMO 2026 · DAY 3
Sunday, October 25 · markets closed · Friday close shown · largest names first
15 ESMO press releases Day 3 · 13 tickers
5▲ 8▼ Friday session before the news
$2.56T Combined market cap 13 tickers
4 Survival headlines AZN ×2 · SMMT · REGN
1 Primary endpoint missed AMRN · OS was secondary
TICKER | FRI CLOSE | MKT CAP | FRI MOVE | FRI RANGE | KEY RESULT · PRESS RELEASE
SUNDAY OCT 25 · DAY 3 All releases landed with markets closed · Friday columns are the last close before the news · Monday open is the first reaction · largest names first
LLY | $1,273.46 | 1.14T | −2.54% −$33.23 | Sun · 3:31 AM ET · Olomorasib · KRAS G12C-mutant NSCLC | Durable first-line activity | New data on Lilly's investigational treatment olomorasib at ESMO 2026 show durable first-line activity in KRAS G12C-mutant non-small cell lung cancer
JNJ | $263.81 | 635.07B | −1.42% −$3.80 | Sun · 3:31 AM ET · JNJ-6143 · first-in-class RIPTAC · advanced prostate | 75% tumor response rate | Johnson & Johnson reports 75% tumor response rate in advanced prostate cancer with JNJ-6143, a first-in-class RIPTAC™ molecule
JNJ | $263.81 | 635.07B | −1.42% −$3.80 | Sun · 9:46 AM ET · Rybrevant Faspro combination · 1L head and neck | 77% overall response rate | RYBREVANT FASPRO™ (amivantamab and hyaluronidase-lpuj) combination demonstrates 77% overall response rate in first-line treatment of patients with advanced head and neck cancer
RHHBY | $61.17 | 378.38B | +2.60% +$1.55 | Sun · 11:30 AM ET · Divarasib · previously treated KRAS G12C lung cancer | "Best-in-class" efficacy (company claim) | Roche's divarasib demonstrated best-in-class efficacy, advancing the standard of care in previously treated KRAS G12C-mutated lung cancer
AZN | $171.49 | 266.06B | −0.63% −$1.08 | Sun · 11:30 AM ET · Tagrisso + savolitinib · MET-driven EGFRm lung cancer | −45% progression or death · −32% death | TAGRISSO® (osimertinib) plus savolitinib reduced the risk of disease progression or death by 45% and the risk of death by 32% in MET-driven EGFR-mutated lung cancer after progression on TAGRISSO
AZN | $171.49 | 266.06B | −0.63% −$1.08 | Sun · 11:36 AM ET · Sonesitatug vedotin · CLDN18.2+ gastric/GEJ · CLARITY-Gastric01 | −42% risk of death | Sonesitatug vedotin reduced the risk of death by 42% in 2nd and later-line CLDN18.2-positive advanced gastric/GEJ cancers in CLARITY-Gastric01
REGN | $805.02 | 80.39B | −1.72% −$14.07 | Sun · 5:15 AM ET · Adjuvant Libtayo · high-risk cutaneous SCC · longer-term data | Growing overall survival benefit | Libtayo® (cemiplimab) Longer-Term Data Show Increasing and Clinically Meaningful Overall Survival Benefit with Adjuvant Treatment in High-Risk Cutaneous Squamous Cell Carcinoma (CSCC)
GMAB | $43.79 | 23.67B | +9.47% +$3.79 | Sun · 7:00 AM ET · Petosemtamab · Ph2 follow-up · note: Fri +9.47% followed a separate Rina-S release | Meaningful response rates in mCRC | Genmab Announces Updated Follow-Up Analyses from Phase 2 Study of Petosemtamab Demonstrate Meaningful Objective Response Rates in Patients with Metastatic Colorectal Cancer
BNTX | $88.12 | 22.13B | −1.73% −$1.55 | Sun · 3:31 AM ET · Pumitamig (with Bristol Myers Squibb) · NSCLC after IO + chemo | Encouraging global Ph2 data | BioNTech and Bristol Myers Squibb Report Encouraging Global Phase 2 Data for Pumitamig in Advanced NSCLC After Progression on Immunotherapy Plus Chemotherapy
SMMT | $15.47 | 12.37B | −0.51% −$0.08 | Sun · 11:53 AM ET · Ivonescimab · 1L biliary tract · HARMONi-GI1 (Akeso, China) | OS superiority vs durvalumab + chemo | Ivonescimab Plus Chemotherapy Demonstrates Overall Survival Superiority Compared to Durvalumab Plus Chemotherapy in First-Line Treatment of Patients with Advanced Biliary Tract Cancer in HARMONi-GI1 Study Conducted by Akeso in China
XNCR | $25.18 | 1.87B | −2.55% −$0.66 | Sun · 4:36 AM ET · XmAb819 ENPP3×CD3 · clear cell RCC | Ph1 dose selection · first-in-class | Xencor Presents Phase 1 Dose Selection Data for XmAb819, a Potential First-in-Class ENPP3 x CD3 Bispecific T-Cell Engager, in Development for Patients With Advanced Clear Cell Renal Cell Carcinoma and ENPP3+ Tumors
AVBP | $21.00 | 1.04B | +9.38% +$1.80 | Sun · 9:00 AM ET · CDH17 ADC ARR-217 · GI cancers | Initial Ph1 data | ArriVent Announces Initial Phase 1 Data for CDH17-targeted ADC ARR-217 in Patients with Gastrointestinal Cancers at ESMO Congress 2026
AGEN | $6.33 | 284.98M | −2.76% −$0.18 | Sun · 7:00 AM ET · BOT+BAL · locally advanced dMMR colon · Ph2 NEOASIS | 72% no cancer left at surgery | Agenus Reports 72% of Patients with Locally Advanced dMMR Colon Cancer Had No Cancer Remaining at Surgery Following Six Weeks of BOT+BAL in Phase 2 NEOASIS Study at ESMO 2026
AMRN | $11.79 | 249.04M | +1.64% +$0.19 | Sun · 8:12 AM ET · EMT2 Ph3 · colorectal liver mets · late-breaker (per release) | Primary PFS missed · OS −32% death (secondary) | Amarin Provides Update on University of Leeds Sponsored Phase 3 EPA for Metastasis Trial 2 (EMT2) Evaluating VAZKEPA®/VASCEPA® (icosapent ethyl) Capsules on Top of Standard of Care Treatment in Patients Undergoing Liver Resection for Colorectal Cancer Liver Metastases (CRCLM)
NBP | $1.37 | 158.92M | +3.01% +$0.04 | Sun · 7:00 AM ET · Givastomig | Mature Ph1b · registrational path | NovaBridge Biosciences Reports Mature Phase 1b Data at ESMO 2026 Positioning Givastomig for Registrational Development
Fri range: bar = Friday low to high · dark tick = prior close · dot = close. Key results come from press release headlines (company claims, not independent findings); Amarin's is from the release body, which states the primary endpoint was not met. Fri move is Friday's session, before any Day 3 news, so it is not a reaction. Includes the Oct 25 BioPharmCatalyst alerts that mention ESMO; Bristol Myers Squibb is co-named on the BioNTech release.
Every ESMO catalyst, live at biopharmcatalyst.com/article/esmo-2026
Close, move, range and market cap: Fri Oct 23, 2026, cross-checked across StockAnalysis and MarketWatch. Headlines and alert times: BioPharmCatalyst News alerts. For information only, not investment advice.
1) KOL infographic: OncoAlert 4Sight title card: 459O paclitaxel ± tovecimig in advanced BTC · 2) KOL infographic: OncoAlert 4Sight 459O Methods (tovecimig + paclitaxel BTC) · 3) KOL infographic: OncoAlert 4Sight 459O Results (tovecimig + paclitaxel BTC) · 4) KOL infographic: OncoAlert 4Sight 459O Conclusion
Updated HERIZON-GEA-01 Data in 1L HER2+ Unresc/LA/m GC/GEJA: IO + Chemo - ESMO 2026
Trials | HERIZON-GEA-01 P3 (N=920) Jazz Pharmaceuticals | | | KEYNOTE 811 P3 (N=738) MERCK |
Status | Active, Not Recruiting | | | Completed |
Treatments | Zani + Tis + CT vs Tras + CT | Zani + CT vs Tras + CT | Zani + Tis + CT vs Tras + CT | Tras + Pembro + CT vs Tras + CT | Tras + Pembro + CT vs Tras + CT
N | 914 | 914 | 404 | 698 | 698
Population | Overall | Overall | PD-L1 CPS ≥1 | Overall | PD-L1 CPS ≥1
OS HR | 0.81 (0.65-1.00) | 0.76 (0.62-0.93) | - | 0.81 | 0.79
mOS | 27 vs 19.6 | 22.9 vs 19.6 | 26.4 vs 20.8 | 20.0 vs 16.8 | 20.1 vs 15.7
PFS HR | 0.63 (0.51-0.78) | 0.65 (0.52-0.81) | - | 0.73 | 0.72
mPFS | 12.4 vs 8.1 | 12.4 vs 8.1 | 12.3 vs 8.2 | 10.0 vs 8.1 | 10.9 vs 7.3
Adapted from a post by Dr. Daniel Lin, originally published on X in 2026.
LARVOL
OncoAlert 4Sight Abstracts to be Presented at #ESMO26
CLARITY-Gastric 01 (CG-01): A Phase 3 Study of Sonesitatug Vedotin (Sone-Ve) in Second or Later-Line (2L+) Advanced or Metastatic Claudin 18.2 (CLDN18.2)-Positive Gastroesophageal Carcinoma (GEC)
@YJanjigianMD
🔬 Phase 3 (n=532): sonesitatug vedotin (CLDN18.2-targeted ADC) vs investigator’s choice in 2L+ CLDN18.2-positive (≥25%) advanced GEC. Dual primary endpoints: OS in 3L+ and PFS in ITT.
➡️ 3L+ OS: 10.0 vs 5.0 mo; HR 0.47 (0.36–0.62)
➡️ ITT OS: 10.6 vs 6.4 mo; HR 0.58 (0.47–0.73); PFS HR 0.77, not significant
➡️ Grade ≥3 TRAEs 36.4% vs 44.8%
✅ Significant OS benefit in 3L+ and ITT with a manageable safety profile, supporting Sone-Ve as a potential 2L+ treatment.
🎙️ Rui-Hua Xu
👥 Yelena Janjigian · Ming-Huang Chen
(4Sight Made from Abstracts publicly available at the ESMO website)
@CathyEngMD, @BenWestphalen, @graokane, @NiuSanford,
, @GillSharlene, @pashtoonkasi, @DrVilmaPBarcia, @Erman_Akkus, @GIMedOnc, @UOzkerim, @MarioBalsaMD, @p_ciracimd, @DraMartinezLago, @DaisukeKotani, @Aiims1742, @ARosen380, @realbowtiedoc, @KoheiShitara,
OncoAlert 4Sight Abstracts to be Presented at #ESMO26
Ivonescimab Plus Chemotherapy Versus Durvalumab Plus Chemotherapy as First-Line Treatment for Advanced Biliary Tract Cancer: A Randomized, Controlled, Double-Blinded, Phase 3 Trial (HARMONi-GI1)
🔬 Double-blind phase 3 (n=682, China): ivonescimab (PD-1/VEGF bispecific) + gemcitabine/cisplatin vs durvalumab + gemcitabine/cisplatin, first-line, in advanced BTC. Primary endpoint: OS.
➡️ Median OS 14.9 vs 12.1 mo; HR 0.75 (0.61–0.92); P=0.0031
➡️ Median PFS 8.4 vs 5.8 mo; HR 0.61 (0.51–0.72)
➡️ ORR 53.8% vs 32.5%
✅ Significant OS, PFS and ORR improvement with a manageable safety profile, supporting ivonescimab + chemotherapy as a potential new first-line standard of care.
🎙️ Jian Zhou
(4Sight Made from Abstracts publicly available at the ESMO website)
@CathyEngMD, @BenWestphalen, @graokane, @NiuSanford,
, @GillSharlene, @pashtoonkasi, @DrVilmaPBarcia, @Erman_Akkus, @GIMedOnc, @UOzkerim, @MarioBalsaMD, @p_ciracimd, @DraMartinezLago, @DaisukeKotani, @Aiims1742, @ARosen380, @realbowtiedoc, @KoheiShitara,
KOL infographic: ESMO Insights quote card: Ignacio Garrido-Laguna on RAS inhibitors in PDAC
ESMO - Eur. Oncology@myESMO
Post text
#ESMO26: RAS inhibitors improve survival in metastatic pancreatic ductal adenocarcinoma (#PDAC) irrespective of RAS mutational status, and combinations show benefits in the peri-operative setting, as discussed by @GarridoLagunaMD #InsightsbyESMO
➡️ https://t.co/8Lq9HdVv5P https://t.co/3LC6SFOLRX
MADRID 2026 ESMO congress
"RAS inhibitors are likely to dominate PDAC treatment over the next few years and may even replace chemotherapy in frail patients."
Ignacio Garrido-Laguna
Moffitt Cancer Center, Tampa, FL, USA
#InsightsbyESMO
KOL infographic: Larvol table: updated and other IO vs TACE trials in unresectable HCC
✨@myESMO Presidential Symposium Spotlight✨: Head-to-head vs durvalumab + chemo, ivonescimab + gemcitabine/cisplatin improved OS (HR, 0.75), PFS (HR, 0.61), and ORR in first-line advanced biliary tract cancer in the phase 3 HARMONi-GI1 trial.
Full #ESMO26 data: https://t.co/zQt9fALqMh
#medtwitter #oncology
🧬 What could a CLDN18.2-directed ADC offer patients with previously treated advanced gastric cancer?
At @esmoESMO #ESMO26, phase 3 G-HOPE-001 results highlight the potential of arcotatug tavatecan.
Read more: https://t.co/3Ry3sj6vNo #oncology https://t.co/WQNFGpA7WD
📈 Tovecimig plus paclitaxel improved ORR compared with paclitaxel alone in previously treated advanced biliary tract cancer in the phase 2/3 COMPANION-002 trial. @myESMO #ESMO2026 #oncology
Full story ➡️: https://t.co/pUPtfemAVe https://t.co/xdvpXVC6WS
Conclusion of ESMO2026. The flood gates of ADCs, BITEs and CART cells in sold tumors are about to open. I included a summary of major GI onc trials below.#ESMO2026 #GIOncology #Cancerresearch #communityOncology https://t.co/OKVDRepRaQ
What a remarkable day at #ESMO26 in Madrid!
INTerpath-001, VOLGA, DeLLphi-305 & CheckMate 8HW delivered major advances. COMPANION-002 sparked important debate on PFS and OS.
Celebrate progress. Challenge evidence. Keep patients first.
Thank you, @TargetedOnc! https://t.co/ncU0HEqeYA
ESMO 2026 | End-of-Day Reflections
What moved practice — and what still needs discussion
FROM TODAY'S ONCOLOGY COVERAGE IN MADRID
Practice-changing signals
INTerpath-001
Personalized mRNA vaccine + pembrolizumab improved 2-year RFS (82.2% vs 70.0%; HR 0.58) and DMFS (88.5% vs 80.2%; HR 0.62) in resected melanoma.
Important advance; key questions are scalability and how this fits with neoadjuvant immunotherapy.
VOLGA
Perioperative enfortumab vedotin + durvalumab improved 2-year EFS (64% vs 45%; HR 0.51) and OS (78% vs 69%; HR 0.58) in cisplatin-ineligible MIBC.
Practice-changing potential; how much treatment is enough, and who truly needs adjuvant therapy?
DeLLphi-305
Tarlatamab + durvalumab maintenance improved OS (21.1 vs 12.7 months; HR 0.42) and PFS (7.4 vs 1.9 months; HR 0.34) in ES-SCLC.
Remarkable signal; should tarlatamab move into induction, and what explains the steeper late OS decline?
Nuance still matters
COMPANION-002
Strong PFS/ORR signal in previously treated BTC (PFS HR 0.44; ORR 18% vs 5.3%), but OS interpretation remains complicated by high crossover.
CheckMate 8HW
Dual checkpoint blockade strengthened the case in MSI-H/dMMR mCRC, but the 1L nivo/ipi vs nivo comparison remains nuanced.
DASL-HiCaP
Strong MFS benefit (4-year 95% vs 88%; HR 0.42), but OS remains immature and patient selection will matter.
PRABITAS, BRAF/KRAS studies
Practical gains and interesting signals, but sequencing, resistance, and the value of chemotherapy remain open questions.
Big takeaway
Positive data should be celebrated.
Absolute benefit, toxicity, feasibility and sequencing still matter.
PFS can be clinically meaningful — especially in diseases with limited options — but context determines how we use it.
Unanswered questions are part of good oncology, not a weakness of the discussion.
KOL infographic: AI-made 6-panel summary: tovecimig + paclitaxel vs paclitaxel in BTC
PFS HR 0.44. ORR 18% vs 5.3%. OS HR 1.05.
Three numbers. One difficult question.
What should we conclude when a cancer treatment improves tumor control but not overall survival?
COMPANION-002 at #ESMO26.
Disclosure: Equity ownership in CMPX. https://t.co/R8IwZM0vUW
[6-panel AI-generated infographic]
1/6 ESMO 2026 MADRID | GI CANCERS
COMPANION-002
Tovecimig + Paclitaxel vs Paclitaxel in Previously Treated Biliary Tract Cancer (Non-Actionable)
High unmet need | Meaningful antitumor activity | Challenging OS interpretation
How should we interpret these results?
#ESMO26
2/6 COMPANION-002 | PROGRESSION-FREE SURVIVAL
Significant Improvement in PFS
Tovecimig + Paclitaxel Median 7.5 mo (95% CI, 4.2–10.3)
Paclitaxel Median 4.4 mo (95% CI, 4.0–8.3)
HR 0.44 (95% CI, 0.31–0.62) P < 0.0001
56% reduction in risk of progression or death
Patients at risk (n): Tovecimig + Paclitaxel 153, 97, 62, 36, 22, 12, 6; Paclitaxel 57, 28, 12, 6, 3, 2, 1 (months 0, 6, 12, 18, 24, 30, 36)
Clear and statistically significant improvement in PFS.
3/6 COMPANION-002 | OBJECTIVE RESPONSE RATE
Higher Response Rate with Tovecimig + Paclitaxel
Tovecimig + Paclitaxel (n = 153): 18.0% Objective Response Rate (CR + PR)
Paclitaxel (n = 57): 5.3% Objective Response Rate (CR + PR)
More than 3-fold higher response rate with tovecimig.
4/6 COMPANION-002 | OVERALL SURVIVAL
No Statistically Significant Difference in OS
HR 1.05 (95% CI, 0.78–1.42) P = 0.78
Tovecimig + Paclitaxel Median 12.8 mo
Paclitaxel Median 11.7 mo
OS was not significantly different, a finding complicated by high crossover from the control arm.
5/6 COMPANION-002 | CROSSOVER
High Crossover May Have Impacted OS
54% of control arm patients crossed to tovecimig
Key Questions: How much does crossover influence OS interpretation? Can statistical adjustments adequately account for crossover in this setting? What level of evidence is needed when PFS and ORR are clearly improved but OS is not demonstrated?
6/6 COMPANION-002 | KEY TAKEAWAYS
Important Questions for the Oncology Community
Demonstrated antitumor activity — Significant improvements in PFS and ORR.
Unclear OS benefit — High crossover complicates interpretation.
Patient-centered outcomes — Response durability, symptom improvement and quality of life are key considerations.
Regulatory and clinical implications — How should we balance unmet need, meaningful PFS/ORR benefit and the lack of demonstrated OS advantage?
#ESMO26
KOL infographic: BRAF V600E mCRC rechallenge strategies: TRIDENTE comparison infographic
BRAF V600E mCRC: Rechallenge, Continuation or Intensified Inhibition?
Key insights from three phase II studies at ESMO 2026
BACKGROUND
After progression on BRAF/EGFR therapy, resistant subclones and pathway reactivation limit subsequent options.
BEACON established encorafenib + cetuximab; BREAKWATER moved encorafenib + cetuximab + chemotherapy into first-line treatment.
Can continued inhibition, rechallenge or ctDNA-guided selection recover disease control?
BRICKET (787RO) ctDNA-guided BRAF-targeted retreatment
RATIONALE Resistant genomic alterations may decline after targeted therapy withdrawal, allowing renewed sensitivity to encorafenib + cetuximab in a molecularly selected population.
PHASE II DESIGN
• Single-arm, phase II trial
• Prior disease control on encorafenib + cetuximab (≥6 months)
• Progressed on EC, one intervening EC-free line
• ctDNA screening: BRAF V600E present and absence of KRAS/NRAS/MAP2K1 mutations or MET amplification
• n = 16 treated
• Primary endpoint: ORR
KEY RESULTS
• ORR: 0% (0/16)
• Stable disease: 6/16 (37.5%)
• Median PFS: 2.9 months (95% CI, 1.0 – NE)
• Median OS: 9.1 months (95% CI, 4.0 – 13.0)
• No new safety signals
INTERPRETATION ctDNA-guided encorafenib + cetuximab retreatment did not show evidence of activity in this selected population.
ECLYPse (788RO) Treatment beyond progression
RATIONALE Resistant tumors remain heterogeneous, and some clones may remain sensitive to continued BRAF/EGFR inhibition. Adding chemotherapy may enhance and prolong disease control.
PHASE II DESIGN
• Multicenter, single-arm phase II trial
• n = 25 patients
• Disease progressed on second-line encorafenib + cetuximab
• Continued encorafenib + cetuximab with addition of FOLFIRI
• Primary endpoint: 6-month PFS rate
KEY RESULTS
• 6-month PFS rate: 69.5% (95% CI, 51.7 – 93.6)
• Median PFS: 7.1 months (95% CI, 6.2 – NE)
• Median OS: not reached (6- and 12-month OS rates: 94.1% and 83.7%)
• No new safety signals
INTERPRETATION Continuing encorafenib + cetuximab beyond progression with added chemotherapy showed a promising signal of disease control in this poor-prognosis population.
TRIDENTE (789RO) BRAF/MEK/EGFR rechallenge
RATIONALE Additional MEK inhibition may restore MAPK pathway suppression and overcome acquired resistance after progression on encorafenib + cetuximab.
PHASE II DESIGN
• Multicenter, single-arm phase II trial
• n = 21 patients
• Prior partial response and subsequent progression on encorafenib + cetuximab–based regimen
• ≥4-month encorafenib-free interval
• Encorafenib + binimetinib + cetuximab
• Primary endpoint: ORR
KEY RESULTS
• ORR: 19.0% (4/21; all partial responses)
• Stable disease: 12/21 (52.4%)
• Median PFS: 2.8 months
• Median OS: 9.6 months
• In patients with baseline ctDNA: ORR 25.0% without genomic alterations vs 12.5% with alterations
• No unexpected safety signals
INTERPRETATION Rechallenge with encorafenib + binimetinib + cetuximab demonstrated modest activity and a manageable safety profile in selected patients who previously responded to encorafenib + cetuximab.
THREE DIFFERENT STRATEGIES — NOT HEAD-TO-HEAD.
Different selection criteria and endpoints prevent efficacy ranking. Future post-BREAKWATER sequencing needs randomized testing.
KOL infographic: final OS summary infographic (ESMO 2026 LBA32)
Important final OS data from CheckMate 8HW at #ESMO26 in MSI-H/dMMR mCRC!
Nivo/ipi vs nivo (all lines): HR 0.61, P=.0009.
Nivo/ipi vs chemotherapy (1L): HR 0.37, P<.0001.
With long follow-up, dual checkpoint blockade shows durable survival benefit. https://t.co/7SF6YpLk1j
CHECKMATE 8HW (LBA32)
Final Overall Survival in MSI-H/dMMR Metastatic Colorectal Cancer
ESMO 2026 • Madrid
Lower GI Colorectal Cancer
STUDY OVERVIEW
Phase III trial in MSI-H/dMMR metastatic colorectal cancer.
Comparison: Nivolumab + ipilimumab vs nivolumab across all treatment lines, and first-line comparisons vs chemotherapy and nivolumab.
Median follow-up 68.1 months (range 37.6–81.4)
HEADLINE RESULTS – OVERALL SURVIVAL
ALL TREATMENT LINES | FIRST LINE (1L) | FIRST LINE (1L)
NIVO + IPI vs NIVO | NIVO + IPI vs CHEMO | NIVO + IPI vs NIVO
OS HR 0.61 (95% CI 0.46–0.82) P = 0.0009 | OS HR 0.37 (95% CI 0.24–0.57) P < 0.0001 | OS HR 0.66 (95% CI 0.44–0.99) P = 0.0432
Significant, durable OS benefit | Strong first-line OS benefit | Nominally favorable, but not statistically significant per prespecified testing hierarchy
DURABILITY, DISEASE CONTROL AND SAFETY
Long-term follow-up showed sustained PFS and ORR benefit with NIVO + IPI vs NIVO and vs chemotherapy, with durable responses across treatment groups.
No new safety signals or additional treatment-related deaths.
Median (range) follow-up at final analysis: 68.1 (37.6–81.4) months.
KEY TAKEAWAYS AND CLINICAL INTERPRETATION
Dual checkpoint blockade improves long-term outcomes in MSI-H/dMMR mCRC.
The all-lines OS result strengthens the role of NIVO + IPI.
The 1L comparison versus nivolumab is encouraging but hierarchical statistical significance was not met.
Key question: Does every patient need CTLA-4 intensification, or can some achieve durable benefit with PD-1 monotherapy alone?
KOL infographic: Cancer Therapy Advisor key takeaways card: final OS analysis, MSI-H/dMMR CRC
CheckMate 8HW trial found nivolumab-ipilimumab prolongs OS compared to chemotherapy or nivolumab alone in patients with #ColorectalCancer
Presented by @sara_lonardi1 at the @myESMO Congress 2026 and published in @Annals_Oncology #ESMO26
More Data:
🔗 https://t.co/6bPX6PzKjE https://t.co/EvDfxlNoR8
ESMO Oct 23-27
1 The phase 3 CheckMate 8HW trial reported on a prespecified final OS analysis for treatment-naïve patients with MSI-H/dMMR CRC
2 The median OS was not reached with nivolumab-ipilimumab and was 50.1 months with chemotherapy
3 Nivolumab-ipilimumab also showed higher ORR (74% vs 27%); PFS (HR, 0.21; 95% CI, 0.14-0.32)
KEY TAKEAWAYS
Cancer Therapy Advisor
KOL infographic: MedJ infographic - ESMO 2026 Opens in Madrid: Key Highlights & Award Winners
MedJ@MedJ0401
Post text
🏆 #ESMO2026 opens in Madrid! @myESMO welcomes ~40,000 oncology professionals, with 4,414 abstracts and 296 sessions. Four awards honor Prof. Rebecca Fitzgerald @RFitzgerald_lab (early detection), Prof. Dan Landau @landau_lab (ctDNA/MRD), Prof. Pilar Garrido @Piuchagarrido (women in oncology) and Prof. Antoni Ribas (immunotherapy). #Oncology #MedJ
ESMO 2026 · CONGRESS HIGHLIGHTS
ESMO 2026 Opens in Madrid: Key Highlights & Award Winners
• ~40,000 oncology professionals, 4,414 abstracts and 296 sessions.
• ESMO President Fabrice André calls for unified standards and responsible AI integration.
• Rebecca Fitzgerald receives the ESMO Award for pioneering esophageal cancer early detection.
• Dan Landau wins for translational research; Pilar Garrido is honored for advancing women in oncology.
• Antoni Ribas receives the Lifetime Achievement Award for pioneering cancer immunotherapy.
KOL infographic: MedJ infographic: ESMO 2026 Research Update — Chinese
🧬 Chinese oncology research takes the spotlight at #ESMO2026!
Four GI cancer studies highlight advances in HER2-targeted ADCs for gastric cancer, immunotherapy for rectal and biliary tract cancers, and CAR-T therapy for liver cancer.
Key findings include 91.3% 3-year EFS in the UNION trial.
🔗 Read the full article via the link in the comments below.
#MedJ #Oncology #CancerResearch
ESMO 2026 · RESEARCH UPDATE
Chinese Studies in HER2 Gastric Cancer, Rectal, CAR-T, and BTC
• Four Chinese GI oncology studies were previewed ahead of ESMO2026.
• TQB2102 + bemotrizumab showed promising first-line activity in HER2+ gastric/GEJ cancer.
• The phase 3 UNION trial improved 3-year EFS to 91.3% in locally advanced rectal cancer.
• GPC3-targeted CAR-T C-CAR031 achieved an ORR of 44% in advanced hepatocellular carcinoma.
• Envafolimab + GEMOX extended OS to 10.9 vs 8.6 months in advanced biliary tract cancer.
KOL infographic: MedJ highlight card: sonesitatug vedotin in 3L+ CLDN18.2-positive gastroesophageal
Sonesitatug vedotin doubled median OS versus investigator’s choice in third-line or later CLDN18.2-positive advanced gastroesophageal cancer: 10.0 vs 5.0 months (HR 0.47).
Prof. Rui-Hua Xu of Sun Yat-sen University Cancer Center presented the 532-patient, randomized phase 3 CLARITY-Gastric01 trial at ESMO 2026.
ITT median OS: 10.6 vs 6.4 months (HR 0.58).
The ITT PFS co-primary endpoint was not met (P=0.053).
Grade ≥3 treatment-related adverse events: 36.4% vs 44.8%; gastrointestinal events were more common with the ADC.
The OS result is substantial, while the missed PFS endpoint and safety profile remain relevant to its interpretation.
🔗 Read the full article via the link in the comments below.
#MedJ #ESMO26 #GastricCancer #GastroesophagealCancer #CLDN182 #Oncology #ClinicalTrials
MEDJ | ESMO 2026 HIGHLIGHTS
PROF. RUIHUA XU
Sonesitatug Vedotin Doubles Third-Line or Later Median Survival in CLDN18.2-Positive Gastroesophageal Cancer
Key Points:
1. The randomized phase 3 trial enrolled 532 patients with CLDN18.2 expression in ≥25% of tumor cells.
2. In the ITT population, median OS was 10.6 versus 6.4 months (HR 0.58).
3. ITT BICR-assessed PFS was 4.2 versus 3.8 months; the co-primary endpoint was not met (P=0.053).
4. Grade ≥3 treatment-related adverse events occurred in 36.4% versus 44.8%; gastrointestinal events were more common with the ADC.
5. Principal investigator Rui-Hua Xu of Sun Yat-sen University Cancer Center presented LBA7 at ESMO 2026.
FAQ
About this page
What is on the ESMO 2026 GI Cancer slides page?
The 254 GI Cancer slide photos, abstract screenshots and data graphics plus 62 KOL-made infographics that oncologists, societies, media and companies posted on X from the ESMO 2026 embargo lift (October 22) through the congress in Madrid (October 23–27), compiled by KOL Pulse. Each card links to the original post and keeps the author's full text. It is one tumor-type page of the ESMO 2026 slide library: https://kolpulse.com/kol-pulse-esmo26-slides
Which GI Cancer trials are covered?
Trials with their own slide groups, by number of slide posts: HARMONi-GI1 (13), CLARITY-Gastric01 (12), AZUR-1 (12), SANO (10), INCB161734 (zecdarasib) + chemo (9), RASolute 302 (8), PRABITAS (7), G-HOPE-001 (7), IROCAS (7), ACTICCA-1 (7), MASTERPLAN (6), HERIZON-GEA-01 (6), AMPLIFY-7P (6), CheckMate 8HW (5), COMPANION-002 (5). Slides that compare several trials sit in a Cross-trial group, and slides not tied to a tracked trial come last. Physician posts come first in every group.
How do I filter by trial or KOL?
Use the trial chips in each section, the Trial menu (which also finds cross-trial slides that name that trial) and the KOL menu or the Built by avatars. Filters combine; counts only offer combinations that have results, and Clear filters or the Escape key resets. Every state has a shareable link, for example #tag=harmonigi1.
What are the OCR text and the source notes?
View OCR Text opens a verbatim transcription of the slide image; survival curves are captured as the printed numbers only, never read off the curve. Where it helps, a short context note gives the figures printed on the presented slide or abstract (for example, a different data cut or analysis). The author's caption is never edited.
Where are the other tumor types and the pre-congress archive?
Can I use this page with my own AI assistant (NotebookLM, Perplexity, Claude, ChatGPT)?
Yes. Paste the page URL, or a filtered link, into your assistant and ask questions against it. Example prompt: "From the slide transcriptions on this page, list each trial's primary endpoint result with the hazard ratio and data cut exactly as printed on the slide, and the physician who posted it."
Compiled and reviewed by the KOL Pulse research team, led by Brian Shields, Founder, KOL Pulse. Last updated October 29, 2026. Every card links to its original post; slide text is a verbatim transcription.
Free access — track oncology’s top KOLs in your specialty: profiles, pharma influence, ad-board patterns & 2025 Open Payments analysis.KOL Pulse Insider

















































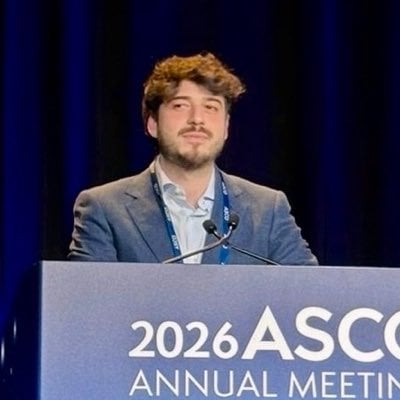

































































































































































 Santhosh Ambika @RenoHemonc

 Jeff Ryckman @jryckman3


 Dr Najeed Aadil @daakhsaab


 Felipe Couñago PhD @fcounago


 MV Chandrakanth @ChandrakanthMv

 Rohit Malde @roxboxfix


 Mustafa Özdoğan, MD @ozdogan_md


 Dr. José Ramón Hernández García @ramonphysician

 MedJ @MedJ0401

 BioPharmCatalyst @BPharmCatalyst


 OncoAlert @OncoAlert

 LARVOL @Larvol


 ESMO - Eur. Oncology @myESMO


 CancerTherapyAdvisor @CancerTherAdvsr


