GU Cancer results slides from ESMO 2026 (Madrid, October 23–27), posted since the October 22 embargo lift: 453 slide posts and 61 KOL infographics from 105 accounts, organized by clinical trial — led by VOLGA, DASL-HiCaP, KEYNOTE-B15 / EV-304, LITESPARK-011. Each trial links to its KOL Pulse trial page and conference discussion. Physician posts first; every slide carries a verbatim OCR transcription. Updated October 29, 2026. ← Back to the full ESMO 2026 coverage
This page holds the ESMO 2026 GU Cancer results slides, part of the ESMO 2026 slide library. Other tumor types have their own pages below; pre-congress previews are in the pre-congress archive →
1) Trial design schema: study design (Powles, ESMO 2026 LBA2) · 2) Kaplan-Meier survival data: EFS by BICR, D+EV vs control, ITT Kaplan-Meier · 3) Kaplan-Meier survival data: OS, D+EV vs control, ITT Kaplan-Meier (Powles, ESMO 2026 LBA2) · 4) Slide: AE summary, D+EV vs control, safety population (Powles, ESMO 2026 LBA2)
VOLGA explored short periods of EV (3 cycles) with duvalumab in muscle invasive bladder cancer #ESMO26 @NEJM. Results showed EVD was associated with better EFS + OS vs cystectomy alone (0.51 and 0.58 respectively). pCR 40-45% with ctDNA clearance rates of 60%. High rates of adjuvant IO therapy uptake and low rates of neuropathy suggest potential advantages of this approach which focuses the ADC in the neoadjuvant phase. It’s likely to be attractive for patients.
[Slide 1]
VOLGA: Study Design
Patients
• Adults aged ≥18 years
• MIBC (cT2-T4aN0/1M0 or cT1N1M0) by local assessment
• Ineligible for or refused cisplatin
• UC or UC with divergent differentiation or histological subtypes
• Evaluated and confirmed for cystectomy
R (1:1:1) N=695
Neoadjuvant
D+EV N=233 | Durvalumab Q3W × 3 cycles | Enfortumab vedotin Q3W × 3 cycles
D+T+EV N=233 | Durvalumab Q3W × 3 cycles | Tremelimumab Q3W × 2 cycles | Enfortumab vedotin Q3W × 3 cycles
Control N=229 | No treatment | Straight to RC
RC
Adjuvant
D+EV: Durvalumab Q4W × 9 cycles
D+T+EV: Durvalumab Q4W × 9 cycles; Tremelimumab Q4W × 1 cycle
Control: Observation/locally approved treatment
Endpoints
Dual primary – EFSa
• D+EV vs control
• D+T+EV vs control
Key secondary – OS
• D+EV vs control
• D+T+EV vs control
Other secondary
• pCR
• EORTC QLQ-C30
Exploratory
• ctDNA analysis
Safety
Stratification
• PD-L1 status (high vs low/negative)
• Clinical tumour stage (T2N0M0 vs T3-4aN0M0 vs T1-4aN1M0)
• Cisplatin status (ineligible vs refusal)
EFS was defined as time from randomisation to the first:
• Recurrence after RC
• Progression in patients who did not receive RC
• Failure to undergo RC in patients with residual disease
• Death due to any cause
Durvalumab dose was 1500 mg, tremelimumab dose was 75 mg, and EV dose was 1.25 mg/kg body weight. aEvaluated by BICR or central pathology review (if a biopsy was required for a suspected new lesion). ClinicalTrials.gov, NCT04960709. EudraCT number, 2020-005452-38. BICR, blinded independent central review; ctDNA, circulating tumour DNA; D, durvalumab; EFS, event-free survival; EORTC QLQ-C30, European Organisation for Research and Treatment of Cancer 30-item Core Quality of Life Questionnaire; EV, enfortumab vedotin; MIBC, muscle-invasive bladder cancer; OS, overall survival; pCR, pathological complete response; PD-L1, programmed cell death ligand-1; Q3W, every 3 weeks; Q4W, every 4 weeks; R, randomisation; RC, radical cystectomy; T, tremelimumab; UC, urothelial carcinoma.
[Slide 2]
VOLGA: EFS by BICR for Durvalumab+EV vs Control – ITT
Durvalumab+EV demonstrated a statistically significant improvement in EFS vs control
| D+EV N=233 | Control N=229
Events, n (%) | 84 (36) | 123 (54)
Median EFS, months (95% CI) | NR (33.2–NC) | 12.1 (7.6–27.0)
HR (95% CI) | 0.51 (0.38–0.67)
Stratified log-rank P valuea | <0.0001
Curve labels: 12 mo: 73% (D+EV), 50% (Control); 24 mo: 64% (D+EV), 45% (Control)
Durvalumab+EV arm; Control arm
Median follow-upb: 23 months
Y axis: Probability of EFS; X axis: Time from randomisation (months) 0–45
No. of patients at risk
D+EV | 233 | 197 | 180 | 170 | 158 | 136 | 111 | 93 | 80 | 51 | 38 | 21 | 11 | 4 | 1 | 0
Control | 229 | 157 | 131 | 106 | 98 | 80 | 66 | 59 | 43 | 35 | 22 | 16 | 8 | 5 | 0 | 0
EFS is the time from randomisation to the first: 1) recurrence after RC, 2) progression in patients who did not receive RC, 3) failure to undergo RC in patients with residual disease, or 4) death due to any cause.
aThe threshold to declare statistical significance was based on a based on a Lan-DeMets alpha spending function with O'Brien-Fleming boundary – with the observed number of events, the boundary for declaring statistical significance was 0.0218 for a 2.7% overall 2-sided alpha. bIn censored patients across all study arms. Data cutoff 02 March 2026. BICR, blinded independent central review; CI, confidence interval; D, durvalumab; EFS, event-free survival; EV, enfortumab vedotin; HR, hazard ratio; ITT, intention-to-treat population; NC, not calculated; NR, not reached; RC, radical cystectomy.
Survival table
Endpoint: EFS by BICR (ITT)
Arm | N | Median | Median CI
D+EV | 233 | NR | 33.2–NC
Control | 229 | 12.1 | 7.6–27.0
HR: 0.51
HR CI: 0.38–0.67
P: <0.0001
Landmark rates:
12 mo: D+EV 73% | Control 50%
24 mo: D+EV 64% | Control 45%
[Slide 3]
VOLGA: OS for Durvalumab+EV vs Control – ITT
Durvalumab+EV demonstrated a statistically significant improvement in OS vs control
| D+EV N=233 | Control N=229
Deaths, n (%) | 49 (21) | 74 (32)
Median OS, months (95% CI) | NR (NC–NC) | NR (37.7–NC)
HR (95% CI) | 0.58 (0.40–0.83)
Stratified log-rank P valuea | 0.0027
Curve labels: 12 mo: 87% (D+EV), 81% (Control); 24 mo: 78% (D+EV), 69% (Control)
Durvalumab+EV arm; Control arm
Median follow-upb: 26 months
Y axis: Probability of OS; X axis: Time from randomisation (months) 0–48
No. of patients at risk
D+EV | 233 | 224 | 212 | 207 | 198 | 185 | 160 | 128 | 110 | 82 | 66 | 45 | 27 | 15 | 4 | 0 | 0
Control | 229 | 208 | 190 | 185 | 176 | 157 | 128 | 110 | 96 | 72 | 53 | 34 | 22 | 13 | 5 | 2 | 0
OS is the time from randomisation until death due to any cause, regardless of whether the patient withdraws from randomised therapy or receives another anticancer therapy. aThe threshold to declare statistical significance was based on a Gamma family (-3) spending function – with the observed number of events, the boundary for declaring statistical significance was 0.0104 for a 5% overall 2-sided alpha. bIn censored patients across all study arms. Data cutoff 02 March 2026. CI, confidence interval; D, durvalumab; EV, enfortumab vedotin; HR, hazard ratio; ITT, intention-to-treat population; NC, not calculated; NR, not reached; OS, overall survival.
Survival table
Endpoint: OS (ITT)
Arm | N | Median | Median CI
D+EV | 233 | NR | NC–NC
Control | 229 | NR | 37.7–NC
HR: 0.58
HR CI: 0.40–0.83
P: 0.0027
Landmark rates:
12 mo: D+EV 87% | Control 81%
24 mo: D+EV 78% | Control 69%
[Slide 4]
VOLGA: AE Summary – Safety Population (Overall Trial Period)
Events, n (%) | Durvalumab+EV n=228 | Control n=229
AEs of any cause | 227 (>99) | 170 (74)
Maximum grade 3 or 4 AEs | 145 (64) | 101 (44)
Serious AEs | 143 (63) | 101 (44)
Leading to death | 17 (7) | 14 (6)
Leading to discontinuation of any study treatment | 48 (21) | NA
Leading to discontinuation of durvalumab | 37 (16) | NA
Leading to discontinuation of tremelimumab | NA | NA
Leading to discontinuation of enfortumab vedotin | 26 (11) | NA
Leading to cancellation of surgery | 2 (0.9) | 0
Leading to delay in surgerya | 8 (4) | 1 (0.4)
AEs possibly related to any treatment | 207 (91) | NA
Maximum grade 3 or 4 AEs | 69 (30) | NA
Serious AEs | 45 (20) | NA
Leading to death | 1 (0.4) | NA
Any-grade immune-mediated AEs | 75 (33) | 8 (3)
Maximum grade 3 or 4 | 24 (11) | 2 (0.9)
Leading to death | 0 | 0
The safety population includes all patients who received study treatment (D+EV arm) or who were randomised (control arm). Investigator-assessed causality. aRecommended timeframe for surgery was within 56 days after the last dose of neoadjuvant treatment (D+EV arm), and within 12 weeks of diagnosis (control arm). Data cutoff 02 March 2026. AE, adverse event; D, durvalumab; EV, enfortumab vedotin; NA, not applicable.
ESMO 2026 - presidential LBA | VOLGA Phase III –
Perioperative Durvalumab + Enfortumab Vedotin (EV) in cisplatin-ineligible/refusing patients:
📊 EV + Durva vs Control
• 2-year EFS: 64% vs 45% (HR 0.51; p<0.0001)
• 2-year OS: 78% vs 69% (HR 0.58; p=0.0027)
• pCR: 45% vs 10%
Adding tremelimumab improved EFS (HR 0.61) but no significant OS benefit yet, with higher grade 3/4 toxicity (42% vs 30%).
🔥can this stop the need of post op EV ? Probably yes . New SOC 🙂👍
Looking forward the full datasets @OncBrothers
@OncoAlert @myESMO
#ESMO26 #VOLGA #BladderCancer
[Slide 1]
Proffered Paper session
LBA2 - Perioperative durvalumab with or without tremelimumab plus neoadjuvant enfortumab vedotin in muscle-invasive bladder cancer: Results from the phase 3 VOLGA trial
Speakers Thomas B. Powles (London, United Kingdom)
Lecture Time 16:54 - 17:06
[Abstract button]
Background
The standard of care continues to evolve for patients (pts) with muscle-invasive bladder cancer (MIBC). We evaluated if neoadjuvant durvalumab (D) ± tremelimumab (T) plus enfortumab vedotin (EV) followed by radical cystectomy (RC) and adjuvant D±T would be an effective option.
[Slide 2]
Results
Overall, 233, 233, and 229 pts were randomised to the D+EV, D+T+EV, and control arms, respectively. RC was completed in 85% (D+EV), 79% (D+T+EV), and 78% (control) of pts; and 55% (D+EV) and 42% (D+T+EV) completed adjuvant tx. Median EFS follow-up was 22.9 mo. D+EV showed significant improvements in EFS (HR 0.51 [95% CI, 0.38-0.67], P<0.0001; 24-mo rate 64% vs 45%) and OS (HR 0.58 [95% CI, 0.40-0.83], P=0.0027; 24-mo rate 78% vs 69%) vs control. D+T+EV also showed a significant improvement in EFS vs control (HR 0.61 [95% CI, 0.47-0.80], P=0.0004; 24-mo rate 60% vs 45%) but did not meet significance for OS; follow-up is ongoing. Pathological complete response per local review was observed in 45% (95% CI, 38.6-51.7) of pts in the D+EV arm and 10% (95% CI, 6.1-14.2) in the control arm. In the D+EV and D+T+EV arms, max. Grade 3/4 tx-related adverse events occurred in 30% and 42% of pts, respectively. ctDNA results will also be presented.
Conclusions
Dual primary endpoints of EFS were met. Perioperative D plus 3 cycles of neoadjuvant EV also demonstrated a significant improvement in OS vs control. Safety profiles were consistent with those of the individual agents.
[Slide 3]
Methods
VOLGA (NCT04960709), a phase 3, randomised, open-label trial, enrolled pts with MIBC (cT2-T4aN0/1M0 or cT1N1M0) ineligible for or who refused treatment (tx) with cisplatin and were planned for RC. Pts were randomised 1:1:1 to D+EV, D+T+EV, or control. D+EV and D+T+EV arms: perioperative D±T (neoadjuvant: 3 cycles of D, 2 cycles of T; adjuvant: 9 cycles of D, 1 cycle of T) and 3 cycles of neoadjuvant EV; RC was completed after neoadjuvant tx. Control arm: RC and observation or locally approved adjuvant tx. Dual primary endpoints were event-free survival (EFS): D+EV vs control and D+T+EV vs control. Overall survival (OS) was the key secondary endpoint. Safety was also assessed. Here we present results from a pre-planned interim analysis (data cutoff: 02 Mar 2026).
Biomarker data: pre-RC ctDNA dynamics and EFS by ctDNA status, durvalumab+EV arm (ESMO 2026)
ctDNA analysis is an increasingly utilised prognostic tool in muscle invasive bladder cancer. In VOLGA 78% of the muscle invasive bladder cancer patients were ctDNA positive at baseline which was prognostic. Also, the combination of perioperative durvalumab and neoadjuvant EV cleared ctDNA in 60% of patients (using the Natera Genome assay which has increased sensitivity). Clearance was associated with much better outcomes. #ESMO26
1) Slide: Durvalumab, Tremelimumab, and Enfortumab Vedotin in Muscle-Invasive Bladder Cancer · 2) Kaplan-Meier survival data: NEJM Figure 1: EFS durvalumab-EV vs control ITT · 3) Kaplan-Meier survival data: NEJM Figure 2: EFS durvalumab-tremelimumab-EV vs control · 4) Kaplan-Meier survival data: NEJM Figure 3: OS durvalumab-EV vs control ITT
🚨 VOLGA: chemo-free durvalumab + enfortumab vedotin beat surgery alone in muscle-invasive #bladdercancer 🚨
@NEJM today
🧵1/2
👥 n=695, cisplatin-ineligible or declined MIBC
📊 Phase 3 RCT, 1:1:1
💊 Perioperative durva + EV vs durva + tremelimumab + EV vs radical cystectomy alone
⏱️ Estimates at 24 mo
✅ Durva + EV EFS 63.5% vs 45.1%, HR 0.51 (0.38-0.67), p<0.001
✅ OS 78.4% vs 69.4%, HR 0.58 (0.40-0.83), p=0.003
✅ Durva + treme + EV EFS HR 0.61 (0.47-0.80), but grade ≥3 AEs 79.5% vs 71.1%
⚠️ The 2 durvalumab arms were not compared head-to-head, so the CTLA-4 add is not clearly worth the added toxicity
🎯 Another cisplatin-free ADC + IO backbone for cisplatin-ineligible MIBC
1) Slide: OS subgroup forest plot durvalumab+EV vs control (Powles, ESMO 2026) · 2) Slide: AEs associated with durvalumab or EV, D+EV arm (Powles, ESMO 2026)
Kudos @tompowles1 on a fantastic #VOLGA presidential @ #ESMO26 👏
Less is More!
• Cis-inelig MIBC, 25% were cis refusers • D+EV x3 → RC → adj D x9 (NO adj EV) • EFS HR 0.51 • OS HR 0.58 • pCR 45 vs 10% • G3-4 TRAE 30%, • neuropathy only 18% • imAEs 33% (G3-4 11%) • GHS/QoL maintained post-RC
• Treme ↑tox (G3-4 42%, 5 deaths), NO OS gain.
My take: it's not just about chasing bigger numbers. Tox matters too, especially when OS is achieved. Need to discuss the pros and cons with patients.
Less PN and skin tox, and fewer G3+ immune AEs than more cycles and that's a win for patients ! 🙌
@Uromigos @OncoAlert @brian_rini @LosUromigos @drenriquegrande
Slide: pCR durvalumab+EV vs control by local and central review (Powles, ESMO 2026 LBA2)
🆙#ESMO26 Presidential Symposium I
🔥VOLGA: Perioperative Durvalumab With or Without Tremelimumab Plus Neoadjuvant Enfortumab Vedotin in Muscle-Invasive Bladder Cancer: Results From the Phase 3 Trial
🎙️ @tompowles1
🔢LBA2
🎯Durva+EV: Significantly Improved EFS (HR 0.51, 24-Mo 64% vs 45%) and OS (HR 0.58, p=0.0027) vs Control (n=233 vs 229)
🎯pCR 45% vs 10%; Durva+Treme+EV: EFS HR 0.61, OS Not Significant
☑️NCT04960709
🔗 https://t.co/t988kyrR7h
@OncoAlert @Larvol @myESMO
VOLGA: pCR for Durvalumab+EV vs Control – ITT
Durvalumab+EV showed improvements in pCR rate vs control
Local pathology review
Risk ratio, 4.7 (95% CI, 3.1–7.3)
Durvalumab+EV (N=233) | 45% (95% CI, 38.6–51.7) | (105/233)
Control (N=229) | 10% (95% CI, 6.1–14.2) | (22/229)
Central independent review
Risk ratio, 4.8 (95% CI, 3.1–7.9)
Durvalumab+EV (N=233) | 40% (95% CI, 34.0–47.0) | (94/233)
Control (N=229) | 8% (95% CI, 5.1–12.7) | (19/229)
Analysis performed using log-binomial models adjusted using stratification factors: PD-L1 status, tumour stage and cisplatin status per interactive-response technology. Patients who did not undergo surgery or those with a missing or non-evaluable assessment were considered non-responders. Data cutoff 02 March 2026. CI, confidence interval; EV, enfortumab vedotin; ITT, intention-to-treat population; pCR, pathological complete response; PD-L1, programmed cell death ligand-1.
Slide: NEJM article header: Durvalumab, Tremelimumab, and Enfortumab Vedotin in Muscle-Invasive Bladder
⚡️ Phase 3 VOLGA trial in cisplatin-ineligible or -declining MIBC: perioperative durvalumab + neoadjuvant EV (3 cycles) vs standard of care.
EFS HR 0.51 (p<0.0001). OS HR 0.58 (p=0.0027). pCR 45% vs 10%.
Simultaneously published in @NEJM. #ESMO26
@tompowles1 @myESMO
https://t.co/4U95QfrLkt
#BladderCancer #MIBC #GUOncology
MADRID 2026 ESMO congress | LBA2
Perioperative Durvalumab With or Without Tremelimumab Plus Neoadjuvant Enfortumab Vedotin in Muscle-Invasive Bladder Cancer: Results From the Phase 3 VOLGA Trial
Thomas Powles,1 Enrique Grande,2 Giuseppe Simone,3 Alfonso Gómez de Liaño,4 Pedro Isaacsson Velho,5 Eiji Kikuchi,6 Toan Quang Vu,7 Lazar Popovic,8 Timuçin Çil,9 Gwenaelle Gravis,10 Robert Radkowski,11 Luis Raúl Novelo Hernández,12 Yoon Ji Choi,13 Hiroshi Kitamura,14 Jonathan E. Rosenberg,15 Helen K. Angell,16 Jon Armstrong,16 Swati Sharma,17 Suliman Boulos,16 Alexandra Drakaki18
1Barts Cancer Institute, Queen Mary University of London, Barts Health NHS Trust Biomedical Research Centre, London, UK; 2Servicio de Oncología Médica, MD Anderson Cancer Center, Madrid, Spain; 3Uro-Oncology Program, IRCCS Regina Elena National Cancer Institute, Rome, Italy; 4Medical Oncology Department, Complejo Hospitalario Universitario Insular-Materno Infantil de Gran Canaria, Universidad de Las Palmas de Gran Canaria, Las Palmas, Spain; 5Hospital Moinhos de Vento, Porto Alegre, Brazil; 6St. Marianna University School of Medicine, Kawasaki, Japan; 7National Cancer Hospital, Hanoi, Vietnam; 8Oncology Institute of Vojvodina, Faculty of Medicine, University of Novi Sad, Novi Sad, Serbia; 9University of Health Sciences, Adana City Training and Research Hospital, Adana, Turkey; 10Institut Paoli-Calmettes, Aix-Marseille University, INSERM, CNRS, CRCM, Marseille, France; 11Augusta-Kranken-Anstalt gGmbH - Klinik fuer Haematologie, Onkologie & Palliativmedizin, Bochum, Germany; 12Luis Raul Novelo Hernandez, Consultorio de Medicina Especializada del Sector Privado, Colima, Mexico; 13Korea University Anam Hospital, Korea University College of Medicine, Seoul, Republic of Korea; 14Faculty of Medicine, University of Toyama, Toyama, Japan; 15Genitourinary Oncology Service, Memorial Sloan Kettering Cancer Center, New York, NY, USA; 16AstraZeneca, Cambridge, UK; 17AstraZeneca, Cambridge, MA, USA; 18Division of Hematology/Oncology, UCLA Health, Los Angeles, CA, USA
Slide: baseline patient characteristics – ITT (Powles, ESMO 2026 LBA2)
VOLGA: OS benefit without adjuvant EV.
Do we really need EV after surgery? An important question for future trials.
Proud to have contributed to this study.
@myESMO @OncoAlert @OpenMedicineHQ #ESMO26 @tompowles1 @Uromigos @urologysummit https://t.co/pahgmrYy49
Kaplan-Meier survival data: Tarlatamab vs chemotherapy: overall survival, PFS and duration
ESMO26: New vaccines. Better survival. Negative trials.
My takeaway: progress isn’t more treatment. It’s the right treatment, for the right patient, within reach.
@myESMO @OncoAlert @OpenMedicineHQ #ESMO26 https://t.co/YEfGPhKvEl
Slide: presentation in the Presidential hall: EFS and OS slides on screens
Just left IFEMA, incredibly excited abt all the amazing work #ESMO2026. Technological advances that I was sceptical would work in pts are now producing real clinical benefit! Grateful to be back at the presidential in Madrid w/ @tompowles1! @Uromigos @LAUrology_NL @NKI_nl https://t.co/0Hv37IZgJo
VOLGA: EFS by BICR for Durvalumab+EV vs Control – ITT
VOLGA: OS for Durvalumab+EV vs Control – ITT
Key differences with EVP:
• No adjuvant EV in VOLGA
• Anti-PD-L1 vs anti-PD1
Potential differences with EVP:
• Protocol therapy adherence
• Event definition
• Study population
1) Trial design schema: (MIBC, cisplatin-ineligible/refused): study · 2) Slide: discussion: cystectomy adherence, event definition and baseline · 3) Trial design schema: discussion: 'Anti-CTLA4 in UC: wrong target
*VOLGA study* cis-ineligible/refused @tompowles1 @MichvdHeijden @myESMO #ESMO26 @oncodaily @OncoAlert
🔴 EV+Durva x 3 w ⬆️ pCR, EFS, OS
🟠 ≈20% ❌ cystectomy
🟢 ct-DNA clearance associated w EFS
🔵 ⬆️ toxicity in triplet EV+Durva/T, will reduced dose impact oucomes?
🟣 Less migh be enough, more too much?
[Slide 1]
[Composite of 4 slides]
VOLGA: Study Design
Patients
• Adults aged ≥18 years
• MIBC (cT2-T4aN0/1M0 or cT1N1M0) by local assessment
• Ineligible for or refused cisplatin
• UC or UC with divergent differentiation or histological subtypes
• Evaluated and confirmed for cystectomy
R (1:1:1) N=695
Neoadjuvant | Adjuvant
D+EV N=233: Durvalumab Q3W × 3 cycles; Enfortumab vedotin Q3W × 3 cycles | RC | Durvalumab Q4W × 9 cycles
D+T+EV N=233: Durvalumab Q3W × 3 cycles; Tremelimumab Q3W × 2 cycles; Enfortumab vedotin Q3W × 3 cycles | RC | Durvalumab Q4W × 9 cycles; Tremelimumab Q4W × 1 cycle
Control N=229: No treatment; Straight to RC | Observation/locally approved treatment
Endpoints
Dual primary – EFS
• D+EV vs control
• D+T+EV vs control
Key secondary – OS
• D+EV vs control
• D+T+EV vs control
Other secondary
• pCR
• EORTC QLQ-C30
Exploratory
• ctDNA analysis
Safety
Stratification
• PD-L1 status (high vs low/negative)
• Clinical tumour stage (T2N0M0 vs T3-4aN0M0 vs T1-4aN1M0)
• Cisplatin status (ineligible vs refusal)
EFS was defined as time from randomisation to the first:
• Recurrence after RC
• Progression in patients who did not receive RC
• Failure to undergo RC in patients with residual disease
• Death due to any cause
VOLGA: pCR for Durvalumab+EV vs Control – ITT
Durvalumab+EV showed improvements in pCR rate vs control
Local pathology review: Risk ratio, 4.7 (95% CI, 3.1–7.3)
Durvalumab+EV (N=233): 45% (95% CI, 38.6–51.7) (105/233)
Control (N=229): 10% (95% CI, 6.1–14.2) (22/229)
Central independent review: Risk ratio, 4.8 (95% CI, 3.1–7.9)
Durvalumab+EV (N=233): 40% (95% CI, 34.0–47.0) (94/233)
Control (N=229): 8% (95% CI, 5.1–12.7) (19/229)
Data cutoff 02 March 2026
VOLGA: EFS by BICR for Durvalumab+EV vs Control – ITT
Durvalumab+EV demonstrated a statistically significant improvement in EFS vs control
| D+EV N=233 | Control N=229
Events, n (%) | 84 (36) | 123 (54)
Median EFS, months (95% CI) | NR (33.2–NC) | 12.1 (7.6–27.0)
HR (95% CI) | 0.51 (0.38–0.67)
Stratified log-rank P value | <0.0001
Landmarks shown: D+EV 73% (12 mo), 64% (24 mo); Control 50% (12 mo), 45% (24 mo)
Median follow-up: 23 months
No. of patients at risk
D+EV 233 197 180 170 158 136 111 93 80 51 [illegible] 21 11 4 1 0
Control 229 157 131 106 98 80 66 59 43 35 22 16 8 5 0 0
VOLGA: OS for Durvalumab+EV vs Control – ITT
Durvalumab+EV demonstrated a statistically significant improvement in OS vs control
| D+EV N=233 | Control N=229
Deaths, n (%) | 49 (21) | 74 (32)
Median OS, months (95% CI) | NR (NC–NC) | NR (37.7–NC)
HR (95% CI) | 0.58 (0.40–0.83)
Stratified log-rank P value | 0.0027
Landmarks shown: D+EV 87% (12 mo), 78% (24 mo); Control 81% (12 mo), 69% (24 mo)
Median follow-up: 26 months
No. of patients at risk: [illegible at this resolution]
Survival table
Endpoint: EFS by BICR (ITT), durvalumab+EV vs control
Arm | N | Median | Median CI
Durvalumab+EV | 233 | NR | 33.2–NC
Control | 229 | 12.1 mo | 7.6–27.0
HR: 0.51
HR CI: 0.38–0.67
P: <0.0001 (stratified log-rank)
Landmark rates:
12 mo: Durvalumab+EV 73% | Control 50%
24 mo: Durvalumab+EV 64% | Control 45%
[Slide 2]
Cystectomy adherence, event definition and baseline characteristics
Neoadjuvant
233 assigned to durvalumab+EV (ITT)
5 did not receive treatment
228 received treatment (safety population)
192 completed neoadjuvant treatment
36 discontinued neoadjuvant treatment
229 assigned to control (ITT and safety population)
Surgery
198 underwent cystectomy
198 underwent RC
35 did not undergo cystectomy(a)
87%
180 underwent cystectomy
179 underwent RC
1 had partial cystectomy
49 did not undergo cystectomy(a)
79%
Adjuvant
157 received treatment(b)
128 completed adjuvant treatment
28 discontinued adjuvant treatment
[Inset EFS KM curve: D+EV N=233 vs Control N=229; Events, n (%) 84 (36) | 123 (54); Median EFS, months (95% CI) NR (33.2–NC) | 12.1 (7.6–27.0); HR (95% CI) 0.51 (0.38–0.67); Stratified log-rank P value <0.0001; 73%/64% vs 50%/45%; Median follow-up: 23 months; early-curve region circled]
The most common reason for not undergoing cystectomy was patient decision (D+EV, n=15; control, n=30)
Event if: "Failure to undergo RC in patients with residual disease"
KN905/EV303:
cystectomy in 88% (EVP) and 90% (control)
Michiel S. van der Heijden
[Slide 4]
Anti-CTLA4 in UC: wrong target or wrong design?
[EFS KM inset] | D+T+EV N=233 | Control N=229
Events, n (%) | 92 (39) | 123 (54)
Median EFS, months (95% CI) | NR (27.9–NC) | 12.1 (7.6–27.0)
HR (95% CI) | 0.61 (0.47–0.80)
Stratified log-rank P value | 0.0004
Landmarks: Durvalumab+T+EV arm 67% (12 mo), 60% (24 mo); Control arm 50% (12 mo), 45% (24 mo)
Median follow-up: 23 months
[OS KM inset] | D+T+EV N=233 | Control N=229
Deaths, n (%) | 60 (26) | 74 (32)
Median OS, months (95% CI) | NR (NC–NC) | NR (37.7–NC)
HR (95% CI) | 0.77 (0.54–1.07)
Stratified log-rank P value | 0.1230
Landmarks: Durvalumab+T+EV arm 82% (12 mo), 75% (24 mo); Control arm 81% (12 mo), 69% (24 mo)
Median follow-up: 26 months
Events, n (%) | Durvalumab+EV n=228 | Durvalumab+T+EV n=229 | Control n=229
AEs possibly related to any treatment | 207 (91) | 216 (94) | NA
Maximum grade 3 or 4 AEs | 69 (30) | 97 (42) | NA
Serious AEs | 45 (20) | 70 (31) | NA
Leading to death | 1 (0.4) | 5 (2) | NA
Any-grade immune-mediated AEs | 75 (33) | 109 (48) | 8 (3)
Maximum grade 3 or 4 | 24 (11) | 46 (20) | 2 (0.9)
Leading to death | 0 | 3 (1) | 0
Neoadjuvant completed (safety population) | 84% | 69% | -
Surgery (safety population) | 87% | 80% | 79%
Adjuvant started (safety population) | 69% | 60% | -
D+T+EV vs D+EV:
• G3-4 irAE ↑
• Neoadjuvant therapy completed ↓
• Surgery ↓
OS signal still somewhat immature
Unlikely to justify tremi in the future
Michiel S. van der Heijden
1) Slide: Discussant slide: personalising perioperative treatment in MIBC today · 2) Slide: Discussant slide: de-escalation strategies in MIBC today (yes / not yet / no checklist)
#ESMO26 Can we personalize and de-escalate treatment strategies in MIBC? @urotoday
Two 🔑 checklists from @giannatempopatr
1) Personalizing peri-operative treatment today
2) De-escalation strategies in MIBC today https://t.co/bMpHLc5OVB
[Slide 1]
Personalising perioperative treatment today?
YES
Hystology/variant differentiation
May influence treatment choice
Renal Function (CrCl)
May influence treatment choice
PD-L1 ≥1%
Adjuvant Nivolumab after NAC or cisplatin-ineligible/declining adjuvant cisplatin
NO
T stage
Prognostic but not validated for treatment –selection
Nectin-4
Target not validate predictive biomarker
PD-L1
Not consistent in peri-operative strategy
NOT YET
HER-2
Promising but not validated
[Slide 2]
De-escalation strategies in MIBC today?
YES
ctDNA-guided adjuvant treatment
Evidence supports treatment selection (IMvigor011)
Omit adjuvant EV
Within VOLGA regimen
NOT YET
ctDNA-guided bladder preservation:
Not yet validated
utDNA -guided bladder preservation
Not yet validated
cCR and local tretament
Promising, but insufficient evidence
NO
Shorter neoadjuvant therapy
Insufficient evidence to support fewer cycles
Fantastic presentation by @tompowles1 @Uromigos on VOLGA trial showing practice changing EFS/OS benefit with neoadjuvant EV/durva ->RC ->durva vs no peri-op Tx in cisplatin-unfit pts with MIBC! Addition of treme (anti-CTLA4) with no extra benefit @myESMO #ESMO26 #ESMOAmbassadors https://t.co/ME45RBLzF4 https://t.co/YyD9yh4qdY
VOLGA: Conclusions
• Perioperative durvalumab plus 3 cycles of neoadjuvant enfortumab vedotin demonstrated statistically significant improvements in EFS and OS vs control in patients with MIBC ineligible for or who refused cisplatin-based chemotherapy
– EFS HR 0.51 (95% CI, 0.38–0.67), P<0.0001
– OS HR 0.58 (95% CI, 0.40–0.83), P=0.0027
– EFS and OS benefits were consistent across subgroups
• Durvalumab plus enfortumab vedotin had a tolerable and manageable safety profile that was consistent with the known safety profiles of the individual agents, with quality of life maintained after surgery
• Durvalumab and tremelimumab plus enfortumab vedotin also demonstrated a statistically significant improvement in EFS vs control
– OS analysis was not statistically significant at this interim analysis; follow-up is ongoing
VOLGA supports perioperative durvalumab plus 3 cycles of neoadjuvant enfortumab vedotin as a potential new standard of care for patients with MIBC ineligible for or who refused cisplatin-based chemotherapy
Scan the QR code to access: • Slide presentation • Plain language summary
Copies of this presentation obtained through the QR code are for personal use only and may not be reproduced without written permission of the authors.
Data cutoff 02 March 2026. CI, confidence interval; EFS, event-free survival; HR, hazard ratio; MIBC, muscle-invasive bladder cancer; OS, overall survival.
Slide: quality of life EORTC QLQ-C30 GHS/QoL, durvalumab+EV vs control (ESMO 2026)
🔊👏Bravo Dr Thomas Powles @TomPowles1 Outstanding Presentation @ Presidential Symposium, Topline Results VOLGA Trial, Perioperative durvalumab w/ or without tremelimumab + neoadj enfortumab vedotin in muscle-invasive bladder cancer #gusm #ESMO26 @OncoAlert https://t.co/eXZW8cMZYG
VOLGA: Quality of Life as Assessed by EORTC QLQ-C30
Patient-reported quality of life was maintained after surgery in the durvalumab+EV arm
GHS/QoL
Difference vs control: 3.53 (95% CI, −0.28 to 7.33)
Adjusted mean change of score from baseline (95% CI)
Timepoint: Adjuvant Cycle 1 | Adjuvant Cycle 2 | Adjuvant Cycle 3 | Adjuvant Cycle 4 | Adjuvant Cycle 5 | Adjuvant Cycle 6 | Adjuvant Cycle 7 | Adjuvant Cycle 8 | Adjuvant Cycle 9 | Follow-up Day 30
No. of patients in analysis
Durvalumab+EV | 98 | 93 | 92 | 97 | 92 | 85 | 86 | 81 | 84 | 62
Control | 61 | 58 | 57 | 55 | 55 | 44 | 45 | 39 | 47 | 37
Better / Worse
Clinically relevant change from baseline
Questionnaire compliance in the D+EV and control arms was 84% and 60% at baseline, 71% and 54% at adjuvant cycle 1, 66% and 64% at adjuvant cycle 9, and 34% and 29% at follow-up day 30, respectively.
A positive difference favours D+EV vs control. MMRM analysis of change from baseline in EORTC QLQ-C30 scores with fixed, categorical effects of treatment, visit, and treatment-by-visit interaction, PD-L1 status, tumour stage, and cisplatin status and the continuous fixed covariate of baseline score-by-visit interaction. A clinically relevant change was defined as a ≥10-point change in score compared with baseline.1
1. Osoba D, et al. J Clin Oncol. 1998;16:139–144. Data cutoff 02 March 2026. CI, confidence interval; D, durvalumab; EORTC QLQ-C30, European Organisation for Research and Treatment of Cancer 30-item Core Quality of Life Questionnaire; EV, enfortumab vedotin; GHS/QoL, global health status/quality of life; MMRM, mixed model for repeated measures; PD-L1, programmed cell death ligand-1.
Kaplan-Meier survival data: EFS KM curve, durvalumab-EV vs control (NEJM, Powles et al.)
🆙 Published @NEJM 🎊
🔥#ESMO26 Presidential Symposium I
🔥VOLGA: Perioperative Durvalumab With or Without Tremelimumab Plus Neoadjuvant Enfortumab Vedotin in Muscle-Invasive Bladder Cancer: Results From the Phase 3 Trial
🎙️ @tompowles1
🔢LBA2
🎯Durva+EV: Significantly Improved EFS (HR 0.51, 24-Mo 64% vs 45%) and OS (HR 0.58, p=0.0027) vs Control (n=233 vs 229)
🎯pCR 45% vs 10%; Durva+Treme+EV: EFS HR 0.61, OS Not Significant
☑️NCT04960709
🔗 https://t.co/t988kyrR7h
@OncoAlert @Larvol @myESMO
[KM curve] Percentage of Patients vs Months since Randomization (0-45)
Durvalumab–EV: 73.1 (12 months), 63.5 (24 months)
Control: 50.3 (12 months), 45.1 (24 months)
ORIGINAL ARTICLE
MEETING OF THE EUROPEAN SOCIETY FOR MEDICAL ONCOLOGY
Durvalumab Regimens in Invasive Bladder Cancer
T. Powles and Others
In patients with muscle-invasive bladder cancer, event-free survival at 24 months was 63.5% with perioperative durvalumab plus neoadjuvant enfortumab vedotin as compared with 45.1% with surgery alone.
Survival table
Endpoint: EFS
Durvalumab–EV
Control
Landmark rates:
12 months: Durvalumab–EV 73.1 | Control 50.3
24 months: Durvalumab–EV 63.5 | Control 45.1
1) Slide: Stage photo: AEs associated with durvalumab or EV (ESMO 2026) · 2) Slide: Stage photo: quality of life by EORTC QLQ-C30 GHS/QoL (ESMO 2026)
And VOLGA. Looks v likely that we can optimise periop treatment in MIBC by reducing EV exposure. Lower neuropathy rates will be important for cured pts. On treatment QoL looks reassuring. Long term QoL data will be key 🧩 particularly given early impact of cystectomy @tompowles1 https://t.co/tkAIWZkb79
[Slide 1]
VOLGA: AEs Known to be Associated With Durvalumab or EV
Durvalumab+EV had a safety profile consistent with exposure to perioperative D plus 3 cycles of neoadjuvant EV
Immune-mediated AEs per preferred term(a) [Patients with AEs (%)]
Hypothyroidism | 12
Rash | 5 (grade 3/4: 2)
Pruritus | 4 (grade 3/4: 0.4)
Diarrhoea | 2 (grade 3/4: [illegible])
Adrenal insufficiency | 2
Rash maculo-papular | 2 (grade 3/4: [illegible])
Pneumonitis | 2
Treatment-related AEs known to be associated with EV per grouped term(b) [Patients with AEs (%)]
Skin reactions | 49 (grade 3/4: 5)
Peripheral neuropathy | 18 (grade 3/4: 0.4) Grade 1: 12%; Grade 2: 5%; Grade 3: 0.4%
Hyperglycaemia | 11 (grade 3/4: 3)
Infusion-related reactions | 3
Durvalumab+EV arm, any grade (n=228)
Durvalumab+EV arm, max. grade 3 or 4 (n=228)
[footnotes small/partially illegible; appear to cite Rosenberg JE et al. J Clin Oncol 2019;37:2592-2600, EV EU risk management plan, investigator-assessed causality, data cutoff [illegible] March 2026]
[Slide 2]
VOLGA: Quality of Life as Assessed by EORTC QLQ-C30
Patient-reported quality of life was maintained after surgery in the durvalumab+EV arm
GHS/QoL
Difference vs control: 3.53 (95% CI, −0.28 to 7.33)
Adjusted mean change of score from baseline (95% CI)
Timepoint: Adjuvant Cycle 1 | Adjuvant Cycle 2 | Adjuvant Cycle 3 | Adjuvant Cycle 4 | Adjuvant Cycle 5 | Adjuvant Cycle 6 | Adjuvant Cycle 7 | Adjuvant Cycle 8 | Adjuvant Cycle 9 | Follow-up Day 30
Better / Worse
Clinically relevant change from baseline
No. of patients in analysis
Durvalumab+EV | [illegible across timepoints]
Control | 61 | 58 | 57 | 55 | 55 | 44 | 45 | 39 | 47 | 37
Questionnaire compliance in the D+EV and control arms was 84% and 60% at baseline, 71% and 54% at adjuvant cycle 1, 66% and 64% at adjuvant cycle 9, and 34% and 29% at follow-up day 30, respectively. [remaining footnote small; partially illegible - MMRM analysis; clinically relevant change defined as a ≥10-point change; data cutoff [illegible] March 2026]
1) Kaplan-Meier survival data: NEJM journal figure · 2) Kaplan-Meier survival data: EFS KM figure - durvalumab-tremelimumab-EV vs control (NEJM)
Original Article: Durvalumab, Tremelimumab, and Enfortumab Vedotin in Muscle-Invasive Bladder Cancer (phase 3 VOLGA trial) https://t.co/tWje7jxAxs
#ESMO26 | @myESMO https://t.co/FAzwApfQZP
Slide: Informal poll of 46 Italian medical oncologists on MIBC priorities - slide
Great discussion on escalation & de-escalation in #MIBC at #ESMO26! Not ready to de-escalate outside trials, but ready to personalise treatment. We're getting closer! 🚀
Fantastic team @LAUrology_NL @MichvdHeijden @niklas_kluemper! 👏 @OncoAlert @oncodaily @shilpaonc https://t.co/hC19FXwSRT
What should be our priority in MIBC?
PERSONALISING TREATMENT
Which treatment for which patient?
67%
31/46
DE-ESCALATING TREATMENT
Who can safely receive less treatment?
33%
15/46
Informal poll among 46 Italian medical oncologists, October 2026
Patrizia Giannatempo, MD
Slide: EFS by BICR for durvalumab + EV vs control (ITT) — blurry stage photo
🚨 Positive results from the phase 3 VOLGA trial presented at #ESMO26
The VOLGA trial evaluated perioperative durvalumab (D) ± tremelimumab (T) plus neoadjuvant enfortumab vedotin (EV) in patients with muscle-invasive bladder cancer (MIBC) who were ineligible for or refused cisplatin and were planned for radical cystectomy.
Both primary EFS endpoints were met:
🔹 D + EV vs control: HR 0.51; 24-month EFS 64% vs 45%
🔹 D + T + EV vs control: HR 0.61; 24-month EFS 60% vs 45%
Importantly, D + EV also significantly improved OS, with an HR of 0.58 and 24-month OS rates of 78% vs 69%.
Pathological complete response was 45% with D + EV vs 10% with control.
OS significance was not met for D + T + EV at this interim analysis; follow-up is ongoing.
📄 https://t.co/fyu9y6H97I
#ESMO26 #BladderCancer #MIBC #VOLGA
Perioperative Durvalumab ± Tremelimumab + Neoadjuvant EV in MIBC: Phase 3 VOLGA Trial. Presented by @tompowles1 @QMBCI. #ESMO26 written coverage by @chavarriagaj @PSH_Urology > https://t.co/8kpnLSOM6y #BladderCancer #MIBC #Immunotherapy @myESMO https://t.co/kH6XU8O3TW
[Slide 2]
5% alpha (2-sided)
EFS (2.7%) Durvalumab+EV vs control ↔ EFS (2.7%) Durvalumab+T+EV vs control
↓
OS (5%) Durvalumab+EV vs control
↓
OS (5%) Durvalumab+T+EV vs control
[Slide 3]
VOLGA: Patient Disposition
First patient randomised: Apr 2022; Last patient randomised: Jan 2025
1009 patients enrolled → 695 patients randomised
233 assigned to durvalumab+EV (ITT); 5 did not receive treatment | 233 assigned to durvalumab+T+EV (ITT); 4 did not receive treatment | 229 assigned to control (ITT and safety population)
Neoadjuvant: 228 received treatment (safety population); 192 completed neoadjuvant treatment; 36 discontinued neoadjuvant treatment | 229 received treatment (safety population); 159 completed neoadjuvant treatment; 70 discontinued neoadjuvant treatment
Surgery: 198 underwent cystectomy; 198 underwent RC; 35 did not undergo cystectomy(a) | 183 underwent cystectomy; 183 underwent RC; 50 did not undergo cystectomy(a) | 180 underwent cystectomy; 179 underwent RC; 1 had partial cystectomy; 49 did not undergo cystectomy(a)
Adjuvant: 157 received treatment(b); 128 completed adjuvant treatment; 28 discontinued adjuvant treatment | 137 received treatment(b); 98 completed adjuvant treatment; 38 discontinued adjuvant treatment
Follow-up: 177 ongoing in study | 164 ongoing in study | 142 ongoing in study
(a)The most common reasons for not undergoing cystectomy were patient decision (D+EV, n=15; D+T+EV, n=14; control, n=30), death (D+EV, n=7; D+T+EV, n=12; control, n=1), and disease progression (D+EV, n=4; D+T+EV, n=9; control, n=6). (b)One patient in the D+EV arm and one in the D+T+EV arm were ongoing adjuvant treatment at data cutoff. Data cutoff 02 March 2026.
Create a free account, pick the tumor types you cover, and go beyond the tweet — the intelligence pharma teams use to map influence and prepare for engagement:
🚨📣📣 #ESMO26 presidential: @niazi_Dr7 Adding darolutamide to ADT + RT dramatically ⬇️ risk of metastasis or death in high-risk localized prostate cancer. Phase 3 DASL-HiCaP = 58% ⬇️ in MFS (HR 0.42) + early OS signal (HR 0.88). #ProstateCancer #RadOnc #pcsm @ChrisSweens1 https://t.co/7JuxQ3qSr9
PROTEUS: A Randomized, Double-Blind, Placebo-Controlled Phase 3 Study in HR-LPC
N=2109 Patients With HR-LPC
RANDOMIZED 1:1
Neoadjuvant (C1 through C6): APA (240 mg QD) + ADT | PBO + ADT
2 wks -> RPa + ADT -> 4 wks
Adjuvant (C7 through C12): APA (240 mg QD) + ADT | PBO + ADT
Post treatment:
• PSMA-PET (3 months after EOT)
• PSA every 3 months
• Conventional and PSMA-PET imaging at BCF (PSA ≥0.2 ng/mL); every 6 months thereafter
Stratification:
• cN0 vs N1
• Gleason score (7 vs 8-10)
• Region (North America, Europe, ROW)
Adjuvant or salvage RT post-RP at investigator's discretion
• To complement these data, a substudy is ongoing to further inform on the role of APA + ADT + RP versus RP alone
Patients randomized from July 15, 2019, to June 30, 2022.
Protocol Amendment 7 for including PSMA-PET into MFS assessment (April 14, 2022).
APA, apalutamide; BCF, biochemical failure; C, cycle; EOT, end of treatment; PBO, placebo; PSA, prostate-specific antigen; PSMA-PET, prostate-specific membrane antigen positron emission tomography; QD, daily; ROW, rest of the world; RT, radiation therapy.
aAPA/PBO is stopped 2 weeks prior to planned RP and then resumed 4 weeks after RP. Cardiovascular risk prophylaxis and venous thromboembolism prophylaxis given based on risk.
Slide: (LBA4) abstract results table: MFS, PSA-PFS, PCSS, OS
⚡️LBA4⚡️ DASL-HiCaP (ANZUP1801) Ph 3 RCT #ESMO26
Daro + ADT and definitive/salvage locoregional RT for very HR PCa @urotoday
🚨n=1,106; mFU 3.8 yrs; 85% definitive RT
🚨Primary EP MFS by CI: ⏫ for Daro vs PBO
- 4-year MFS-CI 95% vs 88%
- HR 0.42 (95% CI 0.27 to 0.66)
DASL-HiCaP at #ESMO26, presented by @Niazi_Dr7: darolutamide + RT + 2 yrs ADT vs placebo in very high-risk prostate cancer (n=1,106)
▪️ MFS HR 0.42, 4-yr MFS 95% vs 88%
▪️ PSA-PFS HR 0.47
▪️ Time to CRPC HR 0.22
▪️ OS immature (HR 0.88)
#ProstateCancer https://t.co/pfDHyuM2qW
DASL-HiCaP Conclusions:
• The addition of darolutamide to 2 years of ADT and primary or Salvage RT including pelvic nodal radiation significantly improved MFS-CI for patients with DASL very-high risk prostate cancer.
• MFS-CI is a proven surrogate (early intermediate clinical endpoint) for OS in this setting.
• This benefit was consistent across all subgroups.
• PSA-PFS, time to subsequent therapy, and time to CRPC, all favoured darolutamide.
• The treatment burden was similar to placebo with limited additional burden.
• Darolutamide reduces the risk of relapse to a clinically meaningful degree, as such it defines a new paradigm for the care of patients with prostate cancer at very high risk of recurrence and being treated with curative intent radiotherapy.
Tamim Niazi
@Niazi_Dr7 #DASL-HiCaP
1) Slide: Baseline risk and RT comparison: STAMPEDE vs ENZARAD vs Silke Gillessen discussant · 2) Slide: Control arm and baseline characteristics: STAMPEDE vs ENZARAD vs Gillessen discussant · 3) Slide: HR for MFS in N1 patients: STAMPEDE M0 vs ENZARAD vs Gillessen discussant
#ESMO26 DASL-HiCaP Presidential Discussant -- @Silke_Gillessen
Differences in BL risk and pt selection may explain variation in treatment effects for STAMPEDE M0, ENZARAD, DASL-HiCaP
Among N1 pts only, ARPI MFS benefit:
◾️STAMPEDE M0: HR 0.49, 95%CI 0.38-0.64
◾️ENZARAD: HR 0.43, 95%CI 0.20-0.92
◾️DASL-HiCaP: HR 0.39, 95%CI 0.19-0.81
[Slide 1]
LBA4: DASL-HiCaP
About 2 years of systemic therapy
Patients with DASL very high-risk features
• Radical radiation therapy:
• ISUP Grade Group 5
• ISUP Grade Group 4 with
• cT2b-T4 or rT3a+ or PSA> 20 ng/mL
• cN1
85% n=935
• BCR post RP + PSA persistence/rise w/in 12 months and at least:
• pN1 or cN1
• ISUP Grade Group 5
• ISUP Grade Group 4 with pT3a+
15% n=171
1,106 patients (R 1:1)
Radiation therapy ADT | Prostate / bed + pelvic LNs + 96 weeks of ADT
Darolutamide: 600 mg | Twice daily x 96 weeks
Radiation therapy ADT | Prostate / bed + pelvic LNs + 96 weeks of ADT
Placebo | Twice daily x 96 weeks
Primary endpoint
• Metastasis-free Survival (MFS)-CI
Secondary endpoints
• Overall survival
• Prostate cancer specific survival
• PSA-progression free survival
• Time to subsequent hormonal therapy
• Time to castration resistance
• Frequency and severity of adverse events
• Health-related Quality of life
• Fear of Cancer recurrence
Exploratory
• Incremental cost-effectiveness
• Prognostic/Predictive biomarkers
Stratification factors:
• Previous radical prostatectomy
• Planned docetaxel use
• Clinical or pathological Pelvic N1
613 pts (55%) had a PSMA-PET but patients with mi*N1 were considered as N0, patients with mi*M1 were considered M0
* Molecular imaging
Adapted from Niazi T et al. ESMO 2026
Two definitions of very high-risk non-metastatic prostate cancer
STAMPEDE M0 (Abiraterone ± Enzalutamide) For N0: 2 risk factors needed
Localised
• cN1 (conventional imaging) or
• cN0 with ≥2 of: T3/4, Gleason 8–10, PSA ≥40ng/mL
Relapse after local therapy with high-risk features: N1 or PSA ≥4ng/mL, rising + PSA doubling time <6 mo or PSA ≥20ng/mL.
If prior ADT: ≤12 mo of total ADT with an interval of ≥12 mo without treatment
DASL-HiCaP (Darolutamide) For N0: Gleason 9/10 or Gleason 8 with at least 1 risk factor
Localised
• cN1 (conventional imaging) or
• cN0 with Gleason 9/10 (alone sufficient)
• cN0 with Gleason 8 with cT2b-T4 or seminal vesicle invasion/extracapsular extension in MRI or PSA >20ng/mL
Relapse after radical prostatectomy (≤1 year prior to randomisation) and planned for salvage RT for persisting or rising PSA (≥0.1ng/mL): pN1/cN1 or Gleason 9/10 or Gleason 8 with ≥ pT3a+
Attard G et al. Lancet 2022; Niazi T et al. ESMO 2026
Primary Endpoint MFS-CI
% Event-Free
RT + ADT + Darolutamide N=553 | RT + ADT + Placebo N=553
Events, n (%) | 27 (5%) | 63 (11%)
MFS-CI 4 years | 95% | 88%
Metastases | 9 (33%) | 46 (73%)
Death (w/o prior metastases) | 18 (67%) | 17 (27%)
HR | HR 0.42 (95% CI: 0.27-0.66)
P-value | p=0.0001
• The planned interim analysis was triggered after the 87th MFS-CI event was centrally corroborated.
• The observed P-value of 0.0001 met the rejection-boundary of 0.012 for the null hypothesis.
Months
Number at risk (number censored)
Tamim Niazi
Conventional imaging MFS at 4 years
Interim Analysis of Secondary Endpoints
Events (EF 4y) RT+ADT+Darolutamide N=553 | Events (EF 4y) RT+ADT+Placebo N=553 | HR (95% CI)
PSA-PFS | 46 (91%) | 95 (83%) | 0.47 (0.33 - 0.67)
CRPC | 6 (99%) | 28 (95%) | 0.22 (0.09 - 0.52)
Subsequent Hormonal Therapy | 19 (96%) | 52 (90%) | 0.36 (0.21 - 0.60)
PCSS | 4 (99%) | 7 (99%) | 0.58 (0.17 - 1.97)
OS | 21 (97%) | 24 (95%) | 0.88 (0.49 - 1.59)
EF 4y: Event Free at 4 years; PFS: Progression-Free Survival; PCSS: Prostate Cancer-Specific Survival; OS: Overall Survival; CRPC: Castration-Resistant Prostate Cancer
Survival table
Endpoint: MFS-CI (metastasis-free survival, conventional imaging)
RT + ADT + Darolutamide | 553
RT + ADT + Placebo | 553
HR: 0.42
HR CI: 0.27-0.66
P: 0.0001
MFS-CI 4 years: 95% vs 88%
[Slide 2]
Differences in the two more modern trials
(treatment naïve patients)
| STAMPEDE „very high" 2011-2016 Positive for MFS and OS | ENZARAD "high" 2014-2018 Negative | DASL-HiCaP „very high" 2020-2023 Positive for MFS
Control arm | ADT alone | ADT + 6 mo NSAA | ADT + placebo
N1 (conv imaging) | 38% | 11% | 24%
Gleason <8 and N0 | 11% | 9% | 0%
Gleason 9/10 | 54%* | 54% | 73%
cT3-cT4 | 93% | 47% | 52%
PSA ≧ 20 ng/ml | NR | 35% | 29%
Median PSA ng/ml | 34* | 14 | 11
RT to pelvis | Recommended for N1; optional for N0 | Mandatory for N1; optional for N0 | Mandatory for N1 and N0
* Including patients in relapsed setting (3%)
S. Gillessen
Attard G et al. Lancet 2022; Nguyen P et al. ESMO 2025; Williams S et al. J Clin Onc 2026, in press; Niazi T et al. ESMO 2026
[Slide 3]
Potential Biomarkers are emerging
1. Multimodal AI (MMAI) model
Analysis of digitized H&E tissue slides and clinical factors (approved by FDA)
2. 22-gene Genomic Classifier (Decipher)
RNA-based genomic test for prostate cancer prognosis (approved by FDA)
Benefit seen in MMAI very high-risk
MMAI Standard high-risk | MMAI Very high-risk
Benefit increases with higher Decipher scores
First quartile (GC ≤0.69) | Fourth quartile (GC ≥0.95)
Treatment arm
ADT alone
ADT + abiraterone
Years since randomisation
Number at risk (% distant metastasis)
Tests seem to identify patients that are less likely to develop metastases or die from prostate cancer and seem to have limited benefit from treatment intensification
Silke Gillessen
Parker CTA et al. Ann Oncol 2026; Courtesy of Sarah Howlett, presented ESMO 2026
Compelling presentation by Tamim Niazi! DASL-HiCaP: adding darolutamide to ADT + RT improved MFS in very high-risk nonmetastatic prostate cancer (HR 0.42; 4-year MFS 95% vs 88%). Important phase III evidence for intensification! #ESMO26 @oncoalert @myESMO https://t.co/ALgNRFY3ka
DASL-HiCaP Rationale
Unmet need:
• At study inception in 2019, long course ADT + radiation was the standard of care for patients treated with primary radiation therapy for localized/locally advanced prostate cancer at very high risk of relapse.
• STAMPEDE in 2022 and ENZARAD in 2025 reported some patients do benefit from addition of abiraterone or enzalutamide (pelvic RT) to standard long course ADT plus radiation therapy.
• In 2026, there is still uncertainty as to which patients having standard of care Radiation and ADT will most likely benefit from systemic treatment intensification.
[References 1-3 too small to read reliably: Attard G, ... STAMPEDE ... Lancet 2022; Nguyen PL, et al. Phase III ENZARAD Trial ... Abstract ...; Xie W, et al. ICECaP Working Group, Metastasis-Free Survival is a Strong Surrogate of Overall Survival in Localized Prostate Cancer. J Clin Oncol ...]
Tamim Niazi
@Niazi_Dr7 #DASL-HiCaP
DASL-HiCaP: darolutamide on top of 96 weeks of ADT plus RT improved MFS in very high-risk localized prostate cancer, HR 0.42, 4-yr MFS 95% vs 88%.
📈 n=1,106, interim at 67% of events, 46 mo follow-up. OS immature
📝 Thanks to @Silke_Gillessen putting this into context STAMPEDE M0 (HR 0.53) and ENZARAD (HR 0.88): not contradictory, the ARPI benefit tracks metastatic risk
🎯 N1 is the clearest indication. N0 is less clear, and Gleason seems to matter
Every patient got pelvic RT, so who needs it in N0 not yet answered.
@Niazi_Dr7 #ProstateCancer #GUonc #ESMO26
[Slide 1]
MADRID 2026 ESMO congress
THE UNIVERSITY OF SYDNEY — Sydney Clinical Trials Centre
ANZUP Cancer Trials Group Limited
Darolutamide with androgen deprivation therapy (ADT) and definitive or salvage locoregional radiation therapy (RT) for localised, very high-risk prostate cancer: interim analysis of an international, placebo-controlled, randomised phase 3 trial (DASL-HiCaP; ANZUP1801)
Tamim Niazi, Hayley Thomas, Alison Y. Zhang, Scott Williams, Ian D. Davis, Sean M. McBride, Hans T. Chung, Annie Ebacher, Eric Khoo, Jarad Martin, Tee Sin Lim, Simon Hughes, David Pryor, Paul J Kelly, Leily Gholamrezaei, Scott C. Morgan, Wendy Parulekar, Grace Balicki, Martin R. Stockler, Christopher Sweeney, Australian and New Zealand Urogenital and Prostate Cancer Trials Group (ANZUP)
Tamim Niazi MDCM
Department of Oncology, McGill University
Division of Radiation Oncology, Jewish General Hospital
University Health Centre, Montreal, Qc. Canada
Madrid Oct 2026
Tamim Niazi
[Slide 2]
DASL-HiCaP: Primary Endpoint Metastases Free Survival by conventional imaging (MFS-CI)
Follow-Up: 46 months
Interim analysis at 67% of the required events for final analysis
% Event-Free; Months (0, 12, 24, 36, 48, 60)
| RT + ADT + Darolutamide N=553 | RT + ADT + Placebo N=553
Events, n (%) | 27 (5%) | 63 (11%)
MFS-CI 4 years | 95% | 88%
Metastases | 9 (33%) | 46 (73%)
Death (w/o prior metastases) | 18 (67%) | 17 (27%)
HR | HR 0.42 (95% CI: 0.27−0.66)
P-value | p=0.0001
Number at risk (number censored)
553 (0) | 535 (15) | 526 (18) | 460 (78) | 219 (313) | 58 (468)
553 (0) | 536 (11) | 516 (14) | 448 (69) | 213 (288) | 63 (429)
Statistically significant benefit also in important secondary endpoints:
PSA-Progression Free Survival
Time to Subsequent Hormonal Therapy
Time to Castration Resistance
OS data immature
Only 4/21 (Daro) and 7/24 (Plac) deaths from prostate cancer
Survival table
Endpoint: MFS-CI (metastases-free survival by conventional imaging)
RT + ADT + Darolutamide | 553
RT + ADT + Placebo | 553
HR: 0.42
HR CI: 0.27-0.66
P: 0.0001
Landmark rates:
4 years: RT + ADT + Darolutamide 95% | RT + ADT + Placebo 88%
[Slide 3]
DASL-HiCaP
Strengths
• Academic, large, blinded, international trial with > 1000 patients
• Addresses an important question in the era of modern radiotherapy
• Inclusion of patients with high-risk relapsed disease
• PSMA PET scans and sample collection done and will support further research
Considerations
• Heterogenous patient population including treatment naïve and relapsed patients
• Early results from the interim analysis, final analysis awaited; OS data immature
• The question which patients with N0 disease benefit from addition of RT to the pelvis cannot be answered, since all patients received it
• Introducing a new definition of «very high-risk»
Silke Gillessen
Invited Discussant LBA4
[Slide 4]
Clinical implications
• DASL-HiCaP is statistically positive: 96 wks of ADT plus Darolutamide and prostate and pelvic RT improve MFS-CI for patients with very high-risk prostate cancer. Final analysis and OS awaited
• Added toxicity seems limited and this should be considered in the risk to benefit ratio. Also life expectancy is relevant in this context
• The clearest indication is in patients with N1 disease. This is supported by subset analysis of the trials with Abiraterone and Enzalutamide that also look positive in this subgroup
• For N0 disease, the indication is less clear. Gleason seems to be important and suggests biology is relevant: more work on biomarkers is needed
• Patients with very high-risk relapsed disease seem to have the same treatment effect, however few such patients were included in the trial
Silke Gillessen
Invited Discussant LBA4
1) Slide: discussion: key questions for high-risk localised/relapsed prostate cancer · 2) Slide: Two definitions of very high-risk non-metastatic prostate cancer: STAMPEDE M0
GU à l'honneur in the Presidential Symposium today!
Adding daro to RT + 2 yrs of ADT significantly improved MFS in very high-risk prostate cancer!
Do we have a new definition of "very high risk" prostate cancer? I cannot wait to be back to GU clinic on Tuesday!
As usual Dr. @Silke_Gillessen expertly discusses the results (yes I took pictures of every slide)!
#ESMO26 @OncoAlert
[Slide 2]
Key questions for patients with high-risk localised or relapsed prostate cancer treated with radiotherapy
• Does the addition of an ARPI* to RT + ADT** improve outcomes?
• Who benefits from the addition of RT to the pelvis?
• In which patients can we de-escalate treatment?
2 settings:
1. High-risk localised disease (treatment-naïve)
2. Post radical prostatectomy: High-risk salvage RT setting
*Androgen receptor pathway inhibitor
e.g. Abiraterone, Apalutamide, Darolutamide, Enzalutamide
**Androgen deprivation therapy
S. Gillessen
Silke Gillessen
Invited Discussant LBA4
[Slide 4]
Two definitions of very high-risk non-metastatic prostate cancer
STAMPEDE M0 (Abiraterone ± Enzalutamide) | DASL-HiCaP (Darolutamide)
For N0: 2 risk factors needed | For N0: Gleason 9/10 or Gleason 8 with at least 1 risk factor
Localised | Localised
• cN1 (conventional imaging) or | • cN1 (conventional imaging) or
• cN0 with ≥2 of: T3/4, Gleason 8–10, PSA ≥40ng/mL | • cN0 with Gleason 9/10 (alone sufficient)
| • cN0 with Gleason 8 with cT2b-T4 or seminal vesicle invasion/extracapsular extension in MRI or PSA >20ng/mL
Relapse after local therapy with high-risk features: N1 or PSA ≥4ng/mL, rising + PSA doubling time <6 mo or PSA ≥20ng/mL. | Relapse after radical prostatectomy (≤1 year prior to randomisation) and planned for salvage RT for persisting or rising PSA (≥0.1ng/mL): pN1/cN1 or Gleason 9/10 or Gleason 8 with ≥ pT3a+
If prior ADT: ≤12 mo of total ADT with an interval of ≥12 mo without treatment |
Attard G et al. Lancet 2022; Niazi T et al. ESMO 2026
Silke Gillessen
Invited Discussant LBA4
From clinical risk factors to biology
Today — Clinical selection
• cN1 M0 in conventional imaging
• Gleason 9/10 (and other DASL-HiCaP criteria)
• STAMPEDE: ≥2 of T3–4, GS 8–10, PSA ≥40
Next step — Retrospective validation
• Application of MMAI and Decipher to tissue from DASL-HiCaP, ENZARAD and other trials in this setting
• Meta-analysis of individual patient data across trials
• Analysis of treatment effects in patients with PSMA PET positivity
Future — Prospective selection
Biomarker-driven trials:
• PREDICT-RT (NCT04513717), using Decipher
• GUIDANCE (NCT05050084), using Decipher
• THUNDER (NCT06282588), using Decipher and PSMA PET
These trials incorporate modern biology for treatment selection and De-escalation strategies to minimise toxicity
Silke Gillessen
Silke Gillessen — Invited Discussant LBA4
16:30 - 18:15 Presidential Symposium I
CHAIRS: FABRICE ANDRÉ, JAMES LARKIN
Conclusions
• This data does help to resolve the difference of the results of the other two trials, which is based around the proportion of patients at risk. They are not contradictory, the ARPI benefit seems to appear when the risk of metastases is high and disappears in lower-risk N0 patients (ENZARAD)
• The role of pelvic radiotherapy in very high-risk N0 patients has yet to be resolved
• We need to re-define "very high-risk" incorporating modern imaging and biomarkers
• In the future we should evaluate not only intensification, but biomarker driven de-escalation to avoid overtreatment in this group of patients, ideally with non-testosterone suppressing strategies
Silke Gillessen
Invited Discussant LBA4
ALICANTE AUDITORIUM - HALL 6
Slide: Discussant slide (Silke Gillessen): STAMPEDE M0 vs ENZARAD vs ARPI
While DASL-HiCaP reinforces ARPI intensification, important questions remain @Silke_Gillessen
Why positive #STAMPEDE/#DASL-HiCaP, yet not #ENZARAD? Which high-risk patients benefit most? Primary vs salvage RT? And how does #PROTEUS reshape intensification around surgery? #Enzalutamide #Apalutamide #Darolutamide
❓Different risk definitions and primary vs salvage settings complicate comparisons.
❓Who truly needs ARPI intensification, and when? What is the additive role of #RadiationTherapy and #RadicalProstatectomy
❓With PROTEUS extending the discussion to prostatectomy, better patient selection and identifying the best prognostic and predictive biomarkers reflecting specific early/local/locally advanced indications remains key
#ESMO26 #ProstateCancer #UrologicOncology @oncodaily @OncoDailyGU @urotoday
One question, three trials and two answers
Same strategy of 2 years of ARPI intensification: positive in STAMPEDE and DASL-HiCaP, negative in ENZARAD
STAMPEDE M0 Abiraterone ± Enza n=1974 2011-2016 | ENZARAD Enzalutamide n=802 2014-2018 | DASL-HiCaP Darolutamide n=1106 2020-2023
HR for MFS-CI in all patients (Prim. Endpoint): 0.53 (95% CI 0.44, 0.64) p<0.0001 | 0.88 (95% CI 0.67, 1.15) p=0.34 | 0.42 (95% CI 0.27, 0.66) p=0.0001
HR for OS in all patients: 0.6 (95% CI 0.48, 0.73) p<0.0001 | 0.87 (95% CI 0.63, 1.2) p=0.4 | immature
Median FU: 72 mo | 92 mo | 46 mo (interim analysis)
Silke Gillessen
Invited Discussant LBA4
Trial design schema: (LBA4) study design - discussant Silke Gillessen
DASL-HiCaP: Darolutamide plus RTE in very high risk localized prostate cancer increases MFS (HR 0.42) and other secondary objectives. mFU: 2 years. A new SoC?: NGI and Biomarkers are necessary for patients selection. #ESMO26 #ProstateCancer @myESMO @sogug1 @_SEOM https://t.co/AIyPfPLhhJ
LBA4: DASL-HiCaP
Patients with DASL very high-risk features
85% n=935
• Radical radiation therapy:
• ISUP Grade Group 5
• ISUP Grade Group 4 with
• cT2b-T4 or rT3a+ or PSA> 20 ng/mL
• cN1
15% n=171
• BCR post RP + PSA persistence/rise w/in 12 months and at least:
• pN1 or cN1
• ISUP Grade Group 5
• ISUP Grade Group 4 with pT3a+
1,106 patients (R 1:1)
About 2 years of systemic therapy
Radiation therapy ADT | Prostate / bed + pelvic LNs + 96 weeks of ADT
Darolutamide: 600 mg | Twice daily x 96 weeks
Radiation therapy ADT | Prostate / bed + pelvic LNs + 96 weeks of ADT
Placebo | Twice daily x 96 weeks
Primary endpoint
• Metastasis-free Survival (MFS)-CI
Secondary endpoints
• Overall survival
• Prostate cancer specific survival
• PSA-progression free survival
• Time to subsequent hormonal therapy
• Time to castration resistance
• Frequency and severity of adverse events
• Health-related Quality of life
• Fear of Cancer recurrence
Exploratory
• Incremental cost-effectiveness
• Prognostic/Predictive biomarkers
Stratification factors:
• Previous radical prostatectomy
• Planned docetaxel use
• Clinical or pathological Pelvic N1
613 pts (55%) had a PSMA-PET but patients with mi*N1 were considered as N0, patients with mi*M1 were considered M0
* Molecular imaging
Silke Gillessen
Adapted from Niazi T et al. ESMO 2026
Darolutamide with ADT and locoregional
radiation therapy (RT) in high-risk prostate cancer (DASL) showed Darolutamide reduced the risk of relapse and time to CRPC. Tolerably was good. #ESMO26 https://t.co/KBTpYUF4cl
1) Slide: Discussant slide: MFS vs OS surrogate regression, study duration by MFS HR and sample · 2) Slide: Discussant slide: patient preference relative attribute importance · 3) Kaplan-Meier survival data: MFS-CI KM reproduced in discussant talk
Who Benefits from Treatment Intensification in High-Risk Localized or Relapsed Prostate Cancer? A Discussion of DASL-HiCaP. Presented by @Silke_Gillessen. #ESMO26 written coverage by @zklaassen_md > https://t.co/t3qanHxbji #ProstateCancer #RadOnc @myESMO https://t.co/8dFRVpbyAv
Kaplan-Meier survival data: primary endpoint MFS-CI: darolutamide vs placebo with RT +
🔴 Just presented at #ESMO2026: DASL-HiCaP
Adding darolutamide to ADT + locoregional RT significantly improved metastasis-free survival in very high-risk localised or biochemically persistent/recurrent prostate cancer in the DASL-HiCaP trial.
At 4 years:
🔹 MFS: 95% vs 88% (HR 0.42)
🔹 PSA-PFS: 91% vs 83% (HR 0.47)
🔹 PCSS: 99% vs 99% (HR 0.58)
🔹 OS: 97% vs 95% (HR 0.88)
Grade ≥3 adverse events occurred in 43% with darolutamide vs 36% with placebo.
Follow-up is ongoing to assess longer-term outcomes, including OS.
#ESMO26 #ProstateCancer #Darolutamide #DASLHiCaP
Can systemic treatment intensification reduce recurrence risk in high-risk localised prostate cancer? #ESMO26 presentation of interim results from the #DASLHiCaP #CCTG PR.22 international (ANZUP 1801) clinical trial. https://t.co/qGKUgnL9wg https://t.co/MYjwddyqpR
1) Biomarker data: Pre- and On-Treatment ctDNA Status: EV + pembro vs Cis + gem · 2) Kaplan-Meier survival data: Kaplan-Meier Estimates of EFS per BICR by ctDNA · 3) Biomarker data: ctDNA Clearance and EFS by ctDNA Status Change From Baseline · 4) Kaplan-Meier survival data: Kaplan-Meier Estimates of EFS per BICR by ctDNA
ctDNA analysis from the EVP vs chemotherapy muscle invasive bladder cancer trial (B15/EV304) shows ctDNA is strongly prognostic at all time points for both arms. EVP has higher clearance rates across time points, underlining its ⬆️ activity. Results for the control arm are strikingly similar to the ctDNA results in the chemo control arm in the NIAGARA trial. This consistency underlines the utility of ctDNA from a prognostic perspective.#ESMO26 @OncoAlert
1) Trial design schema: KEYNOTE-B15 HRQoL title slide: perioperative EV + · 2) Slide: KEYNOTE-B15 HRQoL conclusions (Gómez De Liaño, ESMO 2026)
Elegant presentation by @Uro_Oncologist reporting HRQoL from #Keynote-B15.
Perioperative EV-P was not associated with clinically meaningful detriment in general HRQoL or cystectomy-specific HRQoL !
#ESMO26 #Day2 @myESMO @OncoAlert https://t.co/eSoiNht3Jw
[Slide 1]
Health-Related Quality of Life With Neoadjuvant and Adjuvant Enfortumab Vedotin Plus Pembrolizumab in Participants With Muscle-Invasive Bladder Cancer Eligible for Cisplatin in the Phase 3 KEYNOTE-B15 Study
Alfonso Gómez De Liaño1; Begona Perez Valderrama2; Marco Maruzzo3; Tudor Ciuleanu4; Thomas Deja5; Consuelo Buttigliero6; Seung Il Jung7; Alison Y. Zhang8; Karim Chamie9; Daniel Sloth Hauberg10; Eleni Theodorou11; Qinlei Huang12; Aljosja Rogiers12; Allison Martin Nguyen12; Matthew D. Galsky13
1Complejo Hospitalario Universitario Insular-Materno Infantil de Gran Canaria, Universidad de Las Palmas de Gran Canaria, Las Palmas, Spain; 2Hospital Universitario Virgen del Rocio, Seville, Spain; 3Istituto Oncologico Veneto IRCCS-Oncologia Medica 1, Padova, Italy; 4Institutul Oncologic Prof. Dr. Ion Chiricuta Cluj-Napoca, Cluj-Napoca, Romania; 5Clinical Research Center Sp. z o. o. Medic-R Sp.k, Poznań, Poland; 6Department of Oncology, University of Turin, San Luigi Gonzaga Hospital, Orbassano, Italy; 7Chonnam National University Hwasun Hospital, Hwasun Gun, Republic of Korea; 8Macquarie University Hospital, Sydney, NSW, Australia; 9UCLA, Los Angeles, CA, USA; 10Pfizer, Ballerup, Denmark; 11Astellas Pharma Inc., Addlestone, United Kingdom; 12Merck & Co., Inc., Rahway, NJ, USA; 13Icahn School of Medicine at Mount Sinai, The Tisch Cancer Center at Mount Sinai, New York, NY, USA
[Slide 2]
Conclusions
• The use of perioperative EV plus pembrolizumab was not associated with a clinically meaningful detriment in general HRQoL or cystectomy-specific HRQoL
• No clinically meaningful between-group differences were observed in the prespecified HRQoL domains assessed
• The largest deterioration in most HRQoL domains was observed after surgery, followed by partial recovery in both treatment groups
• Sexual function showed clinically meaningful and persistent worsening in both treatment groups, consistent with the known impact of radical cystectomy
• Together with the efficacy and safety results observed in the primary analysis, these PRO findings further support the overall benefit-risk profile of perioperative EV plus pembrolizumab in participants with cisplatin-eligible MIBC1
1. Galsky MD et al. N Engl J Med. 2026;395:338-348.
ctDNA insights from KEYNOTE-B15 by #DrJonathanChatzkel: perioperative EV + Pembro vs Gem/Cis in cis-eligible MIBC. ctDNA clearance 82.1% vs 66.7%.
Post-surgery ctDNA+ 4.8% vs 13.5%.
EFS benefit with EV/Pembro across baseline ctDNA strata, exploratory ctDNA+ HR 0.54.
#ESMO26 #BladderCancer @myESMO @OncoAlert
[Slide 1]
KEYNOTE-B15/EV-304 Study (NCT04700124)
Key Eligibility Criteria
• Adults with MIBC
• Clinical stage T2-T4aN0M0 or T1-T4aN1M0 by central assessment
• Urothelial histology ≥50%
• Eligible for RC + PLND
• Did not meet any Galsky criteria for cisplatin ineligibility¹
• ECOG PS score of 0 or 1
N = 808 R 1:1
N = 405 Neoadjuvant: Enfortumab vedotin + Pembrolizumab
ctDNA testing time pointsᵃ (via Natera Signatera™ assay)
Baseline (W1D1) n = 490ᵇ
Presurgery (W13 ± 7 d) n = 436ᵇ
RC + PLND
Postsurgery (W6 ± 14 d) n = 432ᵇ
Adjuvant (W30-34) n = 188ᵇ
Adjuvant: Enfortumab vedotin + Pembrolizumab
N = 403 Cisplatin + Gemcitabine → Observationᶜ
• Primary end point: Event-free survival (EFS) by blinded independent central review
Exploratory: Evaluation of EFS and pCR by pre- and on-treatment ctDNA status
ᵃAnalysis was performed in the ctDNA-evaluable population, defined as all randomly assigned participants with available ctDNA status at ≥1 of 4 time points during the study. ᵇBoth treatment arms combined. ᶜAs of February 2023, adjuvant nivolumab was permitted when clinically indicated and regionally available.
1. Galsky MD et al. Lancet Oncol. 2011;12:211-214. Data cutoff date: October 27, 2025.
[Slide 2]
ctDNA-Evaluable Population at the Adjuvant Time Point
ctDNA-evaluable population
EV + pembro, n (%)ᵃ: Baseline 254 (62.7) | Presurgery 208 (51.4) | Postsurgery 209 (51.6) | Adjuvant 69 (17.0)
Cis + gem, n (%)ᵃ: Baseline 236 (58.6) | Presurgery 228 (56.6) | Postsurgery 223 (55.3) | Adjuvant 119 (29.5)
Baseline (W1D1) n = 490ᵇ; Presurgery (W13 ± 7 d) n = 436ᵇ; RC + PLND; Postsurgery (W6 ± 14 d) n = 432ᵇ; Adjuvant (W30-34) n = 188ᵇ
Nonevaluable included samples that were not received or collected, had insufficient cell-free DNA for testing, or failed the assay
Reasons for reduced sample availability at the adjuvant time point
• The reduced sample availability at the adjuvant timepoint is likely multifactorial, reflecting:
– Expected patient attrition
– An elevated rate of test failures at adjuvant W30-34 associated with insufficient cell-free DNA and lower plasma volumes
– Timelines for procedures in the two arms were different
• Although these effects were observed across both arms, the greater frequency of assay failures and/or missed collections in the EV + pembro arm may have contributed to its higher attrition rate
ᵃPercentages are based on the intention-to-treat population (EV + pembro, n = 405; cis + gem, n = 403). ᵇBoth treatment arms combined.
Data cutoff date: October 27, 2025.
[Slide 4]
Conclusions
• In this exploratory ctDNA analysis from KEYNOTE-B15, a ctDNA-positive status was associated with poor prognosis in both treatment arms
– ctDNA-negative status was associated with improved EFS (baseline and postsurgery) and pCR (presurgery) compared with ctDNA-positive status in both treatment arms
• Perioperative EV + pembro showed favorable EFS outcomes versus neoadjuvant cis + gem regardless of ctDNA status at baseline or postsurgery
• Participants with ctDNA clearance at presurgery had more favorable EFS outcomes compared with those without ctDNA clearance
• ctDNA clearance at presurgery was higher with EV + pembro versus cis + gem
– Participants in the EV + pembro arm with ctDNA clearance had improved EFS versus those in the cis + gem arm with ctDNA clearance
• These findings show that ctDNA is strongly prognostic, regardless of therapy in this study
• ctDNA clearance was higher with EV + pembro than with cis + gem
Slide: KEYNOTE-B15: empirical mean change from baseline in EORTC QLQ-C30
🎯 #ESMO2026 2º day Rapid oral GU non-prostate session. @Uro_Oncologist presented the HRQL of EV-304 periop MIBC!!
EV +pembro was not associated with a clinically meaningful detriment in general HRQoL or cystectomy-specific HRQoL!! @OncoAlert @myESMO @GuardConsortium @DrChoueiri @tompowles1 @urotoday @PGrivasMDPhD
1) Biomarker data: Presurgery ctDNA+ Predicts Low pCR, Any Regimen — pCR · 2) Biomarker data: ctDNA Clearers Fare Better With Perioperative EV + Pembro — EFS · 3) Biomarker data: Perioperative EV + pembro with serial ctDNA assessment
KEYNOTE-B15 ctDNA analysis presented by Jonathan Chatzkel at #ESMO26, with Min Teo as discussant 🧬 In cisplatin-eligible MIBC, ctDNA+ before surgery meant almost no pCR with either regimen (3.7% with EV + pembro, 2.2% with cis/gem). Among ctDNA− patients, pCR was 72.4% with EV + pembro vs 43.7% with cis/gem. In the EV + pembro arm, patients who cleared ctDNA had 24-month EFS of 81% vs 33% with persistent ctDNA+. The postsurgery results replicate NIAGARA. Serial ctDNA could open the door to bladder-sparing and surveillance questions. #MRD #ctDNA #BladderCancer
🚨⭐🟠 #ESMO26 | Abstract 4734O | KEYNOTE-B15 / EV-304
ctDNA Analysis of the Phase III KEYNOTE-B15 Trial: Neoadjuvant and Adjuvant Enfortumab Vedotin + Pembrolizumab in Cisplatin-Eligible Muscle-Invasive Bladder Cancer
🎤 Presented by Jonathan Chatzkel 🇺🇸 | Moffitt Cancer Center
@OncoAlert @urologysummit
🧬 Can molecular response help redefine perioperative treatment in MIBC?
🔬 STUDY DESIGN
Phase III KEYNOTE-B15/EV-304 | N=808
🟢 Perioperative EV + pembrolizumab (n=405)
🔴 Neoadjuvant gemcitabine/cisplatin followed by observation (n=403)
All patients underwent planned radical cystectomy + PLND.
Exploratory ctDNA analysis using the tumor-informed Signatera assay at baseline, presurgery, postsurgery and during adjuvant treatment.
📊 KEY RESULTS
🧬 1️⃣ Baseline ctDNA: a powerful prognostic marker
ctDNA positivity was associated with worse EFS.
EV + pembrolizumab vs chemotherapy:
✅ Baseline ctDNA-positive:
HR 0.54 (95% CI 0.37–0.80)
✅ Baseline ctDNA-negative:
HR 0.68 (95% CI 0.37–1.26)
📌 EFS estimates favored EV + pembrolizumab in both subgroups, although the CI crossed 1 in ctDNA-negative patients.
🧬 2️⃣ ctDNA CLEARANCE BEFORE SURGERY
✅ EV + pembrolizumab: 82.1%
🔴 Gemcitabine/cisplatin: 66.7%
📈 Absolute difference: +15.4 percentage points.
Molecular clearance was associated with more favorable EFS and pathological response.
🔬 3️⃣ pCR BY PRESURGICAL ctDNA STATUS
Among patients who were ctDNA-negative before surgery:
✅ EV + pembrolizumab: 72.4%
🔴 Gemcitabine/cisplatin: 43.7%
Among those remaining ctDNA-positive:
• EV + pembrolizumab: 3.7%
• Chemotherapy: 2.2%
📌 Persistent ctDNA positivity identified patients with a very low probability of pCR.
🧬 4️⃣ POSTSURGICAL ctDNA AND EFS
EV + pembrolizumab vs chemotherapy:
✅ ctDNA-negative:
HR 0.48 (95% CI 0.29–0.81)
🔹 ctDNA-positive:
HR 0.63 (95% CI 0.30–1.35)
Postoperative ctDNA positivity was associated with particularly poor EFS.
⚠️ Interpretation requires caution: the postsurgical ctDNA-positive subgroup was small, and sample availability decreased over time.
🔬 CONCLUSIONS
✅ ctDNA positivity identifies patients with poorer prognosis.
✅ ctDNA clearance was higher with EV + pembrolizumab than with cisplatin-based chemotherapy.
✅ Molecular clearance correlated with improved pathological response and EFS.
✅ EFS estimates favored EV + pembrolizumab across ctDNA-defined groups.
⭐ MY POINT OF VIEW | CLINICAL PEARL
We are moving beyond pathological response toward molecular assessment of treatment effectiveness.
🧬 ctDNA could become an essential tool for perioperative risk stratification in MIBC.
But an important distinction remains:
Prognostic ≠ Predictive.
These findings do not yet establish ctDNA as a biomarker for selecting EV + pembrolizumab, omitting cystectomy or safely de-escalating adjuvant therapy.
💡 The next breakthrough may not be another treatment combination, but learning how to personalize treatment intensity according to molecular response.
📌 Prospective ctDNA-guided trials will be essential to translate molecular clearance into clinical decisions.
🌍⭐ GU ONCOLOGY COMMUNITY
@brian_rini @tompowles1 @declangmurphy @KidneyCancer @salvolarosa @RenuEapen @seanmcbride @DrJaVallejo @crisbergerot @DrDanielHeng @apolo_andrea @DrChoueiri @PGrivasMDPhD @TiansterZhang @HHammersMD @neerajaiims @amerseburger @sonpavde @drenriquegrande @scserendipity1 @Silke_Gillessen @EfstathiouEleni @BraunMDPhD @cdanicas @AOmlin @montypal
@gbanna74 @ravikanesvaran @Uromigos @gu_onc
@ecancer @UrologyTimes @urotoday @wearemedsir @OpenMedicineHQ @UCSFCancer
#BladderCancer #MIBC #ctDNA #GUOncology #PrecisionOncology #OncoAlertAF
1) Slide: KEYNOTE-B15 HRQoL: Change from baseline to postsurgery week 42 · 2) Slide: KEYNOTE-B15 HRQoL: Change from baseline to postsurgery week 42 in BCI · 3) Slide: KEYNOTE-B15 HRQoL: Empirical mean change from baseline over time · 4) Slide: KEYNOTE-B15 HRQoL: Time to definitive deterioration in EORTC QLQ-C30
#ESMO26 KEYNOTE-B15 HRQoL results further support perioperative EVP in MIBC
No clinically meaningful differences in HRQoL despite improved EFS and OS. The greatest deterioration occurred in both arms after surgery (sexual dysfunction)
Congrats @Uro_Oncologist!
@OncoAlert https://t.co/kPW3DFTBMv
[Slide 1]
Change From Baseline to Postsurgery Week 42 in EORTC QLQ-C30 Scores
Legend: EV + Pembro | Cis + Gem
Y-axis: LS Mean Change From Baseline (95% CI)
GHS/QoL: LS mean difference 0.85 (95% CI, −1.74 to 3.44)
EV + Pembro −1.58 (−3.54 to 0.38); Cis + Gem −2.43 (−4.45 to −0.41)
Physical Functioning: LS mean difference 0.86 (95% CI, −1.73 to 3.45)
EV + Pembro −5.42 (−7.24 to −3.61); Cis + Gem −6.28 (−8.16 to −4.40)
Role Functioning: LS mean difference −0.21 (95% CI, −4.31 to 3.88)
EV + Pembro −9.56 (−12.50 to −6.63); Cis + Gem −9.35 (−12.40 to −6.31)
IMPROVEMENT / DECLINE; dotted line at −10 marked a
Baseline n = 383 / n = 368 (each domain)
Week 42 n = 250 / n = 227 (each domain)
Total PRO N = 403 / N = 394 (each domain)
aMinimal important difference, ≥10 point worsening from baseline. 'n' is the number of participants in each treatment group with nonmissing assessments at the specific time point; for change from baseline, 'N' is the number of participants in the analysis population in each treatment group. Database cutoff: October 27, 2025.
[Slide 2]
Change From Baseline to Postsurgery Week 42 in BCI Scores
Legend: EV + Pembro | Cis + Gem
Y-axis: LS Mean Change From Baseline (95% CI)
BCI Urinary: LS mean difference 2.74 (95% CI, −0.15 to 5.63)
EV + Pembro −0.77 (−3.02 to 1.48); Cis + Gem −3.51 (−5.81 to −1.21)
Baseline n = 379 / n = 362; Week 42 n = 245 / n = 227; Total PRO N = 402 / N = 394
BCI Bowel: LS mean difference 0.20 (95% CI, −2.16 to 2.57)
EV + Pembro −1.86 (−3.63 to −0.10); Cis + Gem −2.07 (−3.88 to −0.25)
Baseline n = 379 / n = 362; Week 42 n = 245 / n = 227; Total PRO N = 402 / N = 394
BCI Sexual: LS mean difference −0.31 (95% CI, −3.77 to 3.15)
EV + Pembro −15.13 (−17.79 to −12.46); Cis + Gem −14.82 (−17.57 to −12.06)
Baseline n = 378 / n = 356; Week 42 n = 241 / n = 220; Total PRO N = 401 / N = 390
IMPROVEMENT / DECLINE; dotted MID lines marked a and b
aMinimal important difference for BCI urinary, ≥6 point worsening from baseline. bMinimal important difference for BCI bowel and sexual, ≥7 point worsening from baseline. 'n' is the number of participants in each treatment group with non-missing assessments at the specific time point; for change from baseline, 'N' is the number of participants in the analysis population in each treatment group. Database cutoff: October 27, 2025.
[Slide 3]
Empirical Mean Change From Baseline Over Time in EORTC QLQ-C30 Scores
Legend: EV + Pembro | Cis + Gem
Panels: GHS/QoL; Physical Functioning; Role Functioning (Improvement / Decline arrows); shaded SURGERY band
Y-axis: Mean Change From Baseline (95% CI)
X-axis weeks: 0 2 4 5 7 8 10 11 13 (Presurgery Week) | 9 18 30 42 54 66 78 90 102 126 150 174 198 (Postsurgery Week)
No. (EV + Pembro): 383 354 300 314 289 299 285 290 308 | 289 257 242 241 232 218 208 195 153 114 74 46 17
No. (Cis + Gem): 368 331 289 304 291 319 293 283 316 | 295 234 224 213 202 184 183 167 135 90 51 29 12
(Physical Functioning row: Cis + Gem week 5 = 305; Role Functioning rows: EV + Pembro week 4 = 300, Cis + Gem week 4 = 289, week 5 = 305)
Database cutoff: October 27, 2025.
[Slide 4]
Kaplan-Meier Estimates of Time to Definitive Deterioration in EORTC QLQ-C30 and BCI Scores
Columns: Events, n/N (%) EV + Pembro | Cis + Gem; TTD, median (95% CI), months EV + Pembro | Cis + Gem; HR (95% CI)
EORTC QLQ-C30
GHS/QoL | 79/383 (20.6) | 84/368 (22.8) | NR (NR-NR) | NR (NR-NR) | 0.84 (0.61-1.14)
Physical functioning | 92/383 (24.0) | 94/368 (25.5) | NR (NR-NR) | NR (NR-NR) | 0.88 (0.66-1.18)
Role functioning | 108/383 (28.2) | 121/368 (32.9) | NR (NR-NR) | NR (37.1-NR) | 0.80 (0.61-1.04)
BCI
Urinary | 94/379 (24.8) | 91/362 (25.1) | NR (NR-NR) | NR (NR-NR) | 0.93 (0.70-1.25)
Bowel | 101/379 (26.6) | 82/362 (22.7) | NR (NR-NR) | NR (43.1-NR) | 1.11 (0.83-1.49)
Sexual | 173/378 (45.8) | 139/356 (39.0) | 25.5 (18.9-33.5) | 44.3 (24.7-NR) | 1.17 (0.94-1.47)
HR (95% CI) axis 0.0 0.5 1.0 1.5 2.0; Favors EV + Pembro / Favors Cis + Gem
Participants with no definitive deterioration were censored at last PRO assessment regardless of PD or recurrence. Participants who did not have postbaseline PRO assessment were censored at baseline. Database cutoff: October 27, 2025.
1) Slide: KEYNOTE-B15/EV-304 HRQoL: change to postsurgery week 42 in EORTC · 2) Slide: KEYNOTE-B15/EV-304 HRQoL: change to postsurgery week 42 in BCI urinary · 3) Slide: KEYNOTE-B15/EV-304 HRQoL: empirical mean change over time in EORTC
#ESMO26 The prespecified HRQoL analysis from phase III KEYNOTE-B15/EV-304 was presented:
🔹 Efficacy: EV+P improved EFS (HR 0.53) and OS (HR 0.65) vs neoadjuvant gemcitabine/cisplatin.
🔹 Global QoL at postsurgery week 42: −1.58 vs −2.43 points, with no meaningful between-group difference.
🔹 Physical function: −5.42 vs −6.28 points; role function: −9.56 vs −9.35 points.
🔹 Sexual function: The largest and most persistent deterioration (−15.13 vs −14.82 points), regardless of treatment.
@UroToday @myESMO
[Slide 1]
Change From Baseline to Postsurgery Week 42 in EORTC QLQ-C30 Scores
EV + Pembro | Cis + Gem
LS Mean Change From Baseline (95% CI)
GHS/QoL: LS mean difference 0.85 (95% CI, −1.74 to 3.44)
EV + Pembro −1.58 (−3.54 to 0.38) | Cis + Gem −2.43 (−4.45 to −0.41)
Physical Functioning: LS mean difference 0.86 (95% CI, −1.73 to 3.45)
EV + Pembro −5.42 (−7.24 to −3.61) | Cis + Gem −6.28 (−8.16 to −4.40)
Role Functioning: LS mean difference −0.21 (95% CI, −4.31 to 3.88)
EV + Pembro −9.56 (−12.50 to −6.63) | Cis + Gem −9.35 (−12.40 to −6.31)
Baseline | n = 383 | n = 368 (each domain)
Week 42 | n = 250 | n = 227
Total PRO | N = 403 | N = 394
IMPROVEMENT / DECLINE
[Slide 2]
Change From Baseline to Postsurgery Week 42 in BCI Scores
EV + Pembro | Cis + Gem
LS Mean Change From Baseline (95% CI)
BCI Urinary: LS mean difference 2.74 (95% CI, −0.15 to 5.63)
EV + Pembro −0.77 (−3.02 to 1.48) | Cis + Gem −3.51 (−5.81 to −1.21)
Baseline n = 379 | n = 362; Week 42 n = 245 | n = 227; Total PRO N = 402 | N = 394
BCI Bowel: LS mean difference 0.20 (95% CI, −2.16 to 2.57)
EV + Pembro −1.86 (−3.63 to −0.10) | Cis + Gem −2.07 (−3.88 to −0.25)
Baseline n = 379 | n = 362; Week 42 n = 245 | n = 227; Total PRO N = 402 | N = 394
BCI Sexual: LS mean difference −0.31 (95% CI, −3.77 to 3.15)
EV + Pembro −15.13 (−17.79 to −12.46) | Cis + Gem −14.82 (−17.57 to −12.06)
Baseline n = 378 | n = 356; Week 42 n = 241 | n = 220; Total PRO N = 401 | N = 390
IMPROVEMENT / DECLINE
[Slide 3]
Empirical Mean Change From Baseline Over Time in EORTC QLQ-C30 Scores
EV + Pembro | Cis + Gem
Mean Change From Baseline (95% CI)
Panels: GHS/QoL; Physical Functioning; Role Functioning (SURGERY marked between presurgery week 13 and postsurgery week 9)
Weeks: 0 2 4 5 7 8 10 11 13 (Presurgery Week) | 9 18 30 42 54 66 78 90 102 126 150 174 198 (Postsurgery Week)
No. EV + Pembro: 383 354 300 314 289 299 285 290 308 | 289 257 242 241 232 218 208 195 153 114 74 46 17
No. Cis + Gem: 368 331 289 304 291 319 293 283 316 | 295 234 224 213 202 184 183 167 135 90 51 29 12
(Physical Functioning row: Cis + Gem week 5 = 305 per panel; other panels show 304)
Database cutoff: October 27, 2025.
1) Trial design schema: KEYNOTE-B15/EV-304 study design with ctDNA · 2) Kaplan-Meier survival data: KEYNOTE-B15/EV-304: KM estimates of EFS · 3) Kaplan-Meier survival data: KEYNOTE-B15/EV-304: KM estimates of EFS
#ESMO26 Exploratory ctDNA findings from phase III KEYNOTE-B15, comparing perioperative EV+pembrolizumab vs cisplatin/gemcitabine.
Key findings:
📌Presurgical ctDNA clearance: 82.1% vs 66.7%
📌24-month EFS after ctDNA clearance: 81.1% vs 63.2%
📌Persistent ctDNA positivity: 24-month EFS only ~33–35%
📌Postsurgical ctDNA positivity: Only 10% event-free at 24 months in either arm
📌Presurgical ctDNA-negative patients: pCR 72.4% vs 43.7%
@UroToday @myESMO
Interesting ctDNA analysis from #EV304/B15 trial — ctDNA (+) groups w poor prognosis but EV-pembro works regardless of ctDNA status
@myESMO #ESMO26 @oncoalert https://t.co/CoJhNDucjN
Biomarker data: KEYNOTE-B15/EV-304: KM EFS per BICR by ctDNA status at postsurgery
Exploratory ctDNA analysis from #KNB15 #ESMO26
🧬 ctDNA status is strongly prognostic: ctDNA-negative status (baseline/postsurgery) ass w/ improved EFS & pCR
💊 Presurgery ctDNA clearance was higher with EVP vs GC
📈 Periop EVP achieved favorable EFS regardless of ctDNA status https://t.co/5i26zRIYL0
Biomarker data: KEYNOTE-B15/EV-304: KM EFS per BICR by ctDNA status at postsurgery
KEYNOTE-B15 ctDNA analysis, cis-eligible MIBC: EV plus pembro cleared ctDNA more often than cis-gem.
📈 Presurgery ctDNA negative: pCR 72.4% vs 43.7%
📊 24-month EFS if cleared 81.1% vs 63.2%, if ctdna persistent 33.3% vs 35.3%
🔍 Presurgery ctDNA positive: pCR only in 2 of 72 across both arms
ctDNA is prognostic in both arms. Persistent positivity does poorly on either regimen, and know seeing trial designs to address.
#ESMO26 #BladderCancer #MIBC #ctDNA #GUonc
1) Biomarker data: Title slide: ctDNA Analysis of the Phase 3 KEYNOTE-B15 Trial · 2) Biomarker data: Pre-Treatment and Presurgery ctDNA Predict Outcome — KEYNOTE-B15 · 3) Biomarker data: Higher pCR With EV + Pembro Even Among ctDNA− Patients — pCR · 4) Biomarker data: Postsurgery ctDNA Findings Replicate NIAGARA
More from the B15 ctDNA analysis: pre-treatment and presurgery ctDNA both predicted EFS, consistent with NIAGARA and Christensen 2019, and postsurgery ctDNA+ again identified the highest-risk group. #ESMO26 https://t.co/HdByxX6ZKQ
1) Biomarker data: KEYNOTE-B15 ctDNA-evaluable population by arm and time point · 2) Biomarker data: KEYNOTE-B15 pre- and on-treatment ctDNA positivity by arm
KEYNOTE-B15 ctDNA Analysis: Perioperative Enfortumab Vedotin + Pembrolizumab in Cisplatin-Eligible #MIBC. Presented by Jonathan Chatzkel, MD @MoffittNews. #ESMO26 written coverage by @chavarriagaj @PSH_Urology > https://t.co/WCCuF4jwoA #BladderCancer #PrecisionOncology @myESMO https://t.co/bJm3Y1rIHx
Trial design schema: KEYNOTE-B15/EV-304 study design and primary results recap
HRQoL with Perioperative Enfortumab Vedotin + Pembrolizumab in Cisplatin-Eligible #MIBC: Phase 3 KEYNOTE-B15. Presented by Dr. Alfonso Gomez de Liaño Lista, #ESMO26 written coverage by @chavarriagaj > https://t.co/HLsw6Uy5zw #BladderCancer #MIBC @myESMO https://t.co/gEiilcLmas
KEYNOTE-B15/EV-304 Study (NCT04700124)
Key Eligibility Criteria
• Adults with MIBC
• Clinical stage T2-T4aN0M0 or T1-T4aN1M0 by central assessment
• Urothelial histology ≥50%
• Eligible for RC + PLND
• Did not meet any Galsky criteria for cisplatin ineligibility
• ECOG PS score of 0 or 1
R 1:1
N = 405: Enfortumab vedotin 1.25 mg/kg d1 and d8 IV Q3W 4 cycles + Pembrolizumab 200 mg d1 IV Q3W 4 cycles → RC + PLND → Enfortumab vedotin 1.25 mg/kg d1 and d8 IV Q3W 5 cycles + Pembrolizumab 200 mg d1 IV Q3W 13 cycles
N = 403: Cisplatin 70 mg/m² d1 IV Q3W 4 cycles + Gemcitabine 1000 mg/m² d1 and d8 IV Q3W 4 cycles → RC + PLND → Observation^b
Stratification Factors
• PD-L1 status (CPS ≥10 vs <10)^a
• Clinical stage (T2N0 vs T3/T4aN0 vs T1-T4aN1)
• Geographic region (US vs EU vs most of world)
• Primary results from KEYNOTE-B15 showed neoadjuvant + adjuvant enfortumab vedotin + pembrolizumab and RC + PLND significantly improved EFS (HR, 0.53 [95% CI, 0.41-0.70]; P < 0.001), OS (HR, 0.65 [95% CI, 0.48-0.89]; 2-sided P = 0.006), and pCR (P < 0.001) vs neoadjuvant chemotherapy followed by RC + PLND in cisplatin-eligible participants with MIBC¹
• The safety profile of enfortumab vedotin + pembrolizumab and RC + PLND was consistent with prior reports¹
• Results from the prespecified analysis of HRQoL are presented
1) Slide: Perioperative EV + pembro vs cis + gem: PRO analyses methods and assessment · 2) Slide: Empirical mean change from baseline over time in EORTC QLQ-C30 scores, EV +
#KEYNOTE-B15 #HRQoL analysis: Perioperative #EV/#pembro showed #comparable #QoL to gem/cis in MIBC, with no clinically meaningful differences in global QoL, physical functioning, or urinary/bowel/sexual outcomes. Reassuring QoL data alongside improved EFS & OS. @OncoAlert #ESMO26 https://t.co/MfdVFmIpXA
[Slide 1]
Patient-Reported Outcome (PRO) Analyses
• HRQoL was assessed by validated cancer-specific PRO questionnaires
• Prespecified secondary PRO end points (not multiplicity controlled):
– Change from baseline to postsurgery week 42^a and time to definitive deterioration^b in:
▪ European Organisation for Research & Treatment of Cancer (EORTC) Quality of Life Questionnaire-Core 30 (QLQ-C30): global health status/QoL (GHS/QoL), physical, and role functioning scores
▪ Bladder Cancer Index (BCI) urinary, bowel, and sexual scores
• PRO analysis population: all randomly allocated participants with ≥1 PRO assessment available for the specific end point and who received ≥1 dose of the study treatment
PRO assessment schedule
Neoadjuvant treatment (days 1 and 8 of each 21-day cycle) | Presurgery visit | RC + PLND | Postsurgery phase - adjuvant EV + pembro or observation (on day 1 of each 21-day cycle)
Week: 0, 2 | 4, 5 | 7, 8 | 10, 11 | 13 | 0 | 9^c | 12 | 18 | 30 | 42 | 54 | Y2 Q12W | Y3 Q24W
EV + pembro: X, X | X, X | X, X | X, X | X | | X | X | X | X | X | X | X | X
Cis + gem: X, X | X, X | X, X | X, X | X | | X | | X | X | X | X | X | X
^a Time point where PRO completion and compliance rates were ~60% and ~80%, respectively, based on blinded data. ^b Defined as the first onset of deterioration confirmed at a subsequent assessment and persistent at all subsequent visits without recovery. ^c The 6-week postsurgery visit could be combined with the first adjuvant treatment cycle visit (week 9 post-surgery). Median time from randomization to database cutoff: 33.6 months (range, 22.5-53.6). Database cutoff: October 27, 2025.
[Slide 3]
Empirical Mean Change From Baseline Over Time in EORTC QLQ-C30 Scores
[Three line-plot panels: GHS/QoL, Physical Functioning, Role Functioning; Mean Change From Baseline (95% CI); EV + Pembro (teal) vs Cis + Gem (maroon); shaded SURGERY band; Improvement / Decline arrows]
Presurgery Week: 0 2 4 5 7 8 10 11 13 | Postsurgery Week: 9 18 30 42 54 66 78 90 102 126 150 174 198
No. (EV + Pembro): 383 354 300 314 289 299 285 290 308 | 289 257 242 241 232 218 208 195 153 114 74 46 17
No. (Cis + Gem), GHS/QoL panel: 368 331 289 304 291 319 293 283 316 | 295 234 224 213 202 184 183 167 135 90 51 29 12
No. (Cis + Gem), Physical and Role Functioning panels: 368 331 289 305 291 319 293 283 316 | 295 234 224 213 202 184 183 167 135 90 51 29 12
Database cutoff: October 27, 2025.
Well well well…
This was certainly my favorite RCC / kidney cancer presentation and heralding a significant shift in the RCC landscape!
45% response in heavily pretreated pts. Highly impressive!
Needs to move into frontline combinations! Congrats @montypal + colleagues https://t.co/Did7JbvAES
What did XmAb819 achieve? A strong efficacy signal in general and in particular for a strategy that is immunotherapy alone
Among the highest single-agent response rates (cross-trial comparison)
How well it worked
Confirmed or RECIST ORR, %
Single agents
XmAb819 · 400 µg/kg | 45.5
XmAb819 · 200 µg/kg | 44.0
LITESPARK-011 · Cabozantinib * | 40.2
Casdatifan 100 mg | 35.0
XmAb819 · 100 µg/kg | 30.0
Belzutifan | 22.7
ALLO-316 | 17.4
Combinations
LITESPARK-011 · Belz + len * | 52.6
KM-U03 · Belz + lenvatinib | 50.0
Pembro + lenvatinib | 43.8
Pembro + quavonlimab | 30.0
Pembro + belzutifan | 22.6
Pembro + favezelimab | 0.0
Pembro + MK-4830 | 0.0
Responses are frequent
30–45%, three quarters still ongoing
Depth takes time
one CR so far – it took 42 weeks
Pal SK et al., ESMO 2026, abstract [illegible]. * LITESPARK-011 (Motzer RJ et al., Lancet 2025; second interim analysis, by blinded independent central review): belzutifan + lenvatinib 14.8 vs cabozantinib 10.7 months, HR 0.70 [illegible]; ORR 52.6% vs 40.2%; CR [illegible]. [illegible] Cross-trial comparison.
Manuela Schmidinger, Medical University of Vienna, Austria
1) Trial design schema: study design (screenshot) — ESMO 2026 · 2) Kaplan-Meier survival data: final analysis: PFS per RECIST 1.1 by BICR KM curve · 3) Kaplan-Meier survival data: final analysis: OS KM curve (screenshot) — ESMO 2026 · 4) Response data: final analysis: ORR (key secondary) and DOR by BICR (screenshot)
Longer follow up of LS-11 showed lenvatinib/belzutifan vs cabozantinib did not reach significant OS HR 0.85 (0.70-1.03). #ESMO26 Other endpoints of RR (54%) and DFS (HR 0.75) remain positive and impressive. TRAEs are 73% vs 66%. This is the most robust 2nd line strategy IMO, as many patients don’t make it to 3rd line. Nevertheless the lack of OS means other sequencing strategies seem reasonable. @DrDanielHeng @OncoAlert
1) Kaplan-Meier survival data: OS: belzutifan + lenvatinib vs cabozantinib · 2) Slide: Should HIF-2α inhibitors be used alone or in combination with VEGFR-TKI? · 3) Slide: Does casdatifan have a distinct activity? PFS, response and anemia data · 4) Biomarker data: Does casdatifan have a distinct activity? Serum EPO
Excellent overview by @AlbigesL on HIF-2α inhibition in RCC at #ESMO26!
• LITESPARK-011: belzutifan + lenvatinib improved ORR/PFS, but not OS
• Optimal combinations & sequencing remain unclear
• Casdatifan: promising activity (ORR 35%)
• Serum EPO: potential response biomarker
@myESMO @oncoalert
1) Slide: HRQoL vs efficacy title slide (Daniel Heng, ESMO 2026) · 2) Slide: association between baseline/longitudinal PRO scores and PFS/OS (forest table)
Thought-provoking presentation by @DrDanielHeng ! LITESPARK-011: better baseline quality of life was associated with longer PFS and OS in an exploratory analysis of 741 patients. Another reason to keep patient-reported outcomes central! #ESMO26 @oncoalert @myESMO https://t.co/G5aW8OQQkB
[Slide 1]
MADRID 2026 ESMO congress
Relationship Between Health-Related Quality of Life and Efficacy in LITESPARK-011: Belzutifan Plus Lenvatinib Versus Cabozantinib in Advanced Clear Cell Renal Cell Carcinoma After Anti–PD-(L)1 Therapy
Daniel Y. C. Heng1; Se Hoon Park2; Hernan J. Cutuli3; Arun Azad4; Sylvie Rottey5; Manuela Schmidinger6; Mauricio Burotto7; Michel Pavic8; Masatoshi Eto9; Camillo Porta10; Ray Manneh Kopp11; Guillermo de Velasco12; Elena Verzoni13; Robert A. Figlin14; Todd L. Saretsky15; Erin H. Jensen15; Rodolfo F. Perini15; Donna Vickery15; Robert J. Motzer16
1Arthur J.E. Child Comprehensive Cancer Centre, Calgary, AB, Canada; 2Samsung Medical Center, Sungkyunkwan University School of Medicine, Seoul, Republic of Korea; 3Uro-Oncology Research Unit, Hospital Sirio Libanês, Buenos Aires, Argentina; 4Peter MacCallum Cancer Centre, Melbourne VIC, Australia; 5Ghent University Hospital, Ghent, Belgium; 6Medical University of Vienna, Vienna, Austria; 7Bradford Hill Clinical Research Center, Santiago, Chile; 8Centre Hospitalier Universitaire de Sherbrooke, Sherbrooke, QC, Canada; 9Kyushu University Hospital, Fukuoka, Japan; 10University of Bari "A. Moro" and A.O.U. Consorziale Policlinico Di Bari, Bari, Italy; 11Sociedad de Oncología y Hematología del Cesar S.A.S., Valledupar, Colombia; 12University Hospital 12 de Octubre, Madrid, Spain; 13Istituto Nazionale dei Tumori, Milano, Italy; 14Cedars Sinai Cancer, Cedars Sinai Medical Center, Los Angeles, CA, USA; 15Merck & Co., Inc., Rahway, NJ, USA; 16Memorial Sloan Kettering Cancer Center, New York, NY, USA
[Slide 2]
Association Between Baseline and Longitudinal PRO Scores and PFS and OS
PFS | Events/Participants | HR (95% CI)a
Baseline modelb
FKSI-DRS: Pooled arms 434/633 0.86 (0.81-0.91); Belz + len 197/318 0.84 (0.77-0.92); Cabo 237/315 0.87 (0.79-0.95)
QLQ-C30 GHS/QoL: Pooled arms 426/621 0.90 (0.86-0.94); Belz + len 192/311 0.88 (0.83-0.95); Cabo 234/310 0.90 (0.84-0.97)
Longitudinal modelc
FKSI-DRS: Pooled arms 400/633 0.82 (0.76-0.89); Belz + len 175/318 0.81 (0.70-0.93); Cabo 225/315 0.83 (0.75-0.92)
QLQ-C30 GHS/QoL: Pooled arms 393/621 0.92 (0.86-0.99); Belz + len 171/311 0.89 (0.80-0.99); Cabo 222/310 0.93 (0.84-1.04)
HR for progression or death reduces as PRO score increases
OS | Events/Participants | HR (95% CI)a
Baseline modelb
FKSI-DRS: Pooled arms 355/640 0.81 (0.77-0.86); Belz + len 164/319 0.83 (0.76-0.91); Cabo 191/321 0.74 (0.68-0.82)
QLQ-C30 GHS/QoL: Pooled arms 347/628 0.88 (0.83-0.92); Belz + len 159/312 0.91 (0.85-0.99); Cabo 188/316 0.83 (0.78-0.90)
Longitudinal modelc
FKSI-DRS: Pooled arms 130/640 0.57 (0.52-0.62); Belz + len 62/319 0.51 (0.44-0.59); Cabo 68/321 0.58 (0.52-0.66)
QLQ-C30 GHS/QoL: Pooled arms 127/628 0.68 (0.62-0.74); Belz + len 60/312 0.65 (0.57-0.73); Cabo 67/316 0.69 (0.60-0.80)
HR for death reduces as PRO score increases
aPer Cox proportional hazards model. HR was calculated as risk of event per 3-point (FKSI-DRS) or 10-point (QLQ-C30 GHS/QoL) increase from the baseline score. bIncluded randomization stratification factors as categorical terms and baseline HRQoL scores as a continuous covariate. cIncluded randomization stratification factors as categorical terms and baseline HRQoL scores and changes from baseline HRQoL scores assessed after randomization visits as continuous covariates. Data cutoff date: PFS, April 9, 2025 (IA2); OS, February 2, 2026.
Slide: final analysis: PFS by BICR in key subgroups forest plot (Daniel Heng)
Great presentation by @DrDanielHeng at #ESMO26 on #LITESPARK11. Congrats on simultaneous publication of the data in @Annals_Oncology! It’s a high bar to advance therapies in the 2nd line setting. I tend to still favor monotherapy for most - have had challenges with Len 20 & also want to understand more about the cardiac tox. Still, always eager to have more options to discuss with my patients! @OncoAlert
Kaplan-Meier survival data: Figure 1: PFS, OS, DOR (ITT)
🚨 #ESMO26 | LITESPARK-011: Better PFS, nearly DOUBLE response duration, but NO OS win!
Concomitant publication in Annals of Oncology.
Phase III | Post-immunotherapy advanced ccRCC | N=747
Belzutifan + lenvatinib vs cabozantinib
📊 PFS: 14.8 vs 10.8 months (HR 0.74)
🎯 ORR: 53.1% vs 40.2%
🔥 Response duration: 22.0 vs 11.9 months
⚠️ OS: 33.7 vs 28.6 months (HR 0.85), NOT statistically significant.
Verdict: A compelling post-ICI option, but improved disease control has not translated into a proven survival advantage. Anemia and hypoxia remain important trade-offs.
@myesmo @ESMO_open @ASCO @oncoalert #ESMO26 #KidneyCancer
1) Slide: final analysis title slide and author list — Daniel Y.C. Heng, ESMO 2026 · 2) Slide: final analysis: summary and conclusions — Heng, ESMO 2026
Cabo has been the preferred 2nd line therapy for many years in mRCC
Today, @DrDanielHeng shows that Bel + Len can offer improved significantly PFS and ORR!
#ESMO26 @OncoAlert https://t.co/MqbDEPnavQ
[Slide 1]
Final Analysis of the Phase 3 LITESPARK-011 Study: Belzutifan Plus Lenvatinib Versus Cabozantinib for Advanced Renal Cell Carcinoma After Anti–PD-(L)1 Therapy
Daniel Y.C. Heng1, Ray McDermott2, Se Hoon Park3, Manuela Schmidinger4, Mauricio Burotto5, Roberto Iacovelli6, Elena Verzoni7, Cristina Suárez8, Masatoshi Eto9, Hernan J. Cutuli10, Camillo Porta11, Ray Manneh Kopp12, Sylvie Rottey13, Guillermo de Velasco14, Begoña P. Valderrama15, Ugo De Giorgi16, Alessandro Vagheggini17, Rodolfo F. Perini18, Donna Vickery18, Robert J. Motzer19
1Arthur J. E. Child Comprehensive Cancer Centre, Calgary, AB, Canada; 2St. Vincent's University Hospital, Cancer Trials Ireland, Dublin, Ireland; 3Samsung Medical Center, Sungkyunkwan University School of Medicine, Seoul, Republic of Korea; 4Medical University of Vienna, Vienna, Austria; 5Bradford Hill Clinical Research Center, Universidad Finis Terrae Santiago, Chile; 6Fondazione Policlinico Universitario Agostino Gemelli, IRCCS, Rome, Italy; 7Fondazione IRCCS Istituto Nazionale dei Tumori di Milano, Genitourinary Medical Oncology, Milan, Italy; 8Vall d'Hebron Institute of Oncology (VHIO), Vall d'Hebron University Hospital, Vall d'Hebron Barcelona Hospital Campus, Barcelona, Spain; 9Kyushu University, Graduate School of Medical Sciences, Fukuoka, Japan; 10Hospital Sirio Libanés, Buenos Aires, Argentina; 11Azienda Ospedaliero-Universitaria Consorziale Policlinico di Bari and University of Bari "A. Moro," Bari, Italy; 12Sociedad de Oncología y Hematología del Cesar, Valledupar, Colombia; 13Ghent University Hospital, Ghent, Belgium; 14Department of Medical Oncology, University Hospital 12 de Octubre, Instituto de Investigación (imas12), Madrid, Spain; 15Hospital Universitario Virgen del Rocío, Seville, Spain; 16IRCCS Istituto Romagnolo per lo Studio dei Tumori (IRST) Dino Amadori, Meldola, Italy; 17MSD Innovation & Development GmbH, Zurich, Switzerland; 18Merck & Co., Inc., Rahway, NJ, USA; 19Memorial Sloan Kettering Cancer Center, New York, NY, USA
[Slide 4]
Summary and Conclusions
• Belzutifan + lenvatinib demonstrated continued PFS and ORR benefit versus cabozantinib at the final analysis of the phase 3 LITESPARK-011 study
• OS numerically favored belzutifan + lenvatinib at final analysis but was not statistically significant; PFS2 also favored the combination arm
• Belzutifan + lenvatinib improved PFS, OS, ORR, and DOR versus cabozantinib across prior 1L IO + IO or IO + TKI subgroups in exploratory analyses
• Safety was generally consistent with previous analyses
• These results continue to support the use of belzutifan + lenvatinib in participants with advanced clear cell RCC following anti–PD-(L)1 therapy
Response data: final analysis - ORR (key secondary)
@DrDanielHeng w #LITESPARK011 follow-up — Lenvatinib-belzutifan vs cabozantinib met PFS endpoint and also better for PFS2, just misses on OS. Durable responses. Lenvatinib belzutifan approved in US — another line in the IO refractory setting.
@oncoalert #ESMO26 @myesmo https://t.co/p8dOqHsP38
1) Slide: HIF2a inhibition and RCC in VHL disease: LITESPARK-004 proof of concept · 2) Response data: Belzutifan single-agent approval: LITESPARK-005 PFS and ORR · 3) Kaplan-Meier survival data: Belzutifan in combination: LITESPARK-022
#ESMO26 From transforming the management of VHL-associated RCC to expanding treatment options in advanced ccRCC, HIF-2α inhibition has come a long way. An excellent tour de force by Dr. Albiges on how far we've come and what lies ahead:
🔹 LITESPARK-005: Established belzutifan as a later-line option in advanced ccRCC.
🔹 LITESPARK-011: Belzutifan + lenvatinib improved PFS and ORR; OS remains immature.
🔹 Adjuvant setting: Belzutifan + pembrolizumab has demonstrated improved DFS.
🔹 Next frontier: LITESPARK-034 and other trials are evaluating the optimal TKI partner.
📌The biology is compelling, but optimal sequencing, combination partners, resistance, and patient selection remain unresolved.
@UroToday @myESMO
Slide: final analysis title slide on stage screen — Daniel Y.C. Heng, ESMO 2026
#ESMO26 | LITESPARK-011 in advanced RCC Belzutifan + lenvatinib vs cabozantinib after IO :
No significant OS benefit (HR 0.85; p=0.0469; prespecified one-sided boundary 0.0223), the primary OS endpoint was not met. @SCUColombia @achoHematoYOnco @myESMO @ASCO @OncoAlert @oncodaily https://t.co/wEA7A24HWv
Final Analysis of the Phase 3 LITESPARK-011 Study: Belzutifan Plus Lenvatinib Versus Cabozantinib for Advanced Renal Cell Carcinoma After Anti–PD-(L)1 Therapy
Daniel Y.C. Heng1, Ray McDermott2, Se Hoon Park3, Manuela Schmidinger4, Mauricio Burotto5, Roberto Iacovelli6, Elena Verzoni7, Cristina Suárez8, Masatoshi Eto9, Hernan J. Cutuli10, Camillo Porta11, Ray Manneh Kopp12, Sylvie Rottey13, Guillermo de Velasco14, Begoña P. Valderrama15, Ugo De Giorgi16, Alessandro Vagheggini17, Rodolfo F. Perini18, Donna Vickery18, Robert J. Motzer19
Slide: final analysis title and author slide, Daniel Y.C. Heng presenting, ESMO 2026
LITSPARK-011: PFS and ORR ✅ benefit of bel + len vs cabo was maintained. While OS favored bel + len, it did not ❌ reach statistical significance @DrDanielHeng @myESMO #ESMO26 https://t.co/L72uFSyUQB
Final Analysis of the Phase 3 LITESPARK-011 Study: Belzutifan Plus Lenvatinib Versus Cabozantinib for Advanced Renal Cell Carcinoma After Anti–PD-(L)1 Therapy
Daniel Y.C. Heng1, Ray McDermott2, Se Hoon Park3, Manuela Schmidinger4, Mauricio Burotto5, Roberto Iacovelli6, Elena Verzoni7, Cristina Suárez8, Masatoshi Eto9, Hernan J. Cutuli10, Camillo Porta11, Ray Manneh Kopp12, Sylvie Rottey13, Guillermo de Velasco14, Begoña P. Valderrama15, Ugo De Giorgi16, Alessandro Vagheggini17, Rodolfo F. Perini18, Donna Vickery18, Robert J. Motzer19
[Affiliation list in small print, partially legible: 1Arthur J. E. Child Comprehensive Cancer Centre, Calgary, AB, Canada; 2St. Vincent's University Hospital, Cancer Trials Ireland, Dublin, Ireland; 3Samsung Medical Center, Sungkyunkwan University School of Medicine, Seoul, Republic of Korea; 4Medical University of Vienna, Vienna, Austria; 5Bradford Hill Clinical Research Center, Universidad Finis Terrae Santiago, Chile; ... 18Merck & Co., Inc., Rahway, NJ, USA; 19Memorial Sloan Kettering Cancer Center, New York, NY, USA]
1) Trial design schema: study design (NCT04586231) · 2) Safety data: most common TEAEs (>=15% any arm), as-treated
#ESMO26 LITESPARK-011: Final Ph 3 analysis of belzutifan + lenvatinib vs cabozantinib after prior anti–PD-(L)1 in advanced ccRCC
(n=747)
🔹 PFS benefit maintained: 14.8 vs 10.8 mo; HR 0.74
🔹 ORR: 53.1% vs 40.2%
🔹 CR: 6.7% vs 1.3%
🔹 DOR: 22.0 vs 11.9 mo
🚨 Final OS numerically favored belz+len but not stat sig:
33.7 vs 28.6 mo; HR 0.85 (95% CI 0.70–1.03)
• 36-mo OS: 48.9% vs 40.6%
🔹 Benefit maintained after prior 1L IO+TKI and IO+IO
🔹 PFS2: 28.7 vs 23.4 mo; HR 0.80
Safety consistent with known profiles:
• Anemia: 70.8% vs 27%
• Hypoxia: 15.7% vs 0%
• Diarrhea/PPES more common with cabozantinib
🔑 Durable PFS + response benefit, with a numerical but non-significant OS advantage, continues to support belzutifan + lenvatinib after anti–PD-(L)1 therapy.
@urotoday
Kaplan-Meier survival data: primary endpoint PFS per RECIST 1.1 by BICR, belzutifan +
Final Analysis of the Phase 3 LITESPARK-011 Study: Belzutifan Plus Lenvatinib Versus Cabozantinib for Advanced Renal Cell Carcinoma After Anti–PD-(L)1 Therapy. Presented by @DrDanielHeng. #ESMO26 written coverage by @rksayyid > https://t.co/wWQKspQC4X #KidneyCancer #RCC @myESMO https://t.co/POIbeDUuGC
1) Slide: OS in key subgroups (forest plot) · 2) Response data: ORR and DOR per RECIST 1.1 by BICR
Belzutifan + Lenvatinib vs Cabozantinib in Advanced RCC After Anti–PD-(L)1: Final Analysis of Phase 3 LITESPARK-011. Presented by @DrDanielHeng. #ESMO26 written coverage by @rksayyid @UAUrology > https://t.co/ZOEUcPxRT0 #KidneyCancer #RCC @AHS_CancerCare @myESMO https://t.co/BrybLw0QSA
1) Slide: final analysis: OS in key subgroups (forest plot) — ESMO 2026 · 2) Safety data: final analysis: most common TEAEs (≥15%), as-treated population — ESMO
#LITESPARK011 final analysis: #Belzutifan + #lenvatinib maintained PFS benefit vs cabozantinib (HR 0.74), w higher ORR (53% vs 40%). OS favored the combo but was not statistically significant. AE higher but tolerable. Now FDA-approved post-IO advanced ccRCC! @OncoAlert #ESMO26 https://t.co/WMW7BNRERj
1) Trial design schema: study design (3-arm Ph3, 1L advanced ccRCC) · 2) Kaplan-Meier survival data: PFS by BICR, pembro + len + belz vs pembro + len · 3) Kaplan-Meier survival data: PFS by BICR, qmab/pembro + len vs pembro + len · 4) Safety data: summary of all-cause AEs and grade 3-5 AEs ≥10%, as-treated
More is not always better in 1L RCC! Presenting LITESPARK-012 Ph.III: adding belzutifan or CTLA-4 blockade to Pembro/Len failed to improve PFS or OS.
PFS HR 1.08/1.07; OS HR 1.04/1.12.
ORR 69%/69% vs 76% SOC.
#ESMO26 #RCC @myESMO @OncoAlert https://t.co/6yL8CsELLj
1) Kaplan-Meier survival data: OS, pembro + len + belz vs pembro + len (ITT) · 2) Slide: drug exposure, as-treated population
LITESPARK-12 tested Len/pem/bel (VEGF/PD1/HIF) vs Len/pem in 1st line RCC #ESMO26 (supported by a RII +ve PFS R2 @AlbigesL @crisuarez08). In the R3 both PFS and OS hasd HRs~1 with ⬆️ tox for triplets. Belzutifan doublets seem active so why do the triplets fail. It’s likely due to the increased toxic compromising dose intensity of the extremely active Len/pem (2 yr PFS). There seems a limit to tolerable drug intensity- triplets (COSMIC313 too) maybe a step too far. @OncoAlert @DrChoueiri
1) Kaplan-Meier survival data: OS, quavonlimab/pembrolizumab + lenvatinib · 2) Response data: ORR by BICR per RECIST 1.1, ITT: pembro + len + belz vs Qmab/pembro +
LITESPARK-12 tested Len/pem/CTLA4 vs Len/pem in 1st line advanced RCC. This, and the adjuvant nivo vs ipi/nivo trials both add CTLA4 to Nivo. #ESMO26 8Y8 (ipi/nivo vs Nivo) is long awaited. Uncertainty on the role of CTLA4 is increasingly uncertain @brian_rini @DrChoueiri @OncoAlert
Slide: Annals of Oncology article header: pembrolizumab plus lenvatinib with belzutifan or quavonlimab
Triplets in 1st line RCC failed in LS12 @Annals_Oncology @brian_rini (n=1500!). There are not many combinations with HIF/VEGF/PD1 left to test and this approach has probably run its course. It’s time for a new chapter in RCC with T cell engagers and bispecifics #ESMO26 @montypal @DrChoueiri @OncoAlert
Annals of Oncology
Available online 25 October 2026
In Press, Journal Pre-proof
Original Article
Pembrolizumab plus lenvatinib with belzutifan or quavonlimab as first-line therapy for advanced renal-cell carcinoma: randomized open-label phase 3 LITESPARK-012 study
Brian I. Rini 1 *, Toni K. Choueiri 2, Martin H. Voss 3, Mauricio Burotto 4, Jan Oldenburg 5, Howard P. Gurney 6, Thomas R. Ferguson 7, Hans Hammers 8, Laurence Albiges 9, Yüksel Ürün 10, Roberto I. Romero Diaz 11, Mustafa Özgüroğlu 12, Patricio Yañez Weber 13, Elena Verzoni 14, Camillo Porta 15, Alexandra Drakaki 16, Jun Guo 17, Nobuaki Matsubara 18, Aiying Chen 19, Joseph E. Burgents 19...Thomas B. Powles 20
Slide: title slide and author list, Toni K. Choueiri presenting, ESMO 2026
IO-based doublets have been hard to beat in 1L mRCC. Triplets don't seem to be the answer whether by adding a HIF2i or CTLA4i! Drug exposure and tox may be the issue here
@DrChoueiri continues to push for better SOC!
What other strategies could be attempted to improve outcomes for pts in this setting?
#ESMO26 @OncoAlert
First-line Pembrolizumab Plus Lenvatinib Plus Belzutifan or MK-1308A Plus Lenvatinib in Advanced RCC: Randomized Open-label Phase 3 LITESPARK-012 Study
Toni K. Choueiri1; Thomas B. Powles2; Martin H. Voss3; Mauricio Burotto4; Jan Oldenburg5; Howard P. Gurney6; Thomas R. Ferguson7; Hans Hammers8; Laurence Albiges9; Yüksel Ürün10; Roberto I. Romero Diaz11; Mustafa Özgüroğlu12; Patricio Yañez Weber13; Elena Verzoni14; Camillo Porta15; Alexandra Drakaki16; Aiying Chen17; Joseph E. Burgents17; Karla G. Rodriguez-Lopez17; Brian I. Rini18
1Dana-Farber Cancer Institute and Harvard Medical School, Boston, MA, USA; 2Barts Health NHS Trust, Barts Cancer Institute, and Queen Mary University of London, London, United Kingdom; 3Memorial Sloan Kettering Cancer Center, New York, NY, USA; 4Bradford Hill Clinical Research Center, Santiago, Chile; 5Akershus universitetssykehus, Lorenskog, Akershus, Norway; 6Maquarie University, Sydney, NSW, Australia; 7Fiona Stanley Hospital, Perth, WA, Australia; 8University of Texas Southwestern, Dallas, TX, USA; 9Département de Médecine Oncologique, Gustave Roussy, Université Paris Saclay, Villejuif, France; 10Ankara Universitesi Tip Fakultesi, Ankara, Türkiye; 11Centro de Investigacion Clinica de Oaxaca, Oaxaca City, Mexico; 12Istanbul University-Cerrahpaşa, Cerrahpaşa Faculty of Medicine, Istanbul, Türkiye; 13James Lind Cancer Research Center, Temuco, Chile; 14Genitourinary Medical Oncology, Fondazione IRCCS Istituto Nazionale dei Tumori di Milano, Milan, Italy; 15Azienda Ospedaliero-Universitaria Consorziale Policlinico di Bari and University of Bari "A. Moro," Bari, Italy; 16UCLA Hematology Oncology Santa Monica, Santa Monica, CA, USA; 17Merck & Co., Inc., Rahway, NJ, USA; 18Vanderbilt Ingram Cancer Center, Nashville, TN, USA
@DrChoueiri 1st up w #LITESPARK012 - Len/bel/pembro vs Len/quavonlimab/pembro vs Len/pembro for #kidneycancer. No diff in PFS or OS - likely from strong control cohort. Still no triplet for 1st line metastatic RCC.
@oncoalert #ESMO26 @myESMO https://t.co/08j4zrxYuS
Summary and Conclusions
In the randomized phase 3 LITESPARK-012 study:
• Neither addition of the HIF-2α inhibitor belzutifan nor the CTLA-4 inhibitor quavonlimab to pembrolizumab + lenvatinib improved efficacy in participants with previously untreated advanced ccRCC
• Adverse events in the investigational arms led to higher drug discontinuation rates
• Addition of belzutifan to pembrolizumab + lenvatinib was generally associated with anticipated adverse events consistent with belzutifan's known safety profile
• No new safety signals were observed for coformulated quavonlimab/pembrolizumab
• Efficacy and safety of standard-of-care pembrolizumab + lenvatinib were consistent with prior reports, and this regimen was reinforced as a standard of care in front-line advanced ccRCC
1) Slide: baseline characteristics, ITT population · 2) Slide: OS key subgroups forest plot, pembro + len + belz vs pembro + len
Negative LITESPARK-012 at #ESMO26.
Adding belzutifan to pembrolizumab + lenvatinib in 1L advanced RCC failed to improve PFS (HR 1.08; p=0.84), with no OS benefit (HR 1.04).
More treatment ≠ better outcomes.
@SCUColombia @achoHematoYOnco @myESMO @ASCO @OncoAlert @oncodaily https://t.co/XU9ANCyFLg
Slide: PFS by BICR key subgroups forest plot, pembro + len + belz vs pembro + len
First-line Pembrolizumab Plus Lenvatinib Plus Belzutifan or MK-1308A Plus Lenvatinib in Advanced RCC: Randomized Open-label Phase 3 LITESPARK-012 Study. Presented by @DrChoueiri @DanaFarber. #ESMO26 written coverage by @rksayyid @UAUrology > https://t.co/vItvbTjfyR #KidneyCancer #RCC @myESMO
Kaplan-Meier survival data: (per caption): PFS KM curve, Arm A vs Control (HR 1.08)
📢 #ESMO26 concomitant paper - Pembrolizumab plus lenvatinib with belzutifan or quavonlimab as first-line therapy for advanced renal-cell carcinoma: randomized open-label phase 3 LITESPARK-012 study.
🔗https://t.co/idQFCcMARV
@brian_rini @tompowles1 https://t.co/BdsoC4xYaH
Slide: statistical considerations / alpha allocation (Toni K. Choueiri)
Findings from the phase 3 LITESPARK-012 trial, presented by @DrChoueiri, show that adding either the HIF-2α inhibitor belzutifan or the CTLA-4 inhibitor quavonlimab to pembrolizumab and lenvatinib did not improve efficacy in previously untreated advanced clear cell renal cell carcinoma. Both combination regimens were also associated with higher rates of treatment discontinuation.
While neither approach improved efficancy, these findings will help inform the design of future clinical trials in advanced kidney cancer. #ESMO26
Statistical Considerations
• Multiplicity control
– Overall Type I error rate was strongly controlled at 2.5% (1-sided) within each comparison
– Prespecified hierarchical testing strategy across PFS and OS endpoints
– Alpha allocation shown on the right
• Efficacy analyses
– PFS and OS: HRs and 95% CIs estimated by stratified Cox regression model; between-arm differences assessed with stratified log-rank test
– ORR: estimated with exact Clopper and Pearson method
– Efficacy population: ITT population
• Safety analyses
– Safety population: all treated participants with ≥1 dose of study treatment
Pembro + len + belz vs. pembro + len
PFS (dual primary) ITT population α = 0.005 ⇄ (1.0 / 1.0) OS (dual primary) ITT population α = 0.02
Qmab/pembro + len vs. pembro + len
PFS (dual primary) Int/poor population α = 0.0035 → (1.0) PFS (dual primary) ITT population α = 0
PFS (dual primary) ITT population α = 0 → (1.0) OS (dual primary) Int/poor population α = 0.0215
OS (dual primary) Int/poor population α = 0.0215 → (1.0) OS (dual primary) ITT population α = 0
OS (dual primary) ITT population α = 0 → (1.0) PFS (dual primary) Int/poor population α = 0.0035
Data cutoff date: 4 Feb 2026
1) Slide: Wide stage photo of Naomi Haas discussant slide on (3586O), text too · 2) Kaplan-Meier survival data: (3586O, Choueiri) design and PFS · 3) Kaplan-Meier survival data — LITESPARK-011, LITESPARK-012 · 4) Slide: RAPPORT vs MDACC MDT-alone cohort comparison: MDT+ICI vs MDT
Dr. #Naomi #Haas of @PennMedicine w/ insightful discussion of #LITESPARK012, #LITESPARK011, and phase II PE PE trails, highlighting emerging data, imp nuances, and unanswered questions in the evolving # RCC tx landscape @OncoAlert @TiansterZhang #ESMO26 https://t.co/sjccivzqpo
1) Kaplan-Meier survival data: CA017-078: Overall survival by treatment arm · 2) Kaplan-Meier survival data: KEYNOTE-866 (pembro + cis + gem vs placebo + cis + gem)
Is this the end of platinum-based chemo + immunotherapy in #bladdercancer? 🤔 What should we do with NIAGARA from now on? 😬
@OncoAlert @myESMO @OncoDailyGU
#ESMO26 https://t.co/IF0qJTrz5Q
1) Trial design schema: CA017-078 study design (NCT03661320) · 2) Kaplan-Meier survival data: CA017-078 event-free survival by treatment arm
🎯 #ESMO26 ENERGIZE ph3 trial presenting by @AndreaNecchi other periop of IO therapy in MIBC! Cis-Gem + Nivo vs Cis-Gem! Other negative study of IO + cisplatin-based chemo!🧐 Reinforce the value of ADC + Pembro in this setting! @OncoAlert @myESMO @GuardConsortium @PGrivasMDPhD @apolo_andrea
[Slide 1]
Study design: CA017-078
Phase 3 randomized trial of neoadjuvant NIVO plus GC, followed by adjuvant NIVO, vs neoadjuvant GC alone for previously untreated MIBC (NCT03661320)
Screening
Key inclusion criteria
- MIBC (predominant urothelial component)
- cT2-T4a, N0, M0
- GFR >= 50 mL/min
- ECOG PS 0-1
Stratification factors
- Clinical stage (T2 vs T3/T4a)
- GFR (50 to <60 mL/min vs >= 60 mL/min)
- PD-L1 status (>= 1% vs < 1%/indeterminate/NE) by central reviewa
R 1:1
Neoadjuvant presurgical treatmentb,c | Surgery | Adjuvant postsurgical treatment
GC Q3W x 4 cycles + NIVO 360 mg Q3W x 4 cycles, N = 325 -> Radical cystectomy -> NIVO 480 mg Q4W x 9 cycles
GC Q3W x 4 cycles, N = 328 -> Radical cystectomy -> No further treatment
TERMINATED (Dec 2021) Excluded from formal testing of NIVO+GC vs GC alone: GC Q3W x 4 cycles + NIVO 360 mg Q3W x 4 cycles + BMS986205 (blinded) 100 mg QD -> Radical cystectomy -> NIVO 480 mg Q4W + BMS986205 (blinded) 100 mg QD x 9 cycles
Co-primary endpointsd: pCR and EFS per BICR
Secondary endpointsd: OS, safety
Exploratory endpoints: ctDNA analyses
Median follow-up (range): 54.5 months (39.4-77.0)
GFR based on the Cockcroft-Gault formula.
aAssessed by the Dako PD-L1 IHC 28-8 pharmDx assay. bAll patients receive GC chemotherapy on a Q3W schedule. Dose and schedule depend on the patient's calculated GFR. GFR >= 60 mL/min: gemcitabine 1000 mg/m2 D1, D8; cisplatin 70 mg/m2 D1; GFR 50 to < 60 mL/min: gemcitabine 1000 mg/m2 D1, D8; cisplatin 35 mg/m2 D1, D8. cA third arm (NIVO + linrodostat + GC/NIVO + linrodostat) was terminated. dpCR rate was defined by the proportion of randomized patients with absence of any cancer (T0 and N0) in pathology specimens after RC, based on blinded pathology review. EFS was defined as the time from randomization to any of the following events: progression of disease that precludes RC surgery, local or distant recurrence based on BICR assessments, or death due to any cause. OS was defined as the time between the date of randomization and the date of death from any cause.
[Slide 2]
CA017-078
Event-free survival by treatment arm (co-primary endpoint)
[table] NIVO+GC (N = 325) | GC (N = 328)
# of events/# of patients (%): 104/325 (32.0) | 104/328 (31.7)
Median EFS (95% CI), mo: NR (NE-NE) | 67.6 (63.0-NE)
HR (95% CI): 0.94 (0.72-1.24)
HR (95.74% CI): 0.94 (0.71-1.25)
P valuea: 0.6697
Curve labels: 12 mo NIVO+GC 82.6% / GC 78.6%; 24 mo 72.3% / 71.6%; 36 mo 68.1% / 68.5%; ~39 mo 67.3% / 65.8%
Y-axis: Probability of event-free survival per BICR (%); X-axis: Months
No. at risk (0,6,12,18,24,30,36,42,48,54,60,66,72,78 mo)
NIVO+GC: 325 283 243 227 209 197 189 146 100 60 25 5 0 0
GC: 328 271 219 199 187 176 168 131 90 61 23 4 1 0
- Median EFS was not reached in the NIVO+GC arm and was 67.6 months (95% CI 63.0-NE) in the GC arm
- The EFS co-primary endpoint did not meet the significance criterion determined by the prespecified testing procedure
aTwo-sided P value from log-rank test stratified by PD-L1 status, GFR category, and T stage at screening as entered into the IRT. P value threshold for statistical significance, 0.0426.
Survival table
Endpoint: EFS per BICR (co-primary)
Arm | N | Median | Median CI
NIVO+GC | 325 | NR | NE-NE
GC | 328 | 67.6 | 63.0-NE
HR: 0.94
HR CI: 0.72-1.24 (95% CI); 0.71-1.25 (95.74% CI)
P: 0.6697 (two-sided; threshold 0.0426)
Landmark rates:
12 mo: NIVO+GC 82.6% | GC 78.6%
24 mo: NIVO+GC 72.3% | GC 71.6%
36 mo: NIVO+GC 68.1% | GC 68.5%
1) Slide: Title slide - Phase 3 neoadjuvant chemo ± nivolumab then adjuvant nivolumab in MIBC · 2) Biomarker data: CA017-078: EFS and OS by pre-cystectomy ctDNA status (pooled) · 3) Kaplan-Meier survival data: CA017-078: Event-free survival by treatment arm
Bravo @AndreaNecchi on a superb presentation of ENERGIZE trial at @myESMO #ESMO26 ! 👏
Ph3, n=653 cis-eligible MIBC: neoadj GC + nivo → adj nivo vs GC alone.
Median f/u 54.5 mo.
🔹 pCR 39.1% vs 29.6%: not dig 🔹 EFS HR 0.94: co-primaries not met 🔹 OS HR 0.88
👉Negative trial, but the ctDNA data are a key message: detectable ctDNA at baseline and after NAC strongly prognostic for worse EFS & OS.
Selecting patients by ctDNA, rather than adding IO for all, is where the field is heading!
Great to see this build on our Ph2 BLASST-1. Despite the negative result, it's very practice-informing.
Proud to be a part of this effort!
@CleClinicMD @caseccc @CleClinicUro @sonpavde @MattGalsky @MichvdHeijden @Uromigos @Annals_Oncology @tompowles1
[Slide 1]
CHAIRS: AXEL BEX, ANJA LORCH
Results from a phase 3 trial of neoadjuvant chemotherapy alone vs in combination with nivolumab followed by postsurgical adjuvant nivolumab in patients with muscle-invasive bladder cancer
Andrea Necchi,1* Shilpa Gupta,2 Michiel S. van der Heijden,3 Matthew D. Galsky,4 Gary Steinberg,5† Jürgen E. Gschwend,6 Juan Pablo Sade,7 Davide Bimbatti,8 Ugo De Giorgi,9‡ Sergio Vazquez Estevez,10 Sergio Panay,11 Giovanni Schinzari,12 Athanasios Kotsakis,13 Hideaki Miyake,14 JongJin Oh,15 Joshua Zhang,16‡ Chandrika Jeyamohan,16 Miye Jacques,16 Quyen Duong,16 Guru Sonpavde17§
1Fondazione IRCCS Istituto Nazionale dei Tumori, Milan, Italy; 2Taussig Cancer Institute, Cleveland Clinic Foundation, Cleveland, OH, USA; 3Netherlands Cancer Institute, Amsterdam, the Netherlands; 4Tisch Cancer Institute, Icahn School of Medicine at Mount Sinai, New York, NY, USA; 5NYU Langone Health, New York, NY, USA; 6Technical University of Munich, Munich, Germany; 7University of Buenos Aires, Buenos Aires, Argentina; 8Veneto Institute of Oncology IOV-IRCCS, Padua, Italy; 9IRCCS Istituto Romagnolo per lo Studio dei Tumori (IRST) "Dino Amadori," Meldola, Italy; 10Hospital Universitario Lucus Augusti (HULA), EOXI de Lugo, Cervo e Monforte, Lugo, Spain; 11Fundación Arturo López Pérez, Santiago, Chile; 12Catholic University of the Sacred Heart, Comprehensive Cancer Center, Fondazione Policlinico Universitario Agostino Gemelli IRCCS, Rome, Italy; 13General Hospital of Larissa and Faculty of Medicine, School of Health Sciences, University of Thessaly, Larissa, Thessaly, Greece; 14Kobe University Hospital School of Medicine, Kobe, Japan; 15Seoul National University Bundang Hospital, Seoul National University College of Medicine, Seoul, South Korea; 16Bristol Myers Squibb, Princeton, NJ, USA; 17Dana-Farber Cancer Institute, Harvard Medical School, Boston, MA, USA
*Dr Necchi is now with the Department of Medical Oncology, IRCCS San Raffaele Hospital, Comprehensive Cancer Center, Milan, Italy. †Dr Steinberg is now with Rush University Medical Center, Chicago, IL, USA. ‡Dr De Giorgi is now with the University Oncology Unit, "Vito Fazzi" Hospital, Lecce, Italy. §Dr Sonpavde is now with AdventHealth Cancer Institute and Loma Linda University, Orlando, FL, USA.
Presentation number 4736O
[Speaker panel] Andrea Necchi - Results from a phase 3 trial of neoadjuvant (neoadj) chemotherapy alone vs in combination with nivolumab followed by postsurgical adjuvant nivolumab in patients (pts) with muscle-invasive bladder cancer (MIBC)
[Slide 3]
13:30 - 15:00 Proffered paper 1: Genitourinary tumour, renal and urothelial
CHAIRS: AXEL BEX, ANJA LORCH
CA017-078
EFS and OS by pre-cystectomy ctDNA status (pooled)^a
EFS by pre-cystectomy ctDNA status | OS by pre-cystectomy ctDNA status
Legend: Negative C1D1+C4D1; Cleared by C4D1; Positive at C4D1
No. at risk - EFS (Months 0-80)
Negative C1D1+C4D1: 147 127 115 103 83 45 13 2 0
Cleared by C4D1: 153 129 105 93 79 37 9 1 0
Positive at C4D1: 46 19 14 9 8 4 3 1 0
No. at risk - OS (Months 0-80)
Negative C1D1+C4D1: 147 139 134 130 103 57 14 1 0
Cleared by C4D1: 153 146 131 118 98 48 17 2 0
Positive at C4D1: 46 33 24 20 13 6 3 1 0
- In a pooled analyses across treatment arms, ctDNA absence (at both C1D1 and C4D1) and ctDNA clearance was associated with longer EFS and OS
^aBased on pooled analysis of all evaluable patients in the NIVO+GC and GC arms. ctDNA testing was performed using the Signatera tumor-informed molecular residual disease assay (Natera, Austin, TX, USA). Pre-cystectomy ctDNA status was categorized as negative at C1D1 and C4D1, positive at C1D1, but negative by C4D1, or positive at C4D1.
BARCELONA AUDITORIUM - HALL 9
Survival table
Endpoint: EFS and OS by pre-cystectomy ctDNA status (pooled across arms)
Negative C1D1+C4D1 | 147
Cleared by C4D1 | 153
Positive at C4D1 | 46
[Slide 4]
13:30 - 15:00 Proffered paper 1: Genitourinary tumour, renal and urothelial
CHAIRS: AXEL BEX, ANJA LORCH
CA017-078
Event-free survival by treatment arm (co-primary endpoint)
| | NIVO+GC (N = 325) | GC (N = 328) |
# of events/# of patients (%) | 104/325 (32.0) | 104/328 (31.7)
Median EFS (95% CI), mo | NR (NE-NE) | 67.6 (63.0-NE)
HR (95% CI) | 0.94 (0.72-1.24)
HR (95.74% CI) | 0.94 (0.71-1.25)
P value^a | 0.6697
Curve landmark labels (NIVO+GC / GC): 82.6% / 78.6% (12 mo line); 72.3% / 71.6% (24 mo line); 68.1% / 68.5% (36 mo line); 67.3% / 65.8% (fourth dashed line, ~38-39 mo, timepoint not labelled)
No. at risk (Months 0, 6, 12, 18, 24, 30, 36, 42, 48, 54, 60, 66, 72, 78)
NIVO+GC: 325 283 243 227 209 197 189 146 100 60 25 5 0 0
GC: 328 271 219 199 187 176 168 131 90 61 23 4 1 0
- Median EFS was not reached in the NIVO+GC arm and was 67.6 months (95% CI 63.0-NE) in the GC arm
- The EFS co-primary endpoint did not meet the significance criterion determined by the prespecified testing procedure
^aTwo-sided P value from log-rank test stratified by PD-L1 status, GFR category, and T stage at screening as entered into the IRT. P value threshold for statistical significance, 0.0426.
BARCELONA AUDITORIUM - HALL 9
Survival table
Endpoint: EFS per BICR (co-primary)
Arm | N | Median | Median CI
NIVO+GC | 325 | NR | NE-NE
GC | 328 | 67.6 mo | 63.0-NE
HR: 0.94
HR CI: 0.72-1.24 (95% CI); 0.71-1.25 (95.74% CI)
P: 0.6697
Landmark rates:
12 mo: NIVO+GC 82.6% | GC 78.6%
24 mo: NIVO+GC 72.3% | GC 71.6%
36 mo: NIVO+GC 68.1% | GC 68.5%
unlabelled 4th dashed line (~38-39 mo): NIVO+GC 67.3% | GC 65.8%
1) Biomarker data: (CA017-078) - Neoadjuvant ctDNA clearance and pCR - Andrea · 2) Biomarker data: (CA017-078) - EFS and OS by pre-treatment ctDNA status · 3) Biomarker data: (CA017-078) - EFS and OS by pre-cystectomy ctDNA status
Brilliant work, @AndreaNecchi, in presenting data from CG +/- nivo in MIBC at #ESMO26. Certainly the most interesting aspect of this is derived from the rich ctNDA data associated with this study. Bravo! @PGrivasMDPhD @UroDocAsh @shilpaonc @SpiessPhilippe https://t.co/JxKPp5az6a
[Slide 1]
13:30 - 15:00 Proffered paper 1: Genitourinary tumour, renal and urothelial
CHAIRS: AXEL BEX, ANJA LORCH
CA017-078
Neoadjuvant ctDNA clearance and pCR
ctDNA clearance
(neoadjuvant C1D1 to C4D1)
Fisher exact P = 0.130
Cleared ctDNA at C4D1 (%)
GC: 71.7% (66/92)
NIVO+GC: 81.3% (87/107)
Bars show % of C1D1 ctDNA-positive patients negative at C4D1; whiskers are Wilson 95% CIs.
pCR by ctDNA clearance status
(neoadjuvant C1D1 to C4D1)
pCR rate by treatment arm, faceted by C1D1 to C4D1 ctDNA clearance status
Pathologic complete response rate (%)
ctDNA cleared by C4D1
n = 153
Fisher exact P = 0.242
GC: 33.3% (22/66)
NIVO+GC: 43.7% (38/87)
ctDNA not cleared by C4D1
n = 46
Fisher exact P = 1.000
GC: 7.7% (2/26)
NIVO+GC: 5.0% (1/20)
• ctDNA clearance was higher with NIVO+GC vs GC alone
• In both treatment arms, ctDNA clearance was associated with a higher pCR rate
• Among patients with ctDNA clearance, pCR rates were higher with NIVO+GC vs GC alone
ctDNA testing was performed using the Signatera tumor-informed molecular residual disease assay (Natera, Austin, TX, USA). ctDNA clearance status was categorized as positive at C1D1 but negative by C4D1 (cleared), or positive at both C1D1 and C4D1 (not cleared). The ctDNA-evaluable population (patients with ctDNA results for both C1D1 and C4D1) comprised 53.0% (346/653) of all randomly assigned patients. The ctDNA-evaluable population was representative of the total study population across all demographic features and baseline demographic characteristics were well balanced between the treatment arms.
[Speaker panel] Andrea Necchi
Results from a phase 3 trial of neoadjuvant (neoadj) chemotherapy alone vs in combination with nivolumab followed by postsurgical adjuvant nivolumab in patients (pts) with muscle-invasive bladder cancer (MIBC)
BARCELONA AUDITORIUM - HALL 9
[Slide 2]
13:30 - 15:00 Proffered paper 1: Genitourinary tumour, renal and urothelial
CHAIRS: AXEL BEX, ANJA LORCH
CA017-078
EFS and OS by pre-treatment ctDNA status (pooled)a
EFS by pretreatment ctDNA status | OS by pretreatment ctDNA status
Legend: C1D1 positive; C1D1 negative
Y-axis: Survival probability; X-axis: Months
No. at risk (EFS), months 0/10/20/30/40/50/60/70/80:
C1D1 positive: 229 164 136 118 99 45 10 1 0
C1D1 negative: 187 149 132 118 94 53 14 1 0
No. at risk (OS), months 0/10/20/30/40/50/60/70/80:
C1D1 positive: 229 202 175 158 128 62 24 2 0
C1D1 negative: 187 168 160 153 120 68 17 1 0
• In a pooled analyses across treatment arms, pretreatment ctDNA detection was associated with shorter EFS and OS
aBased on pooled analysis of all evaluable patients in the NIVO+GC and GC arms. ctDNA testing was performed using the Signatera tumor-informed molecular residual disease assay (Natera, Austin, TX, USA). Pretreatment ctDNA status was categorized as positive or negative based on detectable ctDNA at C1D1.
[Speaker panel] Andrea Necchi - Results from a phase 3 trial of neoadjuvant (neoadj) chemotherapy alone vs in combination with nivolumab followed by postsurgical adjuvant nivolumab in patients (pts) with muscle-invasive bladder cancer (MIBC)
BARCELONA AUDITORIUM - HALL 9
Survival table
Endpoint: EFS and OS by pretreatment (C1D1) ctDNA status, pooled across NIVO+GC and GC arms
C1D1 ctDNA positive | 229
C1D1 ctDNA negative | 187
[Slide 3]
13:30 - 15:00 Proffered paper 1: Genitourinary tumour, renal and urothelial
CHAIRS: AXEL BEX, ANJA LORCH
CA017-078
EFS and OS by pre-cystectomy ctDNA status (pooled)a
EFS by pre-cystectomy ctDNA status | OS by pre-cystectomy ctDNA status
Legend: Negative C1D1+C4D1; Cleared by C4D1; Positive at C4D1
Y-axis: Survival probability; X-axis: Months
No. at risk (EFS), months 0/10/20/30/40/50/60/70/80:
Negative C1D1+C4D1: 147 127 115 103 83 45 13 2 0
Cleared by C4D1: 153 129 105 93 79 37 9 1 0
Positive at C4D1: 46 19 14 9 8 4 3 1 0
No. at risk (OS), months 0/10/20/30/40/50/60/70/80:
Negative C1D1+C4D1: 147 139 134 130 103 57 14 1 0
Cleared by C4D1: 153 146 131 118 98 48 17 2 0
Positive at C4D1: 46 33 24 20 13 6 3 1 0
• In a pooled analyses across treatment arms, ctDNA absence (at both C1D1 and C4D1) and ctDNA clearance was associated with longer EFS and OS
aBased on pooled analysis of all evaluable patients in the NIVO+GC and GC arms. ctDNA testing was performed using the Signatera tumor-informed molecular residual disease assay (Natera, Austin, TX, USA). Pre-cystectomy ctDNA status was categorized as negative at C1D1 and C4D1, positive at C1D1, but negative by C4D1, or positive at C4D1.
[Speaker panel] Andrea Necchi - Results from a phase 3 trial of neoadjuvant (neoadj) chemotherapy alone vs in combination with nivolumab followed by postsurgical adjuvant nivolumab in patients (pts) with muscle-invasive bladder cancer (MIBC)
BARCELONA AUDITORIUM - HALL 9
Survival table
Endpoint: EFS and OS by pre-cystectomy (C1D1/C4D1) ctDNA status, pooled across NIVO+GC and GC arms
Negative C1D1+C4D1 | 147
Cleared by C4D1 | 153
Positive at C4D1 | 46
1) Trial design schema: CA017-078 study design (NCT03661320) - wide shot · 2) Response data: CA017-078 pathological complete response by treatment arm (wide shot) · 3) Slide: CA017-078 subsequent cancer therapy summary (wide shot) · 4) Slide: CA017-078 summary
Another negative Ph.III perioperative IO trial by @AndreaNecchi : CA017-078 evaluates Nivo + Gem/Cis -> surgery -> adjuvant Nivo vs Gem/Cis alone in MIBC.
EFS HR 0.94 (95.74% CI 0.71-1.25), p=0.67. pCR 39.1% vs 29.6% (NS). OS HR 0.88.
Important implications for perioperative IO strategies.
#ESMO26 #BladderCancer @myESMO @OncoAlert
[Slide 1]
Study design: CA017-078
Phase 3 randomized trial of neoadjuvant NIVO plus GC, followed by adjuvant NIVO, vs neoadjuvant GC alone for previously untreated MIBC (NCT03661320)
Screening - Key inclusion criteria: MIBC (predominant urothelial component); cT2-T4a, N0, M0; GFR >= 50 mL/min; ECOG PS 0-1
Stratification factors: Clinical stage (T2 vs T3/T4a); GFR (50 to <60 mL/min vs >= 60 mL/min); PD-L1 status (>= 1% vs < 1%/indeterminate/NE) by central review
R 1:1 -> GC Q3W x 4 cycles + NIVO 360 mg Q3W x 4 cycles N = 325 -> Radical cystectomy -> NIVO 480 mg Q4W x 9 cycles
GC Q3W x 4 cycles N = 328 -> Radical cystectomy -> No further treatment
TERMINATED (Dec 2021) Excluded from formal testing of NIVO+GC vs GC alone: GC Q3W x 4 cycles + NIVO 360 mg Q3W x 4 cycles + BMS986205 (blinded) 100 mg QD -> Radical cystectomy -> NIVO 480 mg Q4W + BMS986205 (blinded) 100 mg QD x 9 cycles
Co-primary endpoints: pCR and EFS per BICR; Secondary endpoints: OS, safety; Exploratory endpoints: ctDNA analyses
Median follow-up (range): 54.5 months (39.4-77.0)
[footnotes illegible at this resolution]
[Slide 4]
Summary
- In CA017-078, adding perioperative NIVO to neoadjuvant GC increased the pCR rate vs GC alone (39.1% vs 29.6%); however, the prespecified statistical threshold for the co-primary endpoint of pCR was not met
- The co-primary endpoint of EFS was not improved with NIVO+GC vs GC (HR, 0.94; P value, 0.6697), and OS data were immature with no clear treatment difference (HR, 0.88)
- The safety profile of NIVO+GC was consistent with that of the individual agents1,2
- Exploratory analyses suggested that pretreatment ctDNA status and ctDNA clearance during neoadjuvant treatment were prognostic (patients who were ctDNA-negative before treatment or achieved ctDNA clearance had better EFS and OS in both treatment arms)
- Although the co-primary endpoints were not met, these mature randomized phase 3 data - including exploratory ctDNA analyses - are practice-informing
1. Bajorin DF, et al. N Engl J Med. 2021;384:2102-2114. 2. van der Heijden MS, et al. N Engl J Med. 2023;389:1778-1789
1) Response data: CA017-078 - Pathological complete response · 2) Slide: CA017-078 - Overall survival by treatment arm · 3) Biomarker data: CA017-078 - EFS and OS by pre-treatment ctDNA
🚨⭐🟠 #ESMO26 | Abstract 4736O | ENERGIZE (CA017-078)
Phase III trial of neoadjuvant chemotherapy ± nivolumab followed by adjuvant nivolumab in muscle-invasive bladder cancer (MIBC)
🎤 Presented by @AndreaNecchi 🇮🇹
@OncoAlert @urologysummit
🔬 Can perioperative nivolumab improve outcomes in patients with cisplatin-eligible MIBC?
📊 STUDY DESIGN
Phase III randomized trial | N=653
🔹 Nivolumab + gemcitabine/cisplatin → radical cystectomy → adjuvant nivolumab (n=325)
🔹 Gemcitabine/cisplatin → radical cystectomy → observation (n=328)
📊 KEY RESULTS
❌ Event-free survival (co-primary endpoint)
• Median EFS: NR vs 67.6 months
• HR 0.94 (95% CI 0.72–1.24)
• p=0.6697
➡️ No statistically significant improvement.
📈 Pathological complete response (co-primary endpoint)
• pCR: 39.1% vs 29.6%
• Absolute difference: +9.5 percentage points
❌ Did not meet the prespecified multiplicity-adjusted significance threshold.
🔬 Combined pathological response (≤ypT1N0)
• 51.7% vs 41.8%
🧬 ctDNA EXPLORATORY ANALYSIS
✅ Neoadjuvant ctDNA clearance:
• 81.3% vs 71.7%
📌 Pretreatment ctDNA positivity was associated with shorter EFS and OS.
However, no clear differential treatment benefit was observed according to baseline ctDNA status.
📊 Overall survival
• OS data remain immature.
• No established survival advantage.
⚠️ Safety was consistent with the known profiles of the individual agents.
🔬 CONCLUSION
Adding perioperative nivolumab to neoadjuvant gemcitabine/cisplatin did not significantly improve the co-primary endpoints of pCR or EFS in patients with MIBC.
⭐ MY POINT OF VIEW | CLINICAL PEARL
Improving pathological response does not necessarily translate into better long-term outcomes.
ENERGIZE reinforces an essential principle in perioperative oncology: pCR signals must be interpreted alongside EFS, OS, toxicity and statistical robustness.
🧬 ctDNA is emerging as a powerful prognostic biomarker, but its ability to guide treatment intensification or de-escalation still requires prospective validation.
💡 The future of perioperative MIBC treatment is not simply adding more immunotherapy. It is identifying who truly benefits—and who can safely avoid unnecessary treatment.
🌍 GU Oncology Community
@gbanna74 @ravikanesvaran
@tompowles1 @PGrivasMDPhD @apolo_andrea @sonpavde @montypal @TiansterZhang @DrYukselUrun @drenriquegrande @cdanicas
@ecancer @UrologyTimes @urotoday @wearemedsir @OpenMedicineHQ @UCSFCancer
#BladderCancer #MIBC #GUOncology #ClinicalTrials #OncoAlert
[Slide 2]
CA017-078
Pathological complete response by treatment arm
pCR overall (co-primary endpoint)a - Overall ITT: NIVO+GC 39.1 | GC 29.6; difference 9.5% (95% CI [illegible, approx. 2.3-16.7]) (99.9x% CI [illegible, approx. -2.x to 21.6]a)
pCR by subgroups (Patients %):
PD-L1 ≥1%: 46.4 | 35.5; difference 10.9% (95% CI [illegible])
PD-L1 <1%: 33.3 | 24.3; difference 9.1% (95% CI [illegible])
cT2: 40.6 | 31.5; difference 9.1% (95% CI [illegible])
cT3/cT4a: 35.1 | 23.9; difference 11.2% (95% CI [illegible])
Combined response (≤ ypT1N0) - Overall ITT: 51.7 | 41.8; difference 9.9% (95% CI [illegible])
Legend: NIVO+GC; GC
• Overall pCR rate was higher with NIVO+GC, but the multiplicity-adjusted analysis did not establish a significant difference
• Descriptive pCR rates were higher with NIVO+GC in both PD-L1 strata and in the cT2 and cT3/cT4a subgroups
• Overall combined response rate (≤ ypT1N0) was higher with NIVO+GC
aResults shown are from a descriptive pCR update at the EFS final analysis cutoff. The prespecified pCR final analysis had already been completed, and formal hypothesis testing was not repeated. Therefore, no P value is reported. bThe pCR hypothesis was evaluated at the multiplicity-adjusted 2-sided nominal significance level of 0.0009[illegible] at the final analysis, corresponding to a 99.9x% CI. Conventional 95% CIs were also reported descriptively.
[Slide 3]
CA017-078
Overall survival by treatment arm
Table: NIVO+GC (N = 325) | GC (N = 328)
# of events/# of patients (%): 71/325 (21.8)[blurry] | 81/328 (24.7)[blurry]
Median OS (95% CI), mo: NR (NE-NE) | NR (NE-NE)
HR (95% CI): 0.88 (0.64-1.21)[blurry]
Y-axis: Probability of overall survival (%); X-axis: Months 0-78
Landmark labels on curve: 91.6% (NIVO+GC) / 92.8% (GC) at 12 mo; 84.8% / 85.2% at 24 mo; 79.8% / 80.5% at 36 mo; 79.8% / 78.4% at ~39 mo dashed line
No. at risk (months 0,6,12,...,78):
NIVO+GC: 325 305 281 268 257 248 238 204 148 113 72 36 16 0
GC: 328 299 282 269 255 249 238 205 149 105 66 32 17 0
• Median OS was not reached in either treatment arm
• OS was analyzed descriptively because the EFS testing condition was not met
Survival table
Endpoint: Overall survival (secondary; descriptive)
Arm | N | Median | Median CI
NIVO+GC | 325 | NR | NE-NE
GC | 328 | NR | NE-NE
HR: 0.88 [blurry]
HR CI: 0.64-1.21 [blurry]
Landmark rates:
12 mo: NIVO+GC 91.6% | GC 92.8%
24 mo: NIVO+GC 84.8% | GC 85.2%
36 mo: NIVO+GC 79.8% | GC 80.5%
~39 mo (dashed line, exact month not labeled): NIVO+GC 79.8% | GC 78.4%
[Slide 4]
CA017-078
EFS and OS by pre-treatment ctDNA status (by treatment)a
EFS by pretreatment ctDNA status | OS by pretreatment ctDNA status
Legend: GC C1D1 positive; GC C1D1 negative; NIVO+GC C1D1 positive; NIVO+GC C1D1 negative
Y-axis: Survival probability; X-axis: Months 0-80
No. at risk (EFS), months 0-80 by 10:
GC C1D1 positive: 108 71 55 48 43 21 7 1 0 [faint, low confidence]
GC C1D1 negative: 103 [rest illegible]
NIVO+GC C1D1 positive: 121 94 82 71 57 25 4 1 0
NIVO+GC C1D1 negative: 84 64 59 52 44 27 11 1 0 [low confidence]
No. at risk (OS), months 0-80 by 10:
GC C1D1 positive: 108 92 79 70 59 28 11 2 0 [faint, low confidence]
GC C1D1 negative: [illegible]
NIVO+GC C1D1 positive: 121 110 97 89 70 35 14 1 0
NIVO+GC C1D1 negative: 84 74 71 67 55 35 13 1 0 [low confidence]
• No clear treatment difference was observed between NIVO+GC and GC alone, regardless of pretreatment ctDNA status
aPretreatment ctDNA status was categorized as positive or negative based on detectable ctDNA at C1D1. ctDNA testing was performed using the Signatera tumor-informed molecular residual disease assay (Natera, Austin, TX, USA).
Survival table
Endpoint: EFS and OS by pretreatment (C1D1) ctDNA status and treatment arm
GC C1D1 positive | 108
GC C1D1 negative
NIVO+GC C1D1 positive | 121
NIVO+GC C1D1 negative | 84
1) Slide: CA017-078 demographics and baseline characteristics · 2) Kaplan-Meier survival data: CA017-078 overall survival by treatment arm
ENERGIZE: Another negative perioperative IO trial in MIBC.
Nivo + GC → cystectomy → nivo failed to improve EFS (HR 0.94, p=0.67). OS HR 0.88.
Notably, split-dose cisplatin was allowed and 77% had cT2 disease. Again, excellent outcomes in the control arm.
#ESMO26 @OncoAlert https://t.co/9g4zjz7Nq7
[Slide 2]
CA017-078
Demographics and baseline characteristics
| | NIVO+GC (N = 325) | GC (N = 328) |
Median age, years | 66.0 | 67.0
< 65 years, n (%) | 137 (42.2) | 136 (41.5)
≥ 65, n (%) | 188 (57.8) | 192 (58.5)
Sex, n (%) Male | 264 (81.2) | 259 (79.0)
Race, n (%)
White | 251 (77.2) | 257 (78.4)
Asian | 55 (16.9) | 55 (16.8)
Other^a | 12 (3.7) | 10 (3.0)
Calculated GFR, n (%)^b
< 50 mL/min | 4 (1.2) | 5 (1.5)
50 to < 60 mL/min | 34 (10.5) | 30 (9.1)
≥ 60 mL/min | 284 (87.4) | 291 (88.7)
Clinical T stage at study entry, n (%)^c
cT2 | 249 (76.6) | 254 (77.4)
cT3 | 56 (17.2) | 49 (14.9)
cT4a | 18 (5.5) | 22 (6.7)
Minor histological variants present, n (%) | 180 (55.4) | 180 (54.9)
PD-L1 ≥ 1%, n (%)^d | 153 (47.1) | 155 (47.3)
• Baseline demographic and disease characteristics were generally balanced between arms
• Most patients had cT2 disease at study entry and around a half of patients had tumor PD-L1 expression ≥ 1%
Randomized from September 17, 2019, to November 7, 2022.
^a"Other" category includes Black or African American, American Indian/Alaska native, and other. Race was not reported in 13 patients (2.0%). ^bCalculated GFR was not reported in 5 patients (0.8%). Nine patients with baseline calculated GFR <50 mL/min were classified as having a relevant protocol deviation at study entry. ^cClinical T stage at study entry was not reported in 5 patients (0.8%). ^dFour patients (1.2%) in the NIVO+GC arm were not evaluable for PD-L1 status.
[Slide 4]
CA017-078
Overall survival by treatment arm
| | NIVO+GC (N = 325) | GC (N = 328) |
# of events/# of patients (%) | 71/325 (21.8) | 81/328 (24.7)
Median OS (95% CI), mo | NR (NE-NE) | NR (NE-NE)
HR (95% CI) | 0.88 (0.64-1.21)
Y-axis: Probability of overall survival (%); X-axis: Months
Landmark labels on curve — NIVO+GC: 91.6% (12 mo), 84.8% (24 mo), 79.8% (36 mo), 79.8% (dashed line between 36 and 42 mo); GC: 92.8% (12 mo), 85.2% (24 mo), 80.5% (36 mo), 78.4% (dashed line between 36 and 42 mo)
No. at risk (months 0, 6, 12, 18, 24, 30, 36, 42, 48, 54, 60, 66, 72, 78)
NIVO+GC: 325 305 281 268 257 248 238 204 148 113 72 36 16 0
GC: 328 299 282 269 255 249 238 205 149 105 66 32 17 0
• Median OS was not reached in either treatment arm
• OS was analyzed descriptively because the EFS testing condition was not met
Survival table
Endpoint: OS (secondary, descriptive)
Arm | N | Median | Median CI
NIVO+GC | 325 | NR | NE-NE
GC | 328 | NR | NE-NE
HR: 0.88
HR CI: 95% CI 0.64-1.21
Landmark rates:
12 mo: NIVO+GC 91.6% | GC 92.8%
24 mo: NIVO+GC 84.8% | GC 85.2%
36 mo: NIVO+GC 79.8% | GC 80.5%
unlabeled dashed line between 36 and 42 mo: NIVO+GC 79.8% | GC 78.4%
Biomarker data: CA017-078 — Neoadjuvant ctDNA clearance and pCR (Signatera), NIVO+GC vs GC
#ESMO26
More perioperative evidence in cis eligible MIBC from CA017-078
Adding perioperative nivolumab to GC failed to improve EFS (HR 0.94) despite a numerical increase in pCR (39% vs 29.1%). Exploratoy data presented on ctDNA supports its prognostic value.
@OncoAlert https://t.co/rTOuNwNBMp
Context: the slide reports pCR of 39.1% vs 29.6% (nivolumab + GC vs GC, ITT), a descriptive update at the EFS final analysis.
Neoadjuvant ctDNA clearance and pCR
CA017-078
ctDNA clearance (neoadjuvant C1D1 to C4D1)
Fisher exact P = 0.130
GC: 71.7% (66/92)
NIVO+GC: 81.3% (87/107)
[y-axis: Cleared ctDNA at C4D1 (%)]
Bars show % of C1D1 ctDNA-positive patients negative at C4D1; whiskers are Wilson 95% CIs.
pCR by ctDNA clearance status (neoadjuvant C1D1 to C4D1)
pCR rate by treatment arm, faceted by C1D1 to C4D1 ctDNA clearance status
ctDNA cleared by C4D1, n = 153: Fisher exact P = 0.242; GC 33.3% (22/66); NIVO+GC 43.7% (38/87)
ctDNA not cleared by C4D1, n = 46: Fisher exact P = 1.000; GC 7.7% (2/26); NIVO+GC 5.0% (1/20)
[y-axis: Pathologic complete response rate (%)]
• ctDNA clearance was higher with NIVO+GC vs GC alone
• In both treatment arms, ctDNA clearance was associated with a higher pCR rate
• Among patients with ctDNA clearance, pCR rates were higher with NIVO+GC vs GC alone
ctDNA testing was performed using the Signatera tumor-informed molecular residual disease assay (Natera, Austin, TX, USA). ctDNA clearance status was categorized as positive at C1D1 but negative by C4D1 (cleared), or positive at both C1D1 and C4D1 (not cleared). The ctDNA-evaluable population (patients with ctDNA results for both C1D1 and C4D1) comprised 53.0% (346/653) of all randomly assigned patients. The ctDNA-evaluable population was representative of the total study population across all demographic features and baseline demographic characteristics were well balanced between the treatment arms.
1) Kaplan-Meier survival data: CA017-078 event-free · 2) Biomarker data: CA017-078 EFS and OS
@AndreaNecchi with phase 3 #ENERGIZE trial results — cis gem nivo vs cis gem in muscle invasive #bladdercancer. 10% path CR rate diff but no diff on EFS or OS. ctDNA (+) at baseline has poor prognosis.
@oncoalert #ESMO26 @myESMO https://t.co/HTP7Fwmx6p
[Slide 3]
CA017-078
Event-free survival by treatment arm (co-primary endpoint)
[Kaplan-Meier plot; y-axis: Probability of event-free survival per BICR (%); x-axis: Months 0-78]
Landmark labels on curves: NIVO+GC 82.6%, 72.3%, 68.1%, 67.3%; GC 78.6%, 71.6%, 68.5%, 65.8%
Table: | NIVO+GC (N = 325) | GC (N = 328)
# of events/# of patients (%): 104/325 (32.0) | 104/328 (31.7)
Median EFS (95% CI), mo: NR (NE-NE) | 67.6 (63.0-NE)
HR (95% CI): 0.94 (0.72-1.24)
HR (95.74% CI): 0.94 (0.71-1.25)
P value^a: 0.6697
No. at risk
NIVO+GC: 325 283 243 227 209 197 189 146 100 60 25 5 0 0
GC: 328 271 219 199 187 176 168 131 90 61 23 4 1 0
• Median EFS was not reached in the NIVO+GC arm and was 67.6 months (95% CI 63.0-NE) in the GC arm
• The EFS co-primary endpoint did not meet the significance criterion determined by the prespecified testing procedure
^aTwo-sided P value from log-rank test stratified by PD-L1 status, GFR category, and T stage at screening as entered into the IRT. P value threshold for statistical significance, 0.0426.
Survival table
Endpoint: EFS per BICR (co-primary endpoint)
Arm | N | Median | Median CI
NIVO+GC | 325 | NR | NE-NE
GC | 328 | 67.6 months | 63.0-NE
HR: 0.94
HR CI: 0.72-1.24 (95% CI); 0.71-1.25 (95.74% CI)
P: 0.6697 (threshold 0.0426; not significant)
Landmark rates:
unlabeled dashed line (~12 mo): NIVO+GC 82.6% | GC 78.6%
unlabeled dashed line (~24 mo): NIVO+GC 72.3% | GC 71.6%
unlabeled dashed line (~36 mo): NIVO+GC 68.1% | GC 68.5%
unlabeled dashed line (~38-39 mo): NIVO+GC 67.3% | GC 65.8%
[Slide 4]
CA017-078
EFS and OS by pre-treatment ctDNA status (pooled)^a
EFS by pretreatment ctDNA status
[Kaplan-Meier plot; y-axis: Survival probability 0.5-1.0; x-axis: Months 0-80]
Legend: C1D1 positive; C1D1 negative
No. at risk
C1D1 positive: 229 164 136 118 99 45 10 1 0
C1D1 negative: 187 149 132 118 94 53 14 1 0
OS by pretreatment ctDNA status
[Kaplan-Meier plot; y-axis 0.6-1.0; x-axis: Months 0-80]
No. at risk
C1D1 positive: 229 202 175 158 128 62 24 2 0
C1D1 negative: 187 168 160 153 120 68 17 1 0
• In a pooled analyses across treatment arms, pretreatment ctDNA detection was associated with shorter EFS and OS
^aBased on pooled analysis of all evaluable patients in the NIVO+GC and GC arms. ctDNA testing was performed using the Signatera tumor-informed molecular residual disease assay (Natera, Austin, TX, USA). Pretreatment ctDNA status was categorized as positive or negative based on detectable ctDNA at C1D1.
Survival table
Endpoint: EFS and OS by pretreatment (C1D1) ctDNA status, pooled across arms
C1D1 ctDNA positive | 229
C1D1 ctDNA negative | 187
1) Response data: Pathological complete response by treatment arm · 2) Kaplan-Meier survival data: Event-free survival by treatment arm · 3) Biomarker data: Neoadjuvant ctDNA clearance and pCR
#ESMO26 @AndreaNecchi presented ENERGIZE (CA017-078), comparing perioperative nivolumab + gemcitabine/cisplatin vs GC alone (N=653).
🔹 pCR: 39.1% vs 29.6%, but statistical threshold not met
🔹 EFS: HR 0.94; p=0.67
🔹 OS: HR 0.88 (descriptive)
🔹 Grade ≥3 AEs: 73% vs 56%
🧬 ctDNA clearance was strongly prognostic for EFS and OS, but neither baseline ctDNA status nor clearance identified patients who benefited more from nivolumab.
@UroToday @myESMO
[Slide 2]
Pathological complete response by treatment arm
pCR overall (co-primary endpoint)^a: Overall ITT NIVO+GC 39.1 vs GC 29.6; difference 9.5% (95% CI 2.3-16.7) (99.91% CI -2.6 to 21.6)^b
pCR by subgroups:
PD-L1 ≥1%: 46.4 vs 35.5; 10.9% (95% CI -0.1 to 21.5)
PD-L1 <1%: 33.3 vs 24.3; 9.1% (95% CI -0.6 to 18.5)
cT2: 40.6 vs 31.5; 9.1% (95% CI 0.7-17.3)
cT3/cT4a: 35.1 vs 23.9; 11.2% (95% CI -3.7 to 25.3)
Combined response (≤ ypT1N0): Overall ITT 51.7 vs 41.8; 9.9% (95% CI 2.3-17.5)
Patients (%)
Legend: NIVO+GC; GC
[Slide 3]
Event-free survival by treatment arm (co-primary endpoint)
| NIVO+GC (N = 325) | GC (N = 328)
# of events/# of patients (%) | 104/325 (32.0) | 104/328 (31.7)
Median EFS (95% CI), mo | NR (NE-NE) | 67.6 (63.0-NE)
HR (95% CI) | 0.94 (0.72-1.24)
HR (95.74% CI) | 0.94 (0.71-1.25)
P value^a | 0.6697
Landmarks: NIVO+GC 82.6%, 72.3%, 68.1%, 67.3%; GC 78.6%, 71.6%, 68.5%, 65.8%
Probability of event-free survival per BICR (%) vs Months
No. at risk (0,6,...,78)
NIVO+GC: 325 283 243 227 209 197 189 146 100 60 25 5 0 0
GC: 328 271 219 199 187 176 168 131 90 61 23 4 1 0
- Median EFS was not reached in the NIVO+GC arm and was 67.6 months (95% CI 63.0-NE) in the GC arm
- The EFS co-primary endpoint did not meet the significance criterion determined by the prespecified testing procedure
Survival table
Endpoint: EFS per BICR (co-primary)
Arm | N | Median | Median CI
NIVO+GC | 325 | NR | NE-NE
GC | 328 | 67.6 | 63.0-NE
HR: 0.94
HR CI: 95% CI 0.72-1.24; 95.74% CI 0.71-1.25
P: 0.6697
Landmark rates:
12 mo: NIVO+GC 82.6% | GC 78.6%
24 mo: NIVO+GC 72.3% | GC 71.6%
36 mo: NIVO+GC 68.1% | GC 68.5%
4th dashed line (timepoint not printed): NIVO+GC 67.3% | GC 65.8%
[Slide 4]
CA017-078
Neoadjuvant ctDNA clearance and pCR
ctDNA clearance (neoadjuvant C1D1 to C4D1)
Fisher exact P = 0.130
Cleared ctDNA at C4D1 (%): GC 71.7% (66/92); NIVO+GC 81.3% (87/107)
Bars show % of C1D1 ctDNA-positive patients negative at C4D1; whiskers are Wilson 95% CIs.
pCR by ctDNA clearance status (neoadjuvant C1D1 to C4D1)
pCR rate by treatment arm, faceted by C1D1 to C4D1 ctDNA clearance status
ctDNA cleared by C4D1 n = 153: Fisher exact P = 0.242; GC 33.3% (22/66); NIVO+GC 43.7% (38/87)
ctDNA not cleared by C4D1 n = 46: Fisher exact P = 1.000; GC 7.7% (2/26); NIVO+GC 5.0% (1/20)
Pathologic complete response rate (%)
📢 #ESMO26 concomitant paper - Neoadjuvant nivolumab + gem/cis followed by postsurgical adjuvant nivolumab vs neoadjuvant gem/cis in pts with muscle-invasive bladder cancer: final results from the phase III CA017-078 trial.
🔗https://t.co/H4z6rdHgiH
@sonpavde @AndreaNecchi https://t.co/9h8S4ddbVV
Kaplan-Meier survival data: Primary endpoint: EFS by investigator assessment
🔎 New phase III MIBC data at #ESMO26:
• KEYNOTE-866: perioperative PEMBRO vs perioperative PBO, plus neoadjuvant GC
• CA017-078: perioperative NIVO vs no treatment, plus neoadjuvant GC
• 📊 Both showed numerically higher pCR, but not statistically significant
• No significant improvement in EFS
💡 Take-home: These data do not support a change in current clinical practice.
#BladderCancer #MIBC
[Slide 1]
An official website of the United States government Here's how you know
FDA
Search
Menu
Resources for Information | Approved Drugs
IN THIS SECTION
FDA approves talazoparib with enzalutamide for metastatic androgen pathway modulation-naïve or -sensitive prostate cancer with HRR gene mutations
[Slide 3]
64
By Gene Analysis of rPFS
In post hoc analyses, rPFS generally favored TALA + ENZA across HRR gene subgroups
TALA + ENZA | PBO + ENZA
No. of Events/No. of Patients | HR (95% CI)
All HRR gene-altered patients based on all HRR tests 67/300 126/297 0.482 (0.358–0.648)
ATM 16/80 33/77 0.433 (0.238–0.786)
ATR 3/19 2/14 0.786 (0.131–4.711)
BRCA1 5/15 6/12 0.706 (0.215–2.321)
BRCA2 17/87 45/97 0.353 (0.202–0.617)
CDK12 8/51 29/55 0.275 (0.125–0.603)
CHEK2 12/44 19/44 0.626 (0.304–1.290)
FANCA 6/10 1/6 4.277 (0.512–35.752)
MLH1 0/3 1/1 NE
MRE11A 0/0 2/2 NE
NBN 1/5 1/4 NE
PALB2 0/11 4/6 NE
RAD51C 0/0 1/4 NE
0.1 1 3 6 9
Favors TALA + ENZA | Favors PBO + ENZA
Data cutoff: February 18, 2026 (ITT population). Analyses included all available tumor and baseline ctDNA records. For non-BRCAm, those with co-occurring BRCA1/2m were excluded. For BRCA1m, those with co-occurring [illegible] excluded. Unstratified HRs are based on a Cox proportional hazards model, with treatment as the only covariate.
ctDNA=circulating tumor DNA; NE=not evaluable.
2026 ASCO ANNUAL MEETING #ASCO26
PRESENTED BY: Neeraj Agarwal
Talazoparib now @FDA ✅ based off TALAPRO-3: Enzalutamide + Talazoparib vs. Enza alone in HRR mutated mCSPC:
- At 3yrs, rPFS: 76.6% vs. 56.2% (HR: 0.48)
- rPFS in BRCAm: 77.2% vs. 48.8% (HR: 0.37)
- rPFS in nonBRCA: 76.2% vs. 60.2% (HR: 0.57)
#OncTwitter #gusm #ProstateCancer https://t.co/RBNfJVW1iN
[Slide 1]
TALAPRO-3: Trial Design
Key eligibility criteria
• HRR gene-altered mCSPC
• Metastatic disease confirmed by positive bone scan or metastatic lesion by CT or MRI scan
• ECOG PS 0 or 1
• Ongoing ADT
• ≤3 months of prior ADT with/without ARPI for mCSPC
• Prior docetaxel for mCSPC not permitted†
Stratification factors
• De novo vs relapsed mCSPC
• High- vs low-volume disease
• BRCAm vs non-BRCAm
1:1
N=599
TALA 0.5 mg* + ENZA 160 mg QD
PBO + ENZA 160 mg QD
Data cutoff: February 18, 2026
Primary endpoint
• rPFS by investigator assessment
Key secondary endpoint
• OS (alpha-protected)
Other secondary endpoints
• ORR per RECIST v1.1
• Duration of soft tissue response
• PSA response
• Time to PSA progression
• Time to subsequent antineoplastic therapy
• Time to first SSE
• Safety
• PROs
Exploratory endpoint
• PFS2
HRRm: ATM, ATR, BRCA1, BRCA2, CDK12, CHEK2, FANCA, MLH1, MRE11A, NBN, PALB2, RAD51C‡
*0.35 mg QD if the patient has moderate renal impairment; †As per the protocol amendment (September 2021). ClinicalTrials.gov identifier: NCT04821622. ‡HRR testing using FoundationOne®/FoundationOne®CDx and FoundationOne®Liquid CDx. BRCAm=BRCA alterations; CT=computed tomography; ECOG PS=Eastern Cooperative Oncology Group performance status; HRRm=HRR gene alterations; MRI=magnetic resonance imaging; ORR=objective response rate; [illegible]
PRESENTED BY: Neeraj Agarwal
2026 ASCO ANNUAL MEETING #ASCO26
[Slide 2]
Primary Endpoint: Investigator-Assessed rPFS
TALA + ENZA led to a 52% reduction in the risk of progression or death
Probability of rPFS (95% CI)
Months
No. at Risk
TALA + ENZA
PBO + ENZA
76.6% (70.8–81.4)
56.2% (50.0–62.0)
HR, 0.481 (95% CI, 0.357–0.647); p<0.0001
TALA + ENZA (n=300) | PBO + ENZA (n=299)
No. of events | 67 | 126
Median (95% CI), mo | NR (NR–NR) | 45.8 (37.7–NR)
Median follow-up for rPFS was 37.6 and 37.7 months, respectively
Data cutoff: February 18, 2026 (ITT population). Stratified HRs and 2-sided p values are reported throughout this presentation unless otherwise stated. NR=not reached.
PRESENTED BY: Neeraj Agarwal
Survival table
Endpoint: Investigator-assessed rPFS (ITT)
Arm | N | Median | Median CI
TALA + ENZA | 300 | NR | NR–NR
PBO + ENZA | 299 | 45.8 mo | 37.7–NR
HR: 0.481
HR CI: 0.357–0.647
P: <0.0001
36 mo: TALA + ENZA 76.6% (70.8–81.4) vs PBO + ENZA 56.2% (50.0–62.0)
[Slide 3]
rPFS in the BRCAm vs non-BRCAm Subgroups
A 63% risk reduction was observed in the BRCAm subgroup and 43% in the non-BRCAm subgroup
BRCA1/2m
77.2% (66.9–84.7)
48.8% (38.0–58.7)
TALA + ENZA (n=104) | PBO + ENZA (n=103)
No. of events | 22 | 49
Median (95% CI), mo | NR (NR–NR) | 35.1 (18.6–NR)
HR (95% CI) | 0.368 (0.222–0.609); p<0.0001
Non-BRCA1/2m
76.2% (68.8–82.1)
60.2% (52.5–67.0)
TALA + ENZA (n=196) | PBO + ENZA (n=196)
No. of events | 45 | 77
Median (95% CI), mo | NR (NR–NR) | NR (40.5–NR)
HR (95% CI) | 0.567 (0.392–0.819); p=0.0022
Probability of rPFS (95% CI)
Months
No. at Risk
Data cutoff: February 18, 2026 (ITT population). The BRCAm and non-BRCAm subgroups by randomization stratification. HRs are unstratified.
PRESENTED BY: Neeraj Agarwal
Survival table
Endpoint: Investigator-assessed rPFS by BRCA subgroup
Arm | N | Median | Median CI
BRCA1/2m: TALA + ENZA | 104 | NR | NR–NR
BRCA1/2m: PBO + ENZA | 103 | 35.1 mo | 18.6–NR
Non-BRCA1/2m: TALA + ENZA | 196 | NR | NR–NR
Non-BRCA1/2m: PBO + ENZA | 196 | NR | 40.5–NR
HR: BRCA1/2m 0.368; non-BRCA1/2m 0.567
HR CI: BRCA1/2m 0.222–0.609; non-BRCA1/2m 0.392–0.819
P: BRCA1/2m <0.0001; non-BRCA1/2m 0.0022
36 mo BRCA1/2m: 77.2% (66.9–84.7) vs 48.8% (38.0–58.7)
36 mo non-BRCA1/2m: 76.2% (68.8–82.1) vs 60.2% (52.5–67.0)
[Slide 4]
Overall Survival (Interim Analysis)
Overall survival at this interim analysis did not cross the efficacy boundary
Probability of OS
Months
No. at Risk
TALA + ENZA
PBO + ENZA
77.8% (72.5–82.1)
71.6% (66.0–76.4)
HR=0.767 (95% CI, 0.564–1.044); P=0.0905
TALA + ENZA (N=300) | PBO + ENZA (N=299)
Events, n | 74 | 91
Median (95% CI), months | NR (NR–NR) | NR (NR–NR)
Median follow-up for OS was 40.5 and 41.1 months, respectively
Data cutoff: February 18, 2026. Intention-to-Treat Population.
PRESENTED BY: Neeraj Agarwal
Survival table
Endpoint: Overall survival (interim, ITT)
Arm | N | Median | Median CI
TALA + ENZA | 300 | NR | NR–NR
PBO + ENZA | 299 | NR | NR–NR
HR: 0.767
HR CI: 0.564–1.044
P: 0.0905
36 mo: TALA + ENZA 77.8% (72.5–82.1) vs PBO + ENZA 71.6% (66.0–76.4)
Biomarker data: Screenshot of FDA notice: FDA approves talazoparib with enzalutamide
📣 another FDA approval in APMS
➡️ MANY in 2026 inc. pluvicto & capivasertib
➡️ now talazoparib/enza vs enza #TALAPRO3 for HRR-altered APMS (vs AMPLITUDE only BRCA2)
➡️ rPFS 77% vs 56% (HR 0.48)
⚠️ OS immature, G≥3 anemia 51%, 40% transfused; no docetaxel-triplet comparator https://t.co/Tt9qSqUacc
FDA approves talazoparib with enzalutamide for metastatic androgen pathway modulation-naïve or -sensitive prostate cancer with HRR gene mutations
On October 26, 2026, the Food and Drug Administration (FDA) approved talazoparib (Talzenna, Pfizer Inc.) in combination with enzalutamide for the treatment of adults with metastatic androgen pathway modulation-naïve or -sensitive (mAPMN/S) prostate cancer with homologous recombination repair (HRR) gene mutations, as detected by an FDA-authorized test.
The FDA previously approved FoundationOne CDx and FoundationOne Liquid CDx assays as companion diagnostic devices to identify patients with prostate cancer with HRR gene alterations for treatment with talazoparib in combination with enzalutamide.
Feedback
1) Slide: PROs: Baseline demographics and treatment duration (PRO population) · 2) Slide: PROs: Comparable mean change from baseline in GHS/QoL per EORTC QLQ-C30 · 3) Slide: PROs: mean change from baseline, EORTC QLQ-C30 symptom scale · 4) Slide: PROs: time to (definitive) deterioration - GHS/QoL, urinary symptoms, worst pain
PROs in mCSPC and HRR gene alts receiving Tala + Enza vs PBO + Enza: TALAPRO-3 @AzadOncology @urotoday #ESMO26
📌No diff in change: GHS/QoL, physical functioning, fatigue
📌⏫ change from BL for appetite loss for Tala + Enza
📌No diff in TT definitive deterioration in GHS/QoL, urinary symptoms, pain
1) Trial design schema: Figure 2: PSA Progression for Alterations in Select HRR12 Genes · 2) Slide: Figure 3: Patients With PSA <0.2 ug/L at 6 and 12 Months by Select HRR12 Gene · 3) Kaplan-Meier survival data: Figure 4: KM rPFS by PSA <0.2 / <0.02 ug/L at 6 Months · 4) Slide: Table 2: rPFS and Time to PSA Progression by PSA <0.2 / <0.02 ug/L at 12 Months
PSA EPs with exploratory gene by gene subgroups in HRR gene–altered mCSPC from TALAPRO-3 #ESMO26 @urotoday
TALA + ENZA vs PBO + ENZA:
📌⏬ risk of PSA progression in ITT: HR 0.51, 95% CI 0.37–0.7
📌Improvement across all HRR alts, specifically BRCA2m and CDK12m
📌Among pts not achieving PSA <0.2 μg/L or <0.02 μg/L at 6 or 12 months: ⏫ outcomes
1) Biomarker data: Baseline ctDNA Burden Was Prognostic of rPFS in Both Arms · 2) Biomarker data: ctDNA: Conversion ctDNA+ to ctDNA- at Week 5 associated with longer rPFS · 3) Biomarker data: ctDNA tumor fraction analysis - Conclusions
ctDNA tumor fraction in TALAPRO-3 from @AzadOncology at #ESMO26 🧬 In HRR-deficient mCSPC, baseline ctDNA+ (TF ≥1%) was prognostic for rPFS in both arms. Week 5 matters too: 82% of ctDNA+ patients cleared on TALA + ENZA vs 68% on PBO + ENZA, and clearance tracked with longer rPFS (HR 0.36 vs persistent ctDNA+). Early on-treatment ctDNA could become a real tool for risk stratification and monitoring. Next up is whether it adds value beyond PSA. #MRD #ctDNA #ProstateCancer
[Slide 2]
Baseline ctDNA Burden Was Prognostic of rPFS in Both Arms
| n | Events | Median, mo | 95% CI
A. TALA + ENZA ctDNA+ at BL | 83 | 24 | NR | NR–NR
B. TALA + ENZA ctDNA− at BL | 147 | 32 | NR | NR–NR
C. PBO + ENZA ctDNA+ at BL | 75 | 40 | 26.7 | 18.2–NR
D. PBO + ENZA ctDNA− at BL | 149 | 50 | NR | 45.8–NR
[KM curve: Probability of PFS vs Progression-Free Survival Time (Months), 0-52; curve labels: TALA + ENZA ctDNA− at BL; TALA + ENZA ctDNA+ at BL; PBO + ENZA ctDNA− at BL; PBO + ENZA ctDNA+ at BL]
Unstratified
HR (A vs B)=1.59 (95% CI, 0.94–2.70); p=0.08
HR (A vs C)=0.47 (95% CI, 0.28–0.78); p=0.003
HR (B vs D)=0.62 (95% CI, 0.39–0.96); p=0.03
HR (C vs D)=2.15 (95% CI, 1.42–3.26); p=0.0002
No. at risk (months 0,2,4,...,52)
A: 83 80 74 69 69 60 57 54 52 51 49 48 47 46 44 42 42 39 30 24 23 17 8 4 3 1 0
B: 147 139 136 133 132 131 127 123 117 115 112 108 100 100 98 95 93 84 66 51 50 33 18 13 9 2 0
C: 75 69 65 59 52 49 46 44 42 42 38 36 33 32 29 26 26 21 15 13 13 9 4 3 2 1 0
D: 149 144 143 131 128 125 121 116 114 113 107 102 102 102 95 88 88 76 55 38 38 25 19 14 8 4 0
Data cutoff: February 18, 2026
Hazard ratio based on Cox proportional hazards model. P-value from an unstratified log-rank test. *Intention-to-treat population (ITT) excluding patients in China; rPFS by investigator assessment. NR=not reached.
Survival table
Endpoint: rPFS by baseline ctDNA status (investigator-assessed)
Arm | N | Median | Median CI
A. TALA + ENZA ctDNA+ at BL | 83 | NR | NR–NR
B. TALA + ENZA ctDNA− at BL | 147 | NR | NR–NR
C. PBO + ENZA ctDNA+ at BL | 75 | 26.7 | 18.2–NR
D. PBO + ENZA ctDNA− at BL | 149 | NR | 45.8–NR
HR: A vs B 1.59; A vs C 0.47; B vs D 0.62; C vs D 2.15
HR CI: A vs B 0.94–2.70; A vs C 0.28–0.78; B vs D 0.39–0.96; C vs D 1.42–3.26
P: A vs B 0.08; A vs C 0.003; B vs D 0.03; C vs D 0.0002
[Slide 3]
Conversion from ctDNA+ to ctDNA- and persistent ctDNA- at Week 5 was associated with longer rPFS in the TALA + ENZA Arm
| n | Events | Median, mo | 95% CI
A. TALA + ENZA ctDNA+ at BL and Wk 5 | 12 | 6 | 17.3 | 9.1–NR
B. TALA + ENZA ctDNA+ at BL and ctDNA− at Wk 5 | 55 | 14 | NR | NR–NR
C. TALA + ENZA ctDNA− at BL and Wk 5 | 114 | 25 | NR | NR–NR
D. TALA + ENZA ctDNA− at BL and ctDNA+ at Wk 5 | 4 | 3 | 14.3 | 5.6–NR
[KM curve: Probability of PFS vs Progression-Free Survival Time (Months), 0-52]
Unstratified (ctDNA burden at BL/Wk 5):
HR (B vs A)=0.36 (95% CI, 0.14–0.93); p=0.03
HR (C vs A)=0.23 (95% CI, 0.09–0.56); p=0.0004
HR (C vs B)=0.72 (95% CI, 0.38–1.39); p=0.33
No. at risk (months 0,2,4,...,52)
A: 12 11 9 8 8 6 6 6 5 4 4 3 3 3 3 3 3 3 2 2 2 2 0 0 0 0 0
B: 55 54 51 47 47 41 38 36 35 35 33 33 32 31 30 29 29 27 21 15 14 10 6 3 2 1 0
C: 114 108 106 104 104 103 100 98 94 92 89 85 79 79 77 75 73 66 51 37 37 23 13 10 7 1 0
D: 4 4 4 3 3 3 3 2 1 1 1 1 1 1 1 1 1 0 0 0 0 0 0 0 0 0 0
Data cutoff: February 18, 2026
Hazard ratio based on Cox proportional hazards model. P-value from an unstratified log-rank test. *ITT population excluding patients in China; rPFS by investigator assessment. Wk=Week.
Survival table
Endpoint: rPFS by ctDNA status at baseline and Week 5, TALA + ENZA arm (investigator-assessed)
Arm | N | Median | Median CI
A. ctDNA+ at BL and Wk 5 | 12 | 17.3 | 9.1–NR
B. ctDNA+ at BL and ctDNA− at Wk 5 | 55 | NR | NR–NR
C. ctDNA− at BL and Wk 5 | 114 | NR | NR–NR
D. ctDNA− at BL and ctDNA+ at Wk 5 | 4 | 14.3 | 5.6–NR
HR: B vs A 0.36; C vs A 0.23; C vs B 0.72
HR CI: B vs A 0.14–0.93; C vs A 0.09–0.56; C vs B 0.38–1.39
P: B vs A 0.03; C vs A 0.0004; C vs B 0.33
[Slide 4]
Conclusions
• In TALAPRO-3, baseline and on-treatment Week 5 ctDNA tumor fraction showed potential prognostic utility for rPFS in mCSPC
• Conversion of ctDNA tumor fraction from positive at baseline to negative at Week 5, which was higher with TALA + ENZA compared with PBO + ENZA, correlated with improved rPFS
• Further investigation will look at whether ctDNA provides independent prognostic value beyond established markers (e.g., PSA at 6 months) through multivariate analysis
ctDNA tumor fraction has potential as a prognostic biomarker and may improve risk stratification and therapeutic monitoring in patients with mCSPC
PSA=prostate-specific antigen
1) Safety data: safety: incidence of hematologic TEAEs, common non-hematologic TEAEs · 2) Kaplan-Meier survival data: rPFS with vs without talazoparib dose reduction
#ESMO26: TALAPRO-3 safety analysis of TALA + ENZA in HRR-altered mCSPC (n=594 safety population)
🔹 Grade ≥3 TEAEs: 81% with TALA + ENZA
🔹 Anemia most common hematologic AE; grade ≥3 anemia ~51%, generally occurring early
🔹 65% required ≥1 TALA dose reduction; median time to first reduction 17 wks
🔹 Dose reductions more frequent with older age, renal impairment & lower body weight
🔹 Exploratory rPFS appeared similar with vs without TALA dose reduction
🔹 MDS/AML: 5 pts with TALA + ENZA vs 1 with PBO + ENZA
🔑 Hematologic toxicity was common but largely manageable with early monitoring, dose interruption/reduction & supportive care, without an apparent loss of rPFS benefit.
@urotoday
1) Slide: PRO analysis title slide — Arun Azad, Rapid oral GU (ESMO 2026) · 2) Trial design schema: trial design: PRO analysis (blurred photo) · 3) Slide: PRO: time to (definitive) deterioration in GHS/QoL, urinary symptoms, worst pain · 4) Slide: PRO analysis — Conclusions (Arun Azad)
#ESMO26 | TALAPRO-3: Patient-reported outcomes comparing talazoparib + enzalutamide vs placebo + enzalutamide in mCSPC.
An important perspective on quality of life with PARP inhibitor combinations.
@SCUColombia @achoHematoYOnco @myESMO @ASCO @OncoAlert @oncodaily https://t.co/BAjOPg2iaK
[Slide 1]
13:30 - 15:00 Rapid oral: Genitourinary tumours, prostate, penile and testis
CHAIRS: THOMAS HWANG, EDMOND KWAN, ALISON REID
Patient-reported outcomes in men with metastatic castration-sensitive prostate cancer and homologous recombination repair gene alterations receiving talazoparib + enzalutamide vs placebo + enzalutamide: Results from the Phase 3 TALAPRO-3 study
Arun A. Azad,1 Fred Saad,2 Joaquin Mateo,3 Nobuaki Matsubara,4 Shusuan Jiang,5 Eric Voog,6 Dingwei Ye,7 Neal D. Shore,8 Timuçin Çil,9 Christof Vulsteke,10 Hsiao-Jen Chung,11 Jane Chang,12 Paul Cislo,12 Melissa Kirker,12 Prachi Nandoskar,13 Karim Fizazi,14 Neeraj Agarwal15
1Peter MacCallum Cancer Centre, Melbourne, Victoria, Australia; 2Centre Hospitalier de l'Université de Montréal, University of Montreal, Montreal, Canada; 3Vall d'Hebron Institute of Oncology (VHIO), Vall d'Hebron University Hospital, Barcelona, Spain; 4National Cancer Center Hospital East, Chiba, Japan; 5Hunan Cancer Hospital, Changsha, China; 6Clinique Victor Hugo, Centre Jean Bernard, Le Mans, France; 7Fudan University Shanghai Cancer Center, Shanghai, China; 8START Carolinas/Carolina Urologic Research Center, Myrtle Beach, SC, USA; 9Adana City Education and Research Hospital, Adana Faculty of Medicine, University of Health Sciences, Yuregir/Adana, Turkey; 10Integrated Cancer Center Ghent, AZ Maria Middelares, Ghent, Belgium and Center for Oncological Research (CORE), University of Antwerp, Antwerp, Belgium; 11Taipei Veterans General Hospital, Taipei, Taiwan, ROC; 12Pfizer Inc., New York, NY, USA; 13Pfizer Inc., South San Francisco, CA, USA; 14Centre Oscar Lambret, University of Paris Saclay, Lille, France; 15Huntsman Cancer Institute (NCI-CCC), University of Utah, Salt Lake City, UT, USA
October 23-27, 2026
ClinicalTrials.gov identifier: NCT04821622.
This study was sponsored by Pfizer Inc. Astellas Pharma Inc. provided enzalutamide.
[Speaker card] Arun Azad — Patient-reported outcomes (PROs) in men with metastatic castration-sensitive prostate cancer (mCSPC) and homologous recombination repair (HRR) gene alterations receiving talazoparib (TALA) + enzalutamide (ENZA) vs placebo (PBO) + ENZA: Results from the...
BILBAO AUDITORIUM - HALL 3
[Slide 3]
13:30 - 15:00 Rapid oral: Genitourinary tumours, prostate, penile and testis
CHAIRS: THOMAS HWANG, EDMOND KWAN, ALISON REID
Time to (definitive) deterioration in GHS/QoL, urinary symptoms, and worst pain were comparable in the two arms
GHS/QoL per EORTC QLQ-C30*
[KM curve; y-axis: Event-free probability; x-axis: Time to definitive deterioration (months), 0-52]
| | No. of events/patients | Median (95% CI), mo | Stratified HR (95% CI) |
TALA + ENZA | 92/240 | 38.0 (35.1-46.0) | 1.15 (0.85-1.58)
PBO + ENZA | 78/234 | 46.0 (37.8-49.9) |
Urinary symptoms per EORTC QLQ-PR25†
[KM curve; y-axis: Event-free probability; x-axis: Time to definitive deterioration (months), 0-52]
| | No. of events/patients | Median (95% CI), mo | Stratified HR (95% CI) |
TALA + ENZA | 42/240 | NR (48.8-NR) | 0.94 (0.61-1.44)
PBO + ENZA | 46/234 | 51.4 (46.8-NR) |
Worst pain per BPI-SF‡
[KM curve; y-axis: Event-free probability; x-axis: Time to deterioration (months), 0-52]
| | No. of events/patients | Median (95% CI), mo | Stratified HR (95% CI) |
TALA + ENZA | 81/240 | NR (32.9-NR) | 0.82 (0.61-1.11)
PBO + ENZA | 83/234 | NR (23.[illegible]-NR) |
*Definitive deterioration defined as a ≥10-point decrease from baseline and no subsequent observations with a <10-point decrease from baseline assessed by the EORTC QLQ-C30. †Definitive deterioration defined as a ≥10-point increase from baseline and no subsequent observations with a <10-point increase from baseline assessed by the EORTC QLQ-PR25. ‡Deterioration defined as the first of either a ≥2-point increase from baseline for item 3 of the BPI-SF for two consecutive visits at least 4 weeks apart or an increase in WHO analgesic usage score on two consecutive visits.
Confidential - Not for Public Consumption or Distribution
[Speaker card] Arun Azad
BILBAO AUDITORIUM - HALL 3
Survival table
Endpoint: Time to (definitive) deterioration — GHS/QoL (EORTC QLQ-C30), urinary symptoms (EORTC QLQ-PR25), worst pain (BPI-SF)
Arm | N | Median | Median CI
GHS/QoL — TALA + ENZA | 240 | 38.0 mo | 35.1-46.0
GHS/QoL — PBO + ENZA | 234 | 46.0 mo | 37.8-49.9
Urinary symptoms — TALA + ENZA | 240 | NR | 48.8-NR
Urinary symptoms — PBO + ENZA | 234 | 51.4 mo | 46.8-NR
Worst pain — TALA + ENZA | 240 | NR | 32.9-NR
Worst pain — PBO + ENZA | 234 | NR | 23.[illegible]-NR
HR: GHS/QoL 1.15; Urinary 0.94; Worst pain 0.82
HR CI: GHS/QoL 0.85-1.58; Urinary 0.61-1.44; Worst pain 0.61-1.11
[Slide 4]
13:30 - 15:00 Rapid oral: Genitourinary tumours, prostate, penile and testis
CHAIRS: THOMAS HWANG, EDMOND KWAN, ALISON REID
Conclusions
• Treatment with talazoparib plus enzalutamide did not result in clinically meaningful differences between arms (≥5-point threshold in overall mean change for deterioration) in HRQoL based on EORTC QLQ-C30 and -PR25 scales, except for appetite loss
• While numerical worsening was noted for several HRQoL parameters in the talazoparib arm compared with the control arm, these differences did not reach the threshold for clinically meaningful difference despite the addition of a third therapy to standard-of-care treatment
• Reduction of HRQoL around Week 17, including fatigue and appetite loss, is consistent with the onset of anemia, which was managed with dose modifications and supportive care
• Time to definitive deterioration in GHS/QoL and urinary symptoms, and time to deterioration in worst pain were comparable between arms
These results can help inform the risk-benefit assessment of talazoparib plus enzalutamide as a potential treatment option for patients with mCSPC harboring HRR gene alterations
[Speaker card] Arun Azad
BILBAO AUDITORIUM - HALL 3
1) Biomarker data: Baseline ctDNA burden was prognostic of rPFS in both arms · 2) Biomarker data: ctDNA+ to ctDNA- conversion rates at Week 5 by arm · 3) Biomarker data: rPFS by ctDNA conversion at Week 5 in the TALA + ENZA arm · 4) Biomarker data: rPFS by ctDNA conversion at Week 5 in the PBO + ENZA arm
ctDNA Tumor Fraction as a Prognostic Biomarker in #TALAPRO3: Talazoparib + Enzalutamide in HRR-mutated #mCSPC. Presented by @AzadOncology @PeterMacCC. #ESMO26 written coverage by @zklaassen_md > https://t.co/q7hKlQeBli #ProstateCancer #PrecisionOncology @myESMO https://t.co/FLAApLUcaJ
PROs with Talazoparib + Enzalutamide vs PBO + Enzalutamide in #mCSPC with HRR Gene Alterations: Phase 3 TALAPRO-3. Presented by @AzadOncology @PeterMacCC. #ESMO26 written coverage by @zklaassen_md > https://t.co/EAZehLSh5N #ProstateCancer #PrecisionOncology @myESMO https://t.co/v0Z2LYohLG
1) Biomarker data: ctDNA conversion and rPFS - PBO + ENZA arm (KM) · 2) Biomarker data: ctDNA+ to ctDNA- conversion rates at Week 5, TALA + ENZA vs PBO · 3) Biomarker data: ctDNA tumor fraction background slide - Arun Azad, Rapid oral GU
🧬 New TALAPRO-3 ctDNA data in HRR-mutated mCSPC at #ESMO26:
• Baseline ctDNA positivity → poorer rPFS in both arms
• ctDNA clearance rates→ higher with TALA+ENZA vs PBO+ENZA
• ctDNA clearance by week 5 → better rPFS in both arms
• Persistently undetectable ctDNA → most favourable outcomes
💡 Take-home: Early ctDNA dynamics show promise for refining prognosis, but are not yet ready to guide routine treatment decisions.
#ProstateCancer #ctDNA
[Slide 1]
Conversion from ctDNA+ to ctDNA- and persistent ctDNA- at Week 5 was associated with longer rPFS in the PBO + ENZA Arm
Legend: n | Events | Median, mo | 95% CI
A. PBO + ENZA ctDNA+ at BL and Week 5 | 21 | 14 | 11.5 | 3.6–29.3
B. PBO + ENZA ctDNA+ at BL and ctDNA− at Week 5 | 45 | 23 | 35.1 | 18.4–NR
C. PBO + ENZA ctDNA− at BL and Week 5 | 121 | 39 | NR | 46.0–NR
D. PBO + ENZA ctDNA− at BL and ctDNA+ at Week 5 | 2 | 2 | 4.7 | 3.9–NR
Curve labels: PBO + ENZA ctDNA− at BL and Wk 5; PBO + ENZA ctDNA+ at BL and ctDNA− at Wk 5; PBO + ENZA ctDNA+ at BL and Wk 5; PBO + ENZA ctDNA− at BL and ctDNA+ at Wk 5
Unstratified (ctDNA burden at BL/Wk 5):
HR (B vs A)=0.43 (95% CI, 0.22–0.83); p=0.01
HR (C vs A)=0.23 (95% CI, 0.12–0.43); p<0.0001
HR (C vs B)=0.55 (95% CI, 0.33–0.92); p=0.02
Y axis: Probability of PFS; X axis: Progression-Free Survival Time (Months) 0–52
No. at risk (months 0,2,4,...,52):
A: 21 17 14 12 10 9 8 7 7 7 6 5 5 3 3 2 2 2 2 2 0 0 0 0 0 0 0
B: 45 45 45 42 37 35 33 31 31 31 28 27 27 26 23 22 22 18 13 11 11 7 4 3 2 1 0
C: 121 120 120 111 108 105 102 98 96 95 90 86 86 81 75 75 65 45 31 31 18 13 12 6 3 0 [illegible]
D: 2 2 1 0 0 0 0 0 0 0 0 0 0 0 0 0 0 0 0 0 0 0 0 0 0 0 0
Data cutoff: February 18, 2026
Hazard ratio based on Cox proportional hazards model. P-value from an unstratified log-rank test. *ITT population excluding patients in China; rPFS by investigator assessment. Wk=Week.
Survival table
Endpoint: rPFS (investigator) by ctDNA status at baseline and Week 5, PBO + ENZA arm
Arm | N | Median | Median CI
A. PBO + ENZA ctDNA+ at BL and Week 5 | 21 | 11.5 mo | 3.6–29.3
B. PBO + ENZA ctDNA+ at BL and ctDNA− at Week 5 | 45 | 35.1 mo | 18.4–NR
C. PBO + ENZA ctDNA− at BL and Week 5 | 121 | NR | 46.0–NR
D. PBO + ENZA ctDNA− at BL and ctDNA+ at Week 5 | 2 | 4.7 mo | 3.9–NR
HR: 0.43 (B vs A)
HR CI: 0.22–0.83
P: 0.01
[Slide 3]
ctDNA+ to ctDNA- Conversion Rates Were Higher With TALA + ENZA
ctDNA+ at baseline*:
TALA + ENZA 67/269 (24.9%) | PBO + ENZA 66/262 (25.2%)
Conversion to ctDNA− at Week 5, n (%)†,‡
TALA + ENZA: Yes 55 (82.1%) [95% CI, 70.4–90.0]; No 12 (17.9%)
PBO + ENZA: Yes 45 (68.2%) [95% CI, 55.4–78.8]; No 21 (31.8%)
ctDNA− at baseline*:
TALA + ENZA 118/269 (43.9%) | PBO + ENZA 123/262 (46.9%)
Conversion to ctDNA+ at Week 5, n (%)†,‡
TALA + ENZA: No 114 (96.6%) [95% CI, 91.0–98.9]; Yes 4 (3.4%)
PBO + ENZA: No 121 (98.4%) [95% CI, 93.7–99.7]; Yes 2 (1.6%)
Y axis: Patients, %
Data cutoff: February 18, 2026
*Denominator for participants with evaluable ctDNA at both baseline and Week 5 is intention-to-treat population excluding China patients. †Counts reported for participants with evaluable ctDNA at both baseline and Week 5. ‡Denominator for conversion calculations is patients with evaluable ctDNA at both baseline and Week 5. Two-sided 95% CI calculated using the Wilson score interval with continuity correction.
[Slide 4]
13:30 - 15:00 Rapid oral: Genitourinary tumours, prostate, penile and testis
CHAIRS: THOMAS HWANG, EDMOND KWAN, ALISON REID
Background
• In the Phase 3 TALAPRO-3 trial, adding TALA (PARPi) to ENZA (ARPI) significantly improved rPFS versus PBO + ENZA in patients with HRR-deficient metastatic castration-sensitive prostate cancer (mCSPC; also known as metastatic APMN/S prostate cancer) (HR=0.48; 95% CI 0.36–0.65; p<0.001)1,2
• Circulating tumor DNA (ctDNA) tumor fraction is an emerging prognostic biomarker with broad potential utility across multiple treatment approaches and tumor types*,3,4
• We assessed the potential prognostic utility of baseline ctDNA tumor fraction and its early on-treatment dynamics, captured as the change at Week 5, in patients from TALAPRO-3
*ctDNA tumor fraction is the proportion of total cell-free DNA in a sample which is tumor derived.4
APMN/S=androgen pathway modulation-naive/sensitive; ARPI=androgen receptor pathway inhibitor; CI=confidence interval; ENZA=enzalutamide; HR=hazard ratio; HRR=homologous recombination repair; PARPi=poly(ADP-ribose) polymerase inhibitor; PBO=placebo; rPFS=radiographic progression-free survival; TALA=talazoparib.
1. Agarwal N, et al. N Engl J Med. 2026;395:427-439 2. Armstrong AJ, et al. J Clin Oncol. 2026;44:1249-1265 3. Reichert ZR, et al. Clin Cancer Res. 2023;34:111-120 4. Rolfo CD, et al. Clin Cancer Res. 2024;30:2452-2460
[Speaker panel] Arun Azad — Utility of ctDNA tumor fraction (TF) as a prognostic biomarker in TALAPRO-3: phase 3 study of talazoparib (TALA) + enzalutamide (ENZA) vs placebo (PBO) + ENZA in patients (pts) with homologous recombination repair (HRR) gene–mutated metastatic castra...
BILBAO AUDITORIUM - HALL 3
1) Trial design schema: trial design: PRO analysis · 2) Slide: PRO: Comparable mean change from baseline in physical functioning per EORTC QLQ-C30 · 3) Slide: PRO: Similar mean change from baseline between arms in fatigue per EORTC QLQ-C30
#TALAPRO3 #PRO: Adding #talazoparib to #enzalutamide in HRR-mutated mCSPC improved rPFS (HR 0.48) without clinically meaningful differences in overall QoL or most PROs, though w/decreased appetite. Overall reassuring QoL alongside meaningful efficacy benefit. @OncoAlert #ESMO26 https://t.co/j1vprHIKeX
[Slide 1]
TALAPRO-3 trial design: PRO analysis
Key eligibility criteria
• HRRm mCSPC
• Metastatic disease confirmed by positive bone scan or metastatic lesion by CT or MRI scan
• ECOG PS 0 or 1
• Ongoing ADT
• ≤3 months of prior ADT with/without ARPI for mCSPC
• Prior docetaxel not permitted*
Stratification factors
• De novo vs relapsed mCSPC
• High- vs low-volume disease
• BRCAm vs non-BRCAm
1:1 N=599
Talazoparib 0.5 mg† + enzalutamide 160 mg QD
Placebo + enzalutamide 160 mg QD
Data cutoff: February 18, 2026
Primary endpoint
• rPFS by investigator assessment
Key secondary endpoint
• OS (alpha-protected)
PRO endpoints‡
• Change from BL in GHS/QoL and symptoms
• TTDD in GHS/QoL
• TTDD in EORTC QLQ-PR25
• TTD in BPI-SF
PRO instruments
• EORTC QLQ-C30 (cancer specific)
• EORTC QLQ-PR25 (prostate cancer–specific)
• BPI-SF (pain)
• EQ-5D-5L (general health status)
Assessed at baseline, every 4W to W25, then every 8W to W57, then every 12W up to the safety follow-up visit
A ≥5-point difference between groups for deterioration in EORTC-QLQ measures was considered clinically meaningful1
TALAPRO-3 HRRm gene panel: ATM, ATR, BRCA1, BRCA2, CDK12, CHEK2, FANCA, MLH1, MRE11A, NBN, PALB2, RAD51C§
*For mCSPC, as per the protocol amendment (September 2021). ClinicalTrials.gov identifier: NCT04821622; †0.35 mg QD if the patient has moderate renal impairment; ‡A stratified log-rank test and Cox proportional hazards model were used to compare time-to-events between arms, with HR values being nominal (not alpha controlled); §HRR testing using FoundationOne®/FoundationOne®CDx and FoundationOne®Liquid CDx. ADT=androgen deprivation therapy; ARPI=androgen receptor pathway inhibitor; BL=baseline; BPI-SF=Brief Pain Inventory Short Form; EORTC QLQ-C30=European Organisation for Research and Treatment of Cancer cancer-specific global health questionnaire; EORTC QLQ-PR25=European Organisation for Research and Treatment of Cancer disease-specific urinary symptoms questionnaire; EQ-5D-5L=EuroQol 5-Dimension 5-Level; GHS/QoL=general health status/quality of life; HRRm=HRR gene alterations; QD=once daily; TT(D)D=time to (definitive) deterioration; W=week. 1. Gamper EM, et al. BMC Cancer. 2021;21:1083.
Confidential - Not for Public Consumption or Distribution
[Slide 2]
Comparable mean change from baseline in physical functioning per EORTC QLQ-C30
EORTC QLQ-C30 Score Range: 0–100
Estimated overall mean change from baseline difference (95% CI) -2.5 (-5.1 to 0.1)*
[line chart: Observed mean change from baseline, 95% CI (5 to -25) vs Assessment visit (week) 5, 9, 13, 17, 21, 25, 33, 41, 49, 57, 69, 81, 93, 105, 117, 129, 141, 153, 165, 177, 189, 201, 213; Improved (up) / Worsened (down)]
Number evaluable
TALA + ENZA: 183 173 171 173 164 172 166 161 154 148 144 136 131 129 120 117 113 103 75 50 34 18 9
PBO + ENZA: 169 164 170 167 162 168 156 153 151 146 139 134 126 117 109 106 99 87 60 39 29 20 10
*Differences in estimated overall mean scores between arms were assessed by longitudinal mixed-effects model for repeated measures. A ≥5-point difference between groups for deterioration was considered clinically meaningful.1
1. Gamper EM, et al. BMC Cancer. 2021;21:1083.
Confidential - Not for Public Consumption or Distribution
[Slide 3]
Similar mean change from baseline between arms in fatigue per EORTC QLQ-C30
EORTC QLQ-C30 Score Range: 0–100
Estimated overall mean change from baseline difference (95% CI) 3.2 (0.2–6.2)*
[line chart: Observed mean change from baseline, 95% CI (40 to -20) vs Assessment visit (week) 5, 9, 13, 17, 21, 25, 33, 41, 49, 57, 69, 81, 93, 105, 117, 129, 141, 153, 165, 177, 189, 201, 213; Worsened (up) / Improved (down)]
Number evaluable
TALA + ENZA: 183 173 171 173 164 172 166 161 154 148 144 136 131 129 120 117 113 103 75 50 34 18 9
PBO + ENZA: 169 164 170 167 162 168 156 153 151 146 139 134 126 117 109 106 99 87 60 39 29 20 10
*Differences in estimated overall mean scores between arms were assessed by longitudinal mixed-effects model for repeated measures. A ≥5-point difference between groups for deterioration was considered clinically meaningful.1
1. Gamper EM, et al. BMC Cancer. 2021;21:1083.
Confidential - Not for Public Consumption or Distribution
1) Slide: Room photo of EFS slide on ESMO26 main stage screens · 2) Slide: Baseline Characteristics - pembro + cis + gem vs placebo + cis + gem (MIBC) · 3) Kaplan-Meier survival data: Primary Endpoint: EFS by Investigator Assessment, ITT · 4) Slide: Subsequent Therapy, ITT - pembro + cis + gem vs placebo + cis + gem
Full house for Bladder/RCC updates first with #KN866 #ESMO26
Gem/cis in MIBC + placebo or pembro
(➖) study & less relevance in the era of EVP SOC
Vs similar trial NIAGARA was ➕
pCR 44.4% vs 35.8%
EFS & OS not significant
We wait #VOLGA tomorrow for more in this space https://t.co/uSLgxYSoMO
1) Trial design schema: Phase 3 study design (NCT03924856) · 2) Safety data: common TEAEs (>=15% in either arm), safety population, all phases · 3) Slide — KEYNOTE-866
Negative Ph.III KEYNOTE-866 by #DrJensBedke: perioperative pembrolizumab + neoadjuvant Gem/Cis vs placebo + Gem/Cis in cis-eligible MIBC.
EFS HR 0.88 (95% CI 0.71-1.10), p=0.137.
pCR 44.4% vs 35.8%; OS HR 1.00.
Higher pCR did not translate into EFS benefit.
#ESMO26 #BladderCancer @myESMO @OncoAlert
[Slide 1]
Phase 3 KEYNOTE-866 Study Design (NCT03924856)
Key Eligibility Criteria
- Adults with MIBC
- Clinical stage T2-T4aN0M0 or T1-T4aN1M0 by central assessment
- Urothelial histology >=50%
- Eligible for RC + PLND
- Did not meet any Galsky criteria for cisplatin ineligibility,1 including GFR >=60 mL/min
- ECOG PS 0 or 1
Stratification Factors
- PD-L1 status (CPS >=10 vs <10)a
- Clinical stage (T2N0 vs T3/T4aN0 vs T1-4aN1)
- Geographic region (US vs Western Europe vs most of world)
R 1:1
n = 453: Pembrolizumab 200 mg d1 IV Q3W 4 cycles + Cisplatin 70 mg/m2 d1 IV Q3W 4 cycles + Gemcitabine 1000 mg/m2 d1 and d8 IV Q3W 4 cycles -> RC + PLND -> Pembrolizumab 200 mg d1 IV Q3W 13 cycles
n = 454: Placebo d1 IV Q3W 4 cycles + Cisplatin 70 mg/m2 d1 IV Q3W 4 cycles + Gemcitabine 1000 mg/m2 d1 and d8 IV Q3W 4 cycles -> RC + PLND -> Placebo d1 IV Q3W 13 cycles
Primary endpoint: EFS by investigator assessment
Key secondary endpoints: OS and pathological complete response (pCR; pT0N0, ie, absence of viable tumor in examined tissue from cystectomy) by central pathologist review
Other secondary endpoints include: Safety
aAssessed by PD-L1 IHC 22C3 pharmDx (Agilent, Carpinteria, CA); CPS = #PD-L1-staining cells (tumor cells, lymphocytes, and macrophages) / total # viable tumor cells x 100.
1. Galsky MD et al. Lancet Oncol. 2011;12:211-214. Data cutoff: January 26, 2026.
[Slide 3]
Common TEAEsa (Incidence >=15% in Either Arm)
Safety Analysis Population, All Phases of Treatmentb
Pembro + cis + gem (n = 450) | Placebo + cis + gem (n = 449)
Terms (top to bottom): Nausea, Anemia, Neutropenia, Constipation, Fatigue, Urinary tract infection, Diarrhea, Decreased appetite, Thrombocytopenia, Blood creatinine increased, Asthenia, Pruritus, Weight decreased, Vomiting, Leukopenia, Pyrexia
Pembro + cis + gem values (top to bottom): 54.9%, 54.4%, 53.1%, 35.8%, 34.9%, 26.0%, 24.7%, 24.2%, 23.3%, 22.9%, 22.4%, 20.4%, 17.8%, 17.1%, 16.2%, 15.3%
Placebo + cis + gem values (top to bottom): 52.3%, 55.2%, 50.6%, 39.0%, 29.8%, 28.1%, 19.2%, 20.7%, 23.8%, 20.5%, 24.3%, 10.9%, 12.0%, 13.8%, 13.6%, 14.9%
Legend: Grade 1 or 2 | Grade 3-5
X-axis: Incidence, % (100 ... 0 ... 100)
aCollected up to 30 days after cessation of study treatment (90 days for serious AEs). bReporting window included neoadjuvant, surgical, and adjuvant phases. Data cutoff: January 26, 2026.
[Slide 4]
Conclusions
- KEYNOTE-866 is the first placebo-controlled trial to add perioperative PD-1(L)1-based immunotherapy to neoadjuvant cisplatin plus gemcitabine and RC + PLND for MIBC
- The addition of pembrolizumab to cisplatin plus gemcitabine did not confer a statistically significant EFS benefit in participants with MIBC who were eligible for cisplatin
- EFS outcomes were generally consistent across key subgroups
- The key secondary endpoints of OS and pCR rate were not formally tested for statistical significance per the statistical design
- OS was similar between the treatment groups
- pCR rate was numerically higher in the pembrolizumab group compared with the placebo group (44.4% vs 35.8%)
- Efficacy outcomes in the placebo group surpassed conventional benchmarks for neoadjuvant cisplatin plus gemcitabine and RC + PLND in MIBC1
- The safety profile of perioperative pembrolizumab added to standard-of-care neoadjuvant cisplatin plus gemcitabine and RC + PLND was manageable and consistent with prior reports with no new safety signals2,3
- While perioperative pembrolizumab plus neoadjuvant cisplatin-based chemotherapy is not supported for participants with MIBC, perioperative enfortumab vedotin plus pembrolizumab has become a standard of care in this disease setting4,5
1. Powles T et al. N Engl J Med. 2024;391:1773-1786. 2. Bellmunt J et al. N Engl J Med. 2017;376:1015-1026. 3. Balar AV et al. Lancet Oncol. 2017;18:1483-1492. 4. Galsky MD et al. N Engl J Med. 2026;395:338-348. 5. Vulsteke C et al. N Engl J Med. 2026;394:1257-1269.
1) Kaplan-Meier survival data: – Key Secondary Endpoint: OS, ITT · 2) Slide: – Key Secondary Endpoint: pCR by Central Pathology Review · 3) Slide: – Immune-Mediated AEs and Infusion Reactions, safety population
🚨⭐ #ESMO26 |Abstract 4735O KEYNOTE-866 🟠
Perioperative pembrolizumab or placebo + neoadjuvant cisplatin and gemcitabine in muscle-invasive bladder cancer: Phase III KEYNOTE-866
🎤 Presented by Jens Bedke 🇩🇪
@OncoAlert
🔬 Can adding perioperative pembrolizumab to cisplatin-based neoadjuvant chemotherapy improve outcomes in cisplatin-eligible MIBC?
📊 STUDY DESIGN
Phase III, randomized, double-blind, placebo-controlled trial.
👥 N=907 patients with cisplatin-eligible MIBC.
🔹 Pembrolizumab + gemcitabine/cisplatin → radical cystectomy → adjuvant pembrolizumab (n=453)
🔹 Placebo + gemcitabine/cisplatin → radical cystectomy → adjuvant placebo (n=454)
Median follow-up: 60.9 months.
📊 KEY RESULTS
❌ Event-free survival (PRIMARY ENDPOINT)
• Median EFS: 74.1 months vs NR
• HR 0.88 (95% CI 0.71–1.10)
• p=0.1366
➡️ No statistically significant EFS improvement.
📈 Pathological complete response (pCR)
✅ 44.4% vs 35.8%
• Estimated difference: +8.9 percentage points (95% CI 2.5–15.1).
⚠️ Higher pCR did NOT translate into a statistically significant improvement in the primary EFS endpoint.
📊 Overall survival
• Median OS: NR in both arms
• HR 1.00 (95% CI 0.79–1.27)
➡️ No observed OS advantage.
pCR and OS were not formally tested for statistical significance under the hierarchical testing strategy.
🏥 Surgery
• Underwent cystectomy: 91.6% vs 87.9%.
⚠️ SAFETY
• Grade 3–5 treatment-emergent AEs: 80.2% vs 75.1%.
• Grade 3–5 immune-mediated AEs/infusion reactions: 8.9% vs 1.8%.
🔬 CONCLUSION
KEYNOTE-866 did not meet its primary EFS endpoint. Despite increased pCR rates, perioperative pembrolizumab added to neoadjuvant cisplatin/gemcitabine did not demonstrate a significant EFS benefit.
⭐ MY POINT OF VIEW | CLINICAL PEARL
A higher pathological response rate is encouraging, but it is not enough to redefine a standard of care.
In curative-intent MIBC, durable disease control and survival must drive treatment decisions.
📌 These findings do not support routinely adding perioperative pembrolizumab to neoadjuvant gemcitabine/cisplatin in cisplatin-eligible MIBC.
💡 More treatment does not necessarily mean better outcomes. The real challenge is identifying which patients benefit from intensification—and which do not.
🌍 GU Oncology Community
@urologysummit @gbanna74 @ravikanesvaran
@PGrivasMDPhD @tompowles1 @apolo_andrea @sonpavde @montypal @DrChoueiri @neerajaiims @HHammersMD @TiansterZhang @drenriquegrande @crisbergerot @DrDanielHeng @Silke_Gillessen @EfstathiouEleni @BraunMDPhD @brian_rini @AOmlin @DrYukselUrun @yekeduz_emre @cdanicas
@ecancer @UrologyTimes @urotoday @wearemedsir @OpenMedicineHQ @UCSFCancer
#BladderCancer #MIBC #GUOncology #ClinicalTrials #OncoAlertAF
1) Slide: Subsequent therapy, ITT population (Jens Bedke) · 2) Safety data: Common TEAEs (incidence ≥15% in either arm), safety population, all · 3) Slide: Simultaneous Annals of Oncology publication slide
Excellent presentation by Jens presenting results from KN866 trial that did not meet its primary endpoint in contrast with NIAGARA. Peri-op EV-pembro is the SOC in MIBC, awaiting VOLGA trial tomorrow! @myESMO #ESMO26 #ESMOAmbassadors @OncoAlert @Uromigos @shilpaonc @AndreaNecchi https://t.co/pDpZgq4etv https://t.co/dB1E6AlrWF
Kaplan-Meier survival data: EFS figure from journal pre-proof - pembrolizumab
KEYNOTE-866: No significant EFS benefit with perioperative pembro + gem/cis (HR 0.88, p=0.14) and no OS signal (HR 1.00).
Why did the control arm perform so well? More cT2 disease? No split-dose cisplatin? Important differences vs NIAGARA.
#ESMO26 @OncoAlert https://t.co/GWIiavQV7j
Kaplan-Meier survival data: primary endpoint - EFS by investigator assessment, ITT
#ESMO26 🚨 KEYNOTE-866: The final EFS analysis (N=907) of perioperative pembrolizumab + cisplatin/gemcitabine vs chemotherapy alone:
🔹 5-year EFS: 63.5% vs 61.9% (HR 0.88; p=0.137)
🔹 5-year OS: 70.8% vs 70.9% (HR 1.00)
🔹 pCR: 44.4% vs 35.8%
🔹 Grade 3–5 AEs: 80.2% vs 75.1%
Despite a numerically higher pCR rate, no significant EFS benefit emerged, and OS was virtually identical.
🚨In an evolving perioperative MIBC landscape, KEYNOTE-866 does not support adding pembrolizumab to cisplatin/gemcitabine.
@urotoday @myESMO
Slide: key secondary endpoint: pCR by central pathology review (ITT)
🎯 Starting the GU oral session! #ESMO26 @JensBedke presented the ph3 study in MIBC KN-866
A negative study of Cis-Gem + Pembro vs Cis-Gem periop.🤷♂️
What about NIAGARA study? 🤨 @OncoAlert @myESMO @DrFelixGuerrero @GuardConsortium @UroTarget https://t.co/dYEYe4TBwq
Key Secondary Endpoint: pCR by Central Pathology Re[view - cut off]
ITT Population(a)
[Bar chart: pCR Rate, % (95% CI), y-axis 0-100]
Estimated difference:(b) 8.9% (95% CI, 2.5-15.1)*
Pembro + cis + gem | Placebo + cis + gem
Table (right side cropped; placebo column not visible):
| Pembro + cis + gem n = 450 | [cropped]
pCR, n | 200 | [cropped]
pCR rate, % (95% CI) | 44.4 (39.8-49.2) | [cropped]
- pCR: defined as absence of viable tumo[r in] examined tissue from RC + PLND (pT0N[0]) [cropped]
- Participants who did not undergo RC + [PLND were] considered nonresponders [cropped]
(a)Excluding those who did not undergo RC + PLND and had a clinical CR.
(b)Based on the Miettinen-Nurminen method stratified by the randomization factors.
*Not formally statistically tested according to the statistical design.
Data cutoff: January 26, 2026.
🚨 Negative results from KEYNOTE-866 at #ESMO26.
Perioperative pembrolizumab added to neoadjuvant gemcitabine/cisplatin failed to significantly improve event-free survival in muscle-invasive bladder cancer (HR 0.88; 95% CI 0.71–1.10; P=0.1366).
#BladderCancer https://t.co/QzbD5VUnK6
Perioperative Pembrolizumab or Placebo Plus Neoadjuvant Cisplatin and Gemcitabine in Parti[cipants] With Muscle-Invasive Bladder Cancer: The Dou[ble-] Blind, Phase 3 KEYNOTE-866 Study [right edge cropped]
Jens Bedke(1); Peter Arkosy(2); Hiroyuki Nishiyama(3); Hakim Mahammedi(4); Christof Vulsteke(5); María José Juan-Fita(6); Igor Antonyan(7); Ossama Didas(8); Elena Verzoni(9); Vagif Atduev(10); Alejo Rodrigu[ez-Vida(11) - cropped]; Jong Jin Oh(12); Seok-Ho Kang(13); Avivit Peer(14); Ruslan Zukov(15); Nainy Jain(16); Sonia Franco(16); Blanca Homet Moreno(16); Christopher Hoimes(17); Arlene Siefker-Radtke(18)
(1)Department of Urology & Transplantation Surgery, Eva Mayr-Stihl Cancer Center, Klinikum Stuttgart, Stuttgart, Germany; (2)Debreceni Egyetem Klinikai K[...], Debrecen, Hungary; (3)University of Tsukuba Hospital, Tsukuba, Japan; (4)Centre Jean Perrin, Clermont-Ferrand, France; (5)Integrated Cancer Center Ghent, [AZ] Middelares, Ghent, Belgium, and Center for Oncological Research, Antwerp University, Antwerp, Belgium; (6)Instituto Valenciano de Oncologia, Valencia, S[pain]; (7)V.I. Shapoval Regional Medical Clinical Urology and Nephrology Center of Kharkiv Reg Council, Kharkiv, Ukraine; (8)Clinique Victor Hugo, Le Mans, Franc[e]; (9)IRCCS Istituto Nazionale dei Tumori di Milano, Genitourinary Medical Oncology, Milan, Italy; (10)Volga District Medical Center, Federal Medical-Biological A[gency], Novgorod, Russia; (11)Hospital del Mar, Barcelona, Spain; (12)Seoul National University Bundang Hospital, Seongnam-si, South Korea; (13)Korea University A[...], Seoul, South Korea; (14)Fishman Oncology Center, Rambam Health Care Campus, Haifa, Israel; (15)V.F. Voyno-Yasenetsky Krasnoyarsk State Medical Univ[ersity], Krasnoyarsk, Russia; (16)Merck & Co., Inc., Rahway, NJ, USA; (17)Duke University Medical Center, Durham, NC, USA; (18)MD Anderson Cancer Center, Hous[ton]
[Stage photo: presenter at podium; podium sign 'ESMO congress MADRID SPAIN 23-27 OCTOBER 2026'; chairs seated]
📢 #ESMO26 concomitant paper - Perioperative pembrolizumab or pbo + neoadjuvant cisplatin and gemcitabine in participants with muscle-invasive bladder cancer who are eligible for cisplatin: the double-blind, phase III KEYNOTE-866 study.
🔗https://t.co/Oircp9EPq2
@DrChrisHoimes https://t.co/DuF33x0e8q
Perioperative Pembrolizumab or PBO + Neoadjuvant Cisplatin and Gemcitabine in Participants with Muscle-Invasive #BladderCancer #MIBC: The Double-Blind, Phase 3 KEYNOTE-866 Study. Presented by Jens Bedke, MD. #ESMO26 written coverage by @chavarriagaj > https://t.co/TrbFgKk6v9 #Immunotherapy @myESMO
Statistical Considerations
Overall type I error rate controlled at α = 2.5% (1-sided) with graphical method of Maurer and Bretz
EFS (primary) 1-sided α = 0.025
→ 0.36 → pCR (key secondary) 1-sided α = 0
→ 0.64 → OS (key secondary) 1-sided α = 0
pCR ↔ OS: 1.0 / 1.0
IA2 was planned to occur when ~331 EFS events were observed (~60 months after first participant was randomly assigned)
OS and pCR rate were to be formally statistically tested only if the EFS null hypothesis was rejected
1) Trial design schema: Cohort 7 — SG + EV + zimberelimab in treatment-naive mUC · 2) Safety data: Cohort 7 — treatment exposure and safety (TEAEs/TRAEs) · 3) Response data: Cohort 7: SG + EV + zimberelimab in treatment-naive mUC - interim
The triplet of SG (TROP2 Topo1), EV (Nectin4/MMAE) and PD-1 triplet therapy has a response rate of 81% in 21 patients in advanced bladder cancer. Complimentary targets and payload make sense . These data should br taken forward in muscle invasive and advanced disease. Strategies to manage toxicity in bladder cancer is essential #ESMO26 @myESMO @OncoAlert
1) Slide: Cohort 7 title slide (Sweis et al., FPN-4742O) · 2) Trial design schema: Cohort 7: Study design · 3) Slide: Cohort 7: Efficacy outcomes table · 4) Response data: Cohort 7: Waterfall and spider plots of tumor response (INV)
Building on @DanaFarber_GU and @BradMcG04 DAD trial of EV/SG and adding PD1 shows ORR 81%.
1 PD with shrinkage !
Triplet therapies comping in bladder cancer ! Stay tuned for DAD-IO open @DanaFarber_GU @DanaFarber
@myESMO @OncoAlert #ESMO26 https://t.co/p4CbQasaxB
[Slide 1]
Sacituzumab Govitecan Combined With Enfortumab Vedotin and Zimberelimab in Treatment-Naive Metastatic Urothelial Cancer: Interim Results From Phase 1b TROPHY-U-01 Cohort 7
Randy F Sweis(1), Petros Grivas(2), Thomas Powles(3), Yohann Loriot(4), Ignacio Duran(5), Philippe Barthélémy(6), Jae Lyun Lee(7), Sang-Joon Shin(8), Andrea Necchi(9,10), Alejandro Recio-Boiles(11), Manoti Marya(12), Jana Waldes(12), Eliza Harting(12), Freda Boateng(12), Bradley A McGregor(13)
(1)University of Chicago, Chicago, IL, USA; (2)University of Washington, Fred Hutch Cancer Center, Seattle, WA, USA; (3)Barts Cancer Centre, Queen Mary University of London, London, UK; (4)Gustave Roussy, Université Paris-Saclay, Villejuif, France; (5)Hospital Universitario Marqués de Valdecilla IDIVAL, Santander, Cantabria, Spain; (6)University Hospital Strasbourg, Strasbourg, France; (7)Asan Medical Center, University of Ulsan College of Medicine, Seoul, South Korea; (8)Severance Hospital, Yonsei University Health System, Seoul, South Korea; (9)Vita-Salute San Raffaele University, Milan, Italy; (10)IRCCS San Raffaele Hospital, Milan, Italy; (11)University of Arizona Cancer Center, Tucson, AZ, USA; (12)Gilead Sciences, Inc., Foster City, CA, USA; (13)Dana-Farber Cancer Institute, Boston, MA, USA
Friday, October 23, 2026; 13:50-14:00
FPN-4742O
[Slide 2]
TROPHY-U-01 Cohort 7: Study Design
Adults with histologically documented, previously untreated, locally advanced unresectable or metastatic urothelial cancer:
• Measurable disease by CT/MRI per RECIST 1.1
• Archival tumor tissue or fresh biopsy
• No prior systemic therapy for locally advanced or metastatic UC (curative therapy allowed if recurrence occurred > 12 months since last systemic treatment)
• ECOG performance status 0-1
SG(a) + EV(b) + ZIM(c) Safety lead-in Planned N = 12 to 36
SG (7.5 mg/kg) + EV(b) + ZIM(c) Stage 1 expansion Planned N = up to 20
End points
Primary
• Safety and tolerability
• Confirmed ORR (INV, RECIST 1.1)
Secondary(d)
• DOR, CBR, and PFS (INV, RECIST 1.1)
• OS
• DLTs were SG-related toxicities in safety lead-in participants who completed all cycle 1 dosing and 21-day evaluation period
• Primary granulocyte colony stimulating factor prophylaxis from cycle 1 was mandatory during each cycle unless clinically contraindicated per investigator
• At data snapshot (July 24, 2026), 21 participants (safety lead-in n = 13, expansion n = 8) were enrolled; median follow-up was 12.2 months
• SG 7.5 mg/kg was used for expansion
(a)SG 7.5 mg/kg administered on days 1 and 8 of a 21-day cycle (SG 7.5 mg/kg was planned for safety lead-in; based on the incidence of DLTs, 5 mg/kg and 10 mg/kg doses could be evaluated). (b)EV doses of 1.25 mg/kg are administered on days 1 and 8 of a 21-day cycle. (c)ZIM doses of 360 mg are administered on day 1 of a 21-day cycle. (d)Efficacy results in this presentation are based on INV; BICR- and iRECIST-related analyses are not included.
BICR, blinded independent central review; CBR, clinical benefit rate; CT, computed tomography; DLT, dose-limiting toxicity; DOR, duration of response; ECOG, Eastern Cooperative Oncology Group; EV, enfortumab vedotin; INV, investigator assessment; iRECIST, modified RECIST 1.1 for immune-based therapeutics; MRI, magnetic resonance imaging; ORR, objective response rate; OS, overall survival; PFS, progression-free survival; RECIST, Response Evaluation Criteria in Solid Tumors; SG, sacituzumab govitecan; UC, urothelial cancer; ZIM, zimberelimab.
Randy F Sweis, MD
[Slide 3]
Efficacy outcomes
Variable | Cohort 7 (n = 21)
Median follow-up (range), months | 12.2 (1.3-20.8)
Objective response rate,(a) n (%) (95% CI) | 17 (81) (58-95)
Best overall response, n (%)
Complete response | 3 (14)
Partial response | 14 (67)
Stable disease | 1 (5)
Stable disease ≥ 6 months | 1 (5)
Progressive disease | 1 (5)
Not evaluable/not assessed | 2 (10)
Variable | Cohort 7 (n = 21)
Clinical benefit rate,(b) n (%) (95% CI) | 18 (86) (64-97)
Median DOR(c) (95% CI), months | 16.7 (4.9-NE)
9-month DOR, % (95% CI) | 89 (43-98)
12-month DOR, % (95% CI) | 76 (33-94)
Median time to response(d) (range), months | 2.5 (1.2-4.2)
Achieving response ≤3 months, n (%) | 14/17 (82)
Median PFS (95% CI), months | 19.3 (10.6-NE)
12-month PFS, % (95% CI) | 73 (41-89)
Median OS (95% CI), months | NR (12.2-NE)
The combination of SG, EV, and ZIM demonstrated promising objective responses and survival outcomes
Data snapshot date: July 24, 2026.
Response rates and PFS were by investigator assessment. (a)Objective response rate is defined as the proportion of participants who achieved a best overall response of CR/PR. (b)Clinical benefit rate is defined as proportion of participants with CR + PR + SD ≥ 6 months. (c)Duration of response is calculated based on the time between the first date showing a documented response of CR or PR and the date of progression or death. (d)Time to response is defined as time between the first dose date to the first documented PR/CR.
CR, complete response; DOR, duration of response; NE, not estimable; NR, not reached; OS, overall survival; PFS, progression-free survival; PR, partial response; SD, stable disease.
Randy F Sweis, MD
[Slide 4]
Best Percent Change in Target Lesion Diameters and Tumor Response by Investigator Assessment
Best Percent Change from Baseline in Total Sum of Target Lesion Diameters
[Waterfall plot; y-axis Best Percent Change From Baseline (100 to -100); x-axis Participant]
Best overall response: Complete response (n = 3); Partial response (n = 14); Stable disease (n = 1); Progressive disease (n = 1)
Spider Plot of Tumor Response per Investigator Assessment
[Spider plot; y-axis Percent Change From Baseline – Target Lesions (100 to -100); x-axis Weeks (0-90)]
Best overall response: Complete response; Partial response; Stable disease; Progressive disease
+ sign indicates treatment is still ongoing for the participant. Dotted line indicates partial response with a 30% reduction per RECIST.
Tumor shrinkage occurred in all evaluable participants and the responses were durable
Data snapshot date: July 24, 2026.
Randy F Sweis, MD
[Slide 2]
13:30 - 15:00 Proffered paper 1: Genitourinary tumour, renal and urothelial
CHAIRS: AXEL BEX, ANJA LORCH
Efficacy outcomes
| Variable | Cohort 7 (n = 21) |
Median follow-up (range), months | 12.2 (1.3-20.8)
Objective response rate,^a n (%) (95% CI) | 17 (81) (58-95)
Best overall response, n (%)
Complete response | 3 (14)
Partial response | 14 (67)
Stable disease | 1 (5)
Stable disease ≥ 6 months | 1 (5)
Progressive disease | 1 (5)
Not evaluable/not assessed | 2 (10)
| Variable | Cohort 7 (n = 21) |
Clinical benefit rate,^b n (%) (95% CI) | 18 (86) (64-97)
Median DOR^c (95% CI), months | 16.7 (4.9-NE)
9-month DOR, % (95% CI) | 89 (43-98)
12-month DOR, % (95% CI) | 76 (33-94)
Median time to response^d (range), months | 2.5 (1.2-4.2)
Achieving response ≤3 months, n (%) | 14/17 (82)
Median PFS (95% CI), months | 19.3 (10.6-NE)
12-month PFS, % (95% CI) | 73 (41-89)
Median OS (95% CI), months | NR (12.2-NE)
The combination of SG, EV, and ZIM demonstrated promising objective responses and survival outcomes
Data snapshot date: July 24, 2026
Response rates and PFS were by investigator assessment. ^aObjective response rate is defined as the proportion of participants who achieved a best overall response of CR/PR. ^bClinical benefit rate is defined as proportion of participants with CR + PR + SD ≥ 6 months. ^cDuration of response is calculated based on the time between the first date showing a documented response of CR or PR and the date of progression or death. ^dTime to response is defined as time between the first dose date to the first documented PR/CR.
CR, complete response; DOR, duration of response; NE, not estimable; NR, not reached; OS, overall survival; PFS, progression-free survival; PR, partial response; SD, stable disease.
Randy F Sweis, MD
[Speaker panel] Randy Sweis — Sacituzumab Govitecan (SG) Combined With Enfortumab Vedotin (EV) and Zimberelimab (ZIM) in Treatment-Naive Metastatic Urothelial Cancer (mUC): Interim Results From Phase 1b TROPHY-U-01 Cohort 7
BARCELONA AUDITORIUM - HALL 9
[Slide 4]
13:30 - 15:00 Proffered paper 1: Genitourinary tumour, renal and urothelial
CHAIRS: AXEL BEX, ANJA LORCH
Conclusions
• SG + EV + ZIM showed manageable toxicity and tolerability over 12 months of median follow-up in participants with treatment-naive mUC
– No treatment-related deaths were observed
– Discontinuation rate due to TRAEs for any agent was 33% (highest rate was reported for EV)
– The overall safety findings were consistent with the established toxicity profiles of SG, EV, and ZIM
• SG + EV + ZIM demonstrated promising antitumor activity, with early and durable responses
– Objective response was achieved in 81% of the participants; median DOR was 16.7 months
– Median PFS was 19.3 months, and median OS was not reached
• These findings support further investigation of immunotherapy combinations that include ADCs with different mechanisms of action in patients with UC
– Ongoing Gilead-supported studies of SG in combination with immunotherapy include the phase 2 DAD/DAD-IO (NCT04724018) study sponsored by the DFCI, and the phase 3 ECOG-ACRIN EA8231 (NCT06524544) study
DFCI, Dana-Farber Cancer Institute; EV, enfortumab vedotin; mUC, metastatic urothelial cancer; SG, sacituzumab govitecan; ZIM, zimberelimab
Randy F Sweis, MD
BARCELONA AUDITORIUM - HALL 9
Slide: Cohort 7 — Best Percent Change in Target Lesion Diameters and Spider Plot
Exciting data from @RandySweis @UCCancerCenter, @BradMcG04 @DanaFarber & others for the combination of SG + EV + ZIM in pts with mUC. Certainly considerations around toxicity necessary, but impressive response rates. #ESMO26 https://t.co/Afy1pe9mQI
Best Percent Change in Target Lesion Diameters and Tumor Response by Investigator Assessment
Best Percent Change from Baseline in Total Sum of Target Lesion Diameters
Best overall response
■ Complete response (n = 3)
■ Partial response (n = 14)
■ Stable disease (n = 1)
■ Progressive disease (n = 1)
[Waterfall plot; y-axis: Best Percent Change From Baseline (100, 60, 0, -60, -100); x-axis: Participant]
Spider Plot of Tumor Response per Investigator Assessment
Best overall response: ■ Complete response ■ Partial response ■ Stable disease ■ Progressive disease
[Spider plot; y-axis: Percent Change From Baseline – Target Lesions (100 to -100); x-axis: Weeks (0-90)]
+ sign indicates treatment is still ongoing for the participant. Dotted line indicates partial response with a 30% reduction per RECIST.
Tumor shrinkage occurred in all evaluable participants and the responses were durable
Data snapshot date: July 24, 2026.
Randy F Sweis, MD
[Webcast overlay:] 13:30 - 15:00 Proffered paper 1: Genitourinary tumour, renal and urothelial
CHAIRS: AXEL BEX, ANJA LORCH
Randy Sweis — Sacituzumab Govitecan (SG) Combined With Enfortumab Vedotin (EV) and Zimberelimab (ZIM) in Treatment-Naive Metastatic Urothelial Cancer (mUC): Interim Results From Phase 1b TROPHY-U-01 Cohort 7
BARCELONA AUDITORIUM - HALL 9
Slide: Cohort 7: Most common treatment-emergent vs treatment-related AEs (low-res)
🚨⭐🟠 #ESMO26 | Abstract 4742O | TROPHY-U-01 Cohort 7
Sacituzumab Govitecan + Enfortumab Vedotin + Zimberelimab in Treatment-Naïve Metastatic Urothelial Cancer: Phase Ib Interim Results
🎤 Presented by @RandySweisMD 🇺🇸
@OncoAlert
🔬 Dual ADC targeting + PD-1 blockade: a promising new strategy in 1L metastatic urothelial cancer?
Combining two ADCs targeting different antigens (Trop-2 and Nectin-4) with distinct cytotoxic payloads (SN-38 and MMAE), plus PD-1 inhibition.
📊 STUDY DESIGN
Phase Ib | Cohort 7 | N=21
SG + EV + zimberelimab (ZIM)
Median follow-up: 12.2 months.
📊 KEY EFFICACY RESULTS
✅ Objective Response Rate: 81% (17/21)
• Complete responses: 14% (3/21)
• Partial responses: 67% (14/21)
• Clinical benefit rate: 86%
📈 Duration of Response
• Median DoR: 16.7 months
• 12-month DoR rate: 76%
• 82% of responders maintained response ≥6 months.
✅ Progression-Free Survival
• Median PFS: 19.3 months (95% CI 10.6–NE)
• 12-month PFS: 73%
📊 Overall Survival
• Median OS: Not reached.
⚠️ SAFETY
• Grade ≥3 treatment-emergent AEs: 67%
• Grade ≥3 treatment-related AEs: 52%
• Treatment-related discontinuation of ≥1 drug: 33%
• No treatment-related deaths.
⭐ MY POINT OF VIEW | CLINICAL PEARL
An 81% ORR with encouraging durability is a compelling signal—but response rates alone do not establish a new standard of care.
🔬 Dual ADC therapy introduces an intriguing strategy: targeting different antigens while delivering complementary cytotoxic payloads.
However, this is a small, single-arm phase Ib cohort (n=21), with substantial toxicity and limited follow-up.
💡 The critical question is not whether we can intensify EV-based therapy, but whether a third agent provides meaningful additional survival benefit without compromising tolerability or quality of life.
📌 Randomized trials are essential before challenging EV + pembrolizumab as the established 1L standard.
🌍 GU Oncology Community
@gbanna74 @ravikanesvaran @urologysummit
@tompowles1 @PGrivasMDPhD @apolo_andrea @sonpavde @AndreaNecchi @drenriquegrande @DrYukselUrun @yekeduz_emre @cdanicas
@ecancer @UrologyTimes @urotoday @wearemedsir @OpenMedicineHQ @UCSFCancer
#BladderCancer #UrothelialCancer #GUOncology #ADC #ClinicalTrials
Most Common Treatment-Emergent vs Treatment-Related AEs
Legend: Any grade | Grade ≥ 3
[Butterfly bar chart, TEAEs % (left) vs TRAEs % (right); AE row labels and bar values illegible at this resolution — first rows appear to be Fatigue, Decreased appetite, Diarrhea, Alopecia, Nausea [partially illegible]]
• The most common treatment-related AEs were fatigue, decreased appetite, diarrhea, alopecia, and nausea
• 20/21 (95%) participants received primary G-CSF prophylaxis from cycle 1. Grade 3 neutropenia(a) was reported in 3/21 participants, including 1 participant who did not receive primary G-CSF prophylaxis. All three events occurred during cycle 1
Overall safety data were consistent with the known toxicity profile of SG, EV, and ZIM
[footnotes illegible] Data snapshot date: July 24, 2026 [partially legible]
Randy F Sweis, MD
Slide: Cohort 7 — Most Common Treatment-Emergent vs Treatment-Related AEs (Randy F Sweis, MD)
Is it time for triplets in frontline la/mUC?
Really enjoyed hearing Randy Sweis present SG + EV + zimberelimab in TROPHY-U-01 Cohort 7.
Impressive ORR of 81%, median PFS 19.3 mo (n=21).
Promising early data, but larger studies needed to assess added benefit and toxicity.
#ESMO26 @OncoAlert
Most Common Treatment-Emergent vs Treatment-Related AEs
■ Any grade ■ Grade ≥ 3
[Butterfly bar chart: TEAEs, % (left) vs TRAEs, % (right); axis 100 80 60 40 20 0 20 40 60 80 100. Row labels top to bottom: Fatigue, Decreased appetite, Diarrhea, Alopecia, Nausea, Constipation, Neuropathy peripheral, ALT increase, Dysgeusia, Peripheral sensory neuropathy, Pruritus, Rash, Anemia, Arthralgia, AST increase, Dry eye, Pyrexia, Vomiting, Abdominal pain, Dizziness, IRR, Lacrimation increased, Lipase increase, Neutropenia^a, Amylase increase, Rhinorrhea, Stomatitis, Rash maculopapular, Spinal fracture. Per-bar numeric labels are printed inside bars but too small to transcribe reliably — not transcribed.]
TEAEs, % TRAEs, %
• The most common treatment-related AEs were fatigue, decreased appetite, diarrhea, alopecia, and nausea
• 20/21 (95%) participants received primary G-CSF prophylaxis from cycle 1. Grade 3 neutropenia^a was reported in 3/21 participants, including 1 participant who did not receive primary G-CSF prophylaxis. All three events occurred during cycle 1
Overall safety data were consistent with the known toxicity profile of SG, EV, and ZIM
Data snapshot date: July 24, 2026. TEAEs were included if they occurred in ≥ 20% (any-grade) or ≥ 10% (grade ≥ 3) of participants. ^aNeutropenia includes neutropenia, neutrophil count decreased, and febrile neutropenia.
AE, adverse event; ALT, alanine aminotransferase; AST, aspartate aminotransferase; EV, enfortumab vedotin; G-CSF, granulocyte colony-stimulating factor; IRR, infusion-related reaction; SLI, safety lead-in; SG, sacituzumab govitecan; TEAE, treatment-emergent adverse event; TRAE, treatment-related adverse event; ZIM, zimberelimab.
Randy F Sweis, MD
Slide: Cohort 7 demographics and baseline characteristics
#RandySweis showing data from EV-SG-zim in 1st line met #urothelialcancer — small sample size but high ORR 81% including 3 pts w CRs. Pushing depth of response for met UC.
@oncoalert #ESMO26 @myESMO https://t.co/bCt3GBlOd9
#ESMO26 Can two ADCs + IO push response rates even higher in 1L metastatic urothelial cancer?
🚨TROPHY-U-01 Cohort 7, evaluating sacituzumab govitecan + enfortumab vedotin + zimberelimab (N=21).
🔹 ORR 81%, including 14% CR
🔹 Median DOR 16.7 months
🔹 Median PFS 19.3 months
🔹 Median OS not reached
🔹 Grade ≥3 treatment-related AEs: 52%; 33% discontinued ≥1 agent
Impressive early activity from dual ADC targeting Trop-2 + Nectin-4, but the key question is whether the added efficacy justifies the toxicity over EV+pembrolizumab.
@UroToday @myESMO
[Slide 1]
TROPHY-U-01 Cohort 7: Study Design
Adults with histologically documented, previously untreated, locally advanced unresectable or metastatic urothelial cancer:
• Measurable disease by CT/MRI per RECIST 1.1
• Archival tumor tissue or fresh biopsy
• No prior systemic therapy for locally advanced or metastatic UC (curative therapy allowed if recurrence occurred > 12 months since last systemic treatment)
• ECOG performance status 0-1
SG(a) + EV(b) + ZIM(c)
Safety lead-in
Planned N = 12 to 36
SG (7.5 mg/kg) + EV(b) + ZIM(c)
Stage 1 expansion
Planned N = up to 20
End points
Primary
• Safety and tolerability
• Confirmed ORR (INV, RECIST 1.1)
Secondary(d)
• DOR, CBR, and PFS (INV, RECIST 1.1)
• OS
• DLTs were SG-related toxicities in safety lead-in participants who completed all cycle 1 dosing and 21-day evaluation period
• Primary granulocyte colony stimulating factor prophylaxis from cycle 1 was mandatory during each cycle unless clinically contraindicated per investigator
• At data snapshot (July 24, 2026), 21 participants (safety lead-in n = 13, expansion n = 8) were enrolled; median follow-up was 12.2 months
• SG 7.5 mg/kg was used for expansion
[Slide 2]
Safety Summary
Participants, n (%) | Cohort 7 (n = 21)
Median treatment duration (range), months
SG 8.0 (0-18)
EV 7.6 (0-16)
ZIM 9.7 (0-20)
Any TEAE/grade ≥ 3 TEAE 21 (100)/14 (67)
Any TRAE/grade ≥ 3 TRAE 21 (100)/11 (52)
Participants, n (%) | Cohort 7 (n = 21)
TRAEs leading to any drug discontinuation 7 (33)
Discontinuation of SG 4 (19)
Discontinuation of EV 6 (29)
Discontinuation of ZIM 1 (5)
TEAE leading to death 0
DLT(a) 1/12 (8)
• 3 participants died of disease progression; there were no treatment-related deaths
[Slide 3]
Efficacy outcomes
Variable | Cohort 7 (n = 21)
Median follow-up (range), months 12.2 (1.3-20.8)
Objective response rate,(a) n (%) (95% CI) 17 (81) (58-95)
Best overall response, n (%)
Complete response 3 (14)
Partial response 14 (67)
Stable disease 1 (5)
Stable disease ≥ 6 months 1 (5)
Progressive disease 1 (5)
Not evaluable/not assessed 2 (10)
Variable | Cohort 7 (n = 21)
Clinical benefit rate,(b) n (%) (95% CI) 18 (86) (64-97)
Median DOR(c) (95% CI), months 16.7 (4.9-NE)
9-month DOR, % (95% CI) 89 (43-98)
12-month DOR, % (95% CI) 76 (33-94)
Median time to response(d) (range), months 2.5 (1.2-4.2)
Achieving response ≤3 months, n (%) 14/17 (82)
Median PFS (95% CI), months 19.3 (10.6-NE)
12-month PFS, % (95% CI) 73 (41-89)
Median OS (95% CI), months NR (12.2-NE)
The combination of SG, EV, and ZIM demonstrated promising objective responses and survival outcomes
Data snapshot date: July 24, 2026 [partially cut off]
[Slide 4]
Swimmer Plot of Tumor Response by Investigator Assessment
[swimmer plot, x-axis Months 0-24]
Legend: Time to first assessment; Progressive disease; Discontinued treatment; Complete response; Treatment ongoing; Not estimable; Partial response; Response assessment; Stable disease; Death date
Responses were sustained or deepened over time and most participants were still on treatment at the time of data snapshot
Data snapshot date: July 24, 2026.
Safety Summary
Participants, n (%) | Cohort 7 (n = 21)
Median treatment duration (range), months
SG 8.0 (0-18)
EV 7.6 (0-16)
ZIM 9.7 (0-20)
Any TEAE/grade ≥ 3 TEAE 21 (100)/14 (67)
Any TRAE/grade ≥ 3 TRAE 21 (100)/11 (52)
Participants, n (%) | Cohort 7 (n = 21)
TRAEs leading to any drug discontinuation 7 (33)
Discontinuation of SG 4 (19)
Discontinuation of EV 6 (29)
Discontinuation of ZIM 1 (5)
TEAE leading to death 0
DLT^a 1/12 (8)
• 3 participants died of disease progression; there were no treatment-related deaths
Data snapshot date: July 24, 2026.
^a1/13 SLI participants was not DLT evaluable; the 1 DLT event was febrile neutropenia lasting < 24 hours.
AE, adverse event; DLT, dose-limiting toxicity; EV, enfortumab vedotin; SLI, safety lead-in; SG, sacituzumab govitecan; TEAE, treatment-emergent adverse event; TRAE, treatment-related adverse event; ZIM, zimberelimab.
Randy F Sweis, MD
1) Trial design schema: KEYNOTE-905/EV-303 study design (NCT03924895) · 2) Kaplan-Meier survival data: KEYNOTE-905 EFS, ad hoc 3-arm ITT analysis · 3) Kaplan-Meier survival data: KEYNOTE-905 OS, ad hoc 3-arm ITT analysis · 4) Slide: KEYNOTE-905 pathological downstaging, ad hoc 3-arm ITT analysis
The KN905 MIBC trial includes a 3rd, less celebrated arm of single agent pembro. Results show pembro delivers an important contribution to the EVP. The trial is small and EVP performs better, but pCR rates for pembro of 35% are in the same range as neoadjuvant cisplatin chemo while EFS/OS HRs of 0.71/O.76 vs surgery are impressive. Pembro had about half the toxicity of EVP, underlining the relevance of therapy duration. VOLGA (3 cycles of EVD), is a half way between Pembro alone and 9 cycles of EVP. @Annals_Oncology #ESMO26 @Annals_Oncology @OncoAlert
[Slide 1]
KEYNOTE-905/EV-303 Study (NCT03924895)
Key Eligibility Criteria
• Adults with muscle-invasive bladder cancer (MIBC)
• Clinical stage T2-T4aN0M0 or T1-T4aN1M0 by central assessment
• ≥50% Urothelial histology
• Cisplatin-ineligible per Galsky criteria(a) or cisplatin-declining
• ECOG PS 0-2
Stratification Factors
• Cisplatin eligibility (ineligible vs. eligible but declining)
• Clinical stage (T2N0 vs. T3/T4aN0 vs. T1-4aN1)
• Region (US vs. EU vs. most of world)
[Schema: R →]
Randomization stopped in November 2022
Pembrolizumab 200 mg IV Q3W 3 cycles → RC + PLND → Pembrolizumab 200 mg IV Q3W 14 cycles
→ RC + PLND → Observation(b)
Opened in August 2020
Enfortumab vedotin 1.25 mg/kg IV day 1 and day 8 Q3W 3 cycles + Pembrolizumab 200 mg IV Q3W 3 cycles → RC + PLND → Enfortumab vedotin 1.25 mg/kg IV day 1 and day 8 Q3W 6 cycles + Pembrolizumab 200 mg IV Q3W 14 cycles
Primary endpoint: EFS by BICR for EV + pembro and RC + PLND vs. RC + PLND alone
Key secondary endpoints: OS and pCR (pT0N0, i.e. absence of viable tumor in examined tissue from surgery) by central pathologist review for EV + pembro and RC + PLND vs. RC + PLND alone
Other secondary endpoints include: Pathological downstaging (pDS; <pT2 and N0) by central pathologist review, safety
BICR, blinded independent central review; IV, intravenous; Q3W, every 3 weeks. (a)Per protocol, defined as having ≥1 of: impaired renal function (creatinine clearance 30–59 mL/min), ECOG PS 2, gr ≥2 [remainder cut off at image edge]
[Slide 2]
Event-Free Survival
Ad Hoc Analysis ITT Population
[KM curves; y-axis: Event-free survival, %; x-axis: Months]
Landmarks: 12 mo 77.2% / 66.4% / 55.0%; 24 mo 75.8% / 55.8% / 41.0%; 36 mo 69.5% / 49.6% / 37.4%
| EV + pembro (n = 85) | Pembro (n = 83) | Control (n = 87)
Events, n (%) | 27 (31.8) | 41 (49.4) | 52 (59.8)
Median (95% CI) | NR (41.2–NR) | 28.7 mo (13.9–NR) | 15.7 mo (9.5–31.6)
HR(a) vs. Control (95% CI) | 0.40 (0.25–0.65) | 0.71 (0.47–1.07) |
No. at Risk (0, 6, 12, 18, 24, 30, 36, 42, 48, 54, 60 mo)
EV + pembro: 85 70 59 57 55 42 35 16 3 0 0
Pembro: 83 62 52 44 41 27 22 13 3 0 0
Control: 87 56 44 37 32 22 14 9 1 0 0
mo, months; NR, not reached. (a)Comparison analysis was descriptive only (not a prespecified hypothesis test).
Data cutoff date: 6 June 2025
Survival table
Endpoint: Event-free survival (ad hoc analysis ITT population)
Arm | N | Median | Median CI
EV + pembro | 85 | NR | 41.2–NR
Pembro | 83 | 28.7 mo | 13.9–NR
Control (RC + PLND alone) | 87 | 15.7 mo | 9.5–31.6
HR: EV + pembro vs control 0.40; Pembro vs control 0.71
HR CI: 0.25–0.65; 0.47–1.07
Landmark rates:
12 mo: EV + pembro 77.2% | Pembro 66.4% | Control 55.0%
24 mo: EV + pembro 75.8% | Pembro 55.8% | Control 41.0%
36 mo: EV + pembro 69.5% | Pembro 49.6% | Control 37.4%
[Slide 3]
Overall Survival
Ad Hoc Analysis ITT Population
[KM curves; y-axis: Overall survival, %; x-axis: Months]
Landmarks: 12 mo 83.3% / 78.2% / 74.6%; 24 mo 78.4% / 66.9% / 62.6%; 36 mo 74.5% / 61.4% / 55.7%
| EV + pembro (n = 85) | Pembro (n = 83) | Control (n = 87)
Events, n (%) | 23 (27.1) | 34 (41.0) | 42 (48.3)
Median (95% CI) | NR (NR–NR) | 51.0 mo (32.0–NR) | 41.7 mo (26.4–NR)
HR(a) vs. Control (95% CI) | 0.48 (0.29–0.80) | 0.76 (0.48–1.20) |
No. at Risk (0, 6, 12, 18, 24, 30, 36, 42, 48, 54, 60 mo)
EV + pembro: 85 79 70 64 63 56 45 28 10 0 0
Pembro: 83 76 64 57 53 45 31 22 7 0 0
Control: 87 72 64 54 51 45 30 18 6 0 0
mo, months; NR, not reached. (a)Comparison analysis was descriptive only (not a prespecified hypothesis test).
Data cutoff date: 6 June 2025
Survival table
Endpoint: Overall survival (ad hoc analysis ITT population)
Arm | N | Median | Median CI
EV + pembro | 85 | NR | NR–NR
Pembro | 83 | 51.0 mo | 32.0–NR
Control (RC + PLND alone) | 87 | 41.7 mo | 26.4–NR
HR: EV + pembro vs control 0.48; Pembro vs control 0.76
HR CI: 0.29–0.80; 0.48–1.20
Landmark rates:
12 mo: EV + pembro 83.3% | Pembro 78.2% | Control 74.6%
24 mo: EV + pembro 78.4% | Pembro 66.9% | Control 62.6%
36 mo: EV + pembro 74.5% | Pembro 61.4% | Control 55.7%
[Slide 4]
Pathological Downstaging
Ad Hoc Analysis ITT Population
[Bar chart; y-axis: pDS, % (95% CI)] EV + pembro 65.9 | Pembro 33.7 | Control 14.9
| EV + pembro (n = 85) | Pembro (n = 83) | Control (n = 87)
pDS, n | 56 | 28 | 13
pDS rate, % (95% CI) | 65.9 (54.8–75.8) | 33.7 (23.7–44.9) | 14.9 (8.2–24.2)
Estimated(a) difference vs. Control, % (95% CI) | 51.0 (37.5–62.5) | 19.6 (6.9–32.1) |
• pDS: <pT2 and N0 in examined tissue from RC + PLND by central pathologist review
•
(a)Determined based on stratified Miettinen & Nurminen method and may vary slightly from the numerical difference. Comparison analysis was descriptive only (not a prespecified hypothesis test).
Data cutoff date: 6 June 2025
1) Slide: Summary of Analysis Populations - KEYNOTE-905 ad hoc analysis · 2) Slide: Summary and Conclusions - KEYNOTE-905 ad hoc analysis (in-room photo) · 3) Response data: Pathological Complete Response - Ad Hoc Analysis ITT
Perioperative EV + Pembro momentum by #DrAndersUllen in KEYNOTE-905 Ph.III ad hoc analysis of cis-ineligible MIBC.
2-yr EFS: 75.8% EV/Pembro vs 55.8% Pembro vs 41.0% surgery alone.
EFS HR 0.40 vs 0.71 (each vs control).
pCR 58.8% vs 25.3% vs 10.3%.
#ESMO26 #BladderCancer @myESMO @OncoAlert
[Slide 1]
Summary of Analysis Populations
Present ad hoc analysis ITT population (n = 255)
An ad hoc analysis was performed in participants concurrently randomized to all 3 arms between Aug 2020 and Nov 2022
Primary analysis (n = 344)
All concurrently randomized participants to the EV + pembro vs. control arms, presented previously^1
[Timeline bars]
Pembro monotherapy (n = 166)
Control (RC + PLND alone; n = 346)
EV + pembro (n = 170)
2019: Study start
Aug 2020: EV + pembro arm opened
Nov 2022: Enrollment to pembro arm stopped
2024: Last participant enrolled
1. Vulsteke C et al. N Engl J Med 2026.
[Slide 3]
Summary and Conclusions
- In this ad hoc analysis of participants with MIBC who were cisplatin-ineligible or cisplatin-declining and were concurrently randomized to all 3 KEYNOTE-905 study arms:
- EFS and OS favored perioperative EV + pembro compared with RC + PLND alone
- Perioperative pembro was associated with numerically better EFS and OS compared with RC + PLND alone
- pCR and pDS rates favored perioperative EV + pembro or pembro versus RC + PLND alone
- Safety results with perioperative EV + pembro or pembro were generally consistent with the known safety profiles of the individual drugs, the underlying disease and/or surgery, or the preexisting comorbidities within the study population
- The pattern of efficacy outcomes across all 3 KEYNOTE-905 study arms was consistent with a contribution of both EV and pembro to the observed activity of the perioperative EV + pembro regimen in participants with MIBC who are cisplatin-ineligible
- However, these observations should be interpreted with caution due to the ad hoc nature of this analysis
- Perioperative EV + pembro is approved for patients with MIBC irrespective of eligibility for cisplatin-based neoadjuvant therapy, representing a new standard of care in this setting
[Slide 4]
Pathological Complete Response
Ad Hoc Analysis ITT Population
[Bar chart] pCR, % (95% CI): EV + pembro 58.8; Pembro 25.3; Control 10.3
| | EV + pembro (n = 85) | Pembro (n = 83) | Control (n = 87) |
pCR, n | 50 | 21 | 9
pCR rate, % (95% CI) | 58.8 (47.6-69.4) | 25.3 (16.4-36.0) | 10.3 (4.8-18.7)
Estimated^a difference vs. Control, % (95% CI) | 48.6 (35.6-60.1) | 15.7 (4.4-27.4) |
- pCR: absence of viable tumor (pT0N0) in examined tissue from RC + PLND by central pathologist review
- Participants who did not undergo surgery, including those with clinical complete response after neoadjuvant therapy, were considered nonresponders
^aDetermined based on stratified Miettinen & Nurminen method and may vary slightly from the numerical difference.
Comparison analysis was descriptive only (not a prespecified hypothesis test).
Data cutoff date: 6 June 2025
1) Trial design schema: discussant (van der Heijden) - response-adapted · 2) Trial design schema: discussant (van der Heijden) on stage · 3) Biomarker data: discussant (van der Heijden) - response-adapted
#ESMO26 Very thoughtful and balanced discussion of VOLGA trial by @MichvdHeijden , putting EV-D in perspective with EV-303/B15 on efficacy & safety.
Adding treme = more tox, no efficacy/OS gain.
Less is more!
Takeaway for next steps:
response-adapted adjuvant therapy?
@myESMO @tompowles1 @brian_rini @Uromigos
1) Response data: KEYNOTE-905/EV-303 pathological complete response - ad · 2) Safety data: KEYNOTE-905/EV-303 most common all-cause AEs, all phases
#ESMO26 How much does each drug contribute to perioperative EV + pembrolizumab in MIBC?
🚨A 3-arm analysis of KEYNOTE-905/EV-303 (N=255).
EV+P vs P alone vs surgery:
🔹 3-year EFS: 69.5% vs 49.6% vs 37.4%
🔹 pCR: 58.8% vs 25.3% vs 10.3%
🔹 Pathologic downstaging: 65.9% vs 33.7% vs 14.9%
🔹 EFS HR vs surgery: 0.40 with EV+P; 0.71 with P alone
📌The efficacy gradient suggests both EV and pembrolizumab contribute to the combination's activity, with substantially greater benefit from EV+P.
📌Important caveat: descriptive, ad hoc analysis without formal statistical testing.
@UroToday @myESMO
1) Slide: Summary of Analysis Populations - KEYNOTE-905 ad hoc · 2) Kaplan-Meier survival data: Event-Free Survival - Ad · 3) Kaplan-Meier survival data: Overall Survival - Ad Hoc
🚨⭐🟠 #ESMO26 | Abstract 4733O | KEYNOTE-905 / EV-303
Perioperative Pembrolizumab or Enfortumab Vedotin + Pembrolizumab in Cisplatin-Ineligible Muscle-Invasive Bladder Cancer: Ad Hoc Analysis
🎤 Presented by Anders Ullén 🇸🇪
@OncoAlert
🔬 What is the contribution of each agent to the benefit of perioperative EV + pembrolizumab?
📊 STUDY DESIGN
Exploratory 3-arm analysis | N=255
Patients with #MIBC ineligible for or declining cisplatin, concurrently randomized to:
🟢 EV + pembrolizumab (n=85)
🔵 Pembrolizumab alone (n=83)
🔴 Radical cystectomy + PLND alone (n=87)
📊 KEY RESULTS
✅ OVERALL SURVIVAL
🔹 EV + pembro vs control:
HR 0.48 (95% CI 0.29–0.80)
🔹 Pembro vs control:
HR 0.76 (95% CI 0.48–1.20)
📈 Median OS:
• EV + pembro: NR
• Pembro: 51.0 months
• Control: 41.7 months
✅ PATHOLOGICAL COMPLETE RESPONSE
🟢 EV + pembro: 58.8%
🔵 Pembro: 25.3%
🔴 Control: 10.3%
Absolute differences vs control:
• EV + pembro: +48.6 percentage points
• Pembro: +15.7 percentage points
📌 EFS and OS favored perioperative EV + pembro versus surgery alone, while pembrolizumab monotherapy showed numerically favorable outcomes.
⚠️ SAFETY
Grade ≥3 AEs:
• Neoadjuvant: 44.0% vs 20.7% (EV + pembro vs pembro)
• Adjuvant: 60.0% vs 44.9%
🔬 INTERPRETATION
The efficacy pattern supports a potential contribution of both EV and pembrolizumab.
However, this was an ad hoc exploratory analysis, and comparisons should not be interpreted as confirmatory evidence of the independent contribution of each drug.
⭐ MY POINT OF VIEW | CLINICAL PEARL
The question is evolving from whether perioperative EV + pembrolizumab works to understanding why the combination works—and which patients truly need both agents.
The striking pCR difference and favorable OS signal reinforce the biological rationale for combining an ADC with immune checkpoint inhibition.
💡 But treatment intensification must always be balanced against toxicity, patient fitness and long-term benefit.
📌 EV + pembrolizumab is an established perioperative option for cisplatin-ineligible MIBC based on the parent KEYNOTE-905 trial. These exploratory findings add insight rather than establish a new treatment indication.
🌍 GU Oncology Community
@gbanna74 @ravikanesvaran @urologysummit
@tompowles1 @brian_rini @montypal @crisbergerot @DrDanielHeng @apolo_andrea @DrChoueiri @PGrivasMDPhD @TiansterZhang @HHammersMD @neerajaiims @amerseburger @sonpavde @drenriquegrande @scserendipity1 @Silke_Gillessen @EfstathiouEleni @BraunMDPhD @cdanicas @AOmlin @declangmurphy @salvolarosa @RenuEapen @seanmcbride @DrJaVallejo
@ecancer @UrologyTimes @urotoday @wearemedsir @OpenMedicineHQ @UCSFCancer
#BladderCancer #MIBC #GUOncology #ADC #ClinicalTrials
[Slide 1]
Summary of Analysis Populations
Future pembro vs. control analysis (n = 338)
The study continues to evaluate prespecified hypotheses under multiplicity control for concurrently randomized participants to pembro vs. control
Present ad hoc analysis ITT population (n = 255)
An ad hoc analysis was performed in participants concurrently randomized to all 3 arms between Aug 2020 and Nov 2022
Primary analysis (n = 344)
All concurrently randomized participants to the EV + pembro vs. control arms, presented previously^1
[Timeline bars]
Pembro monotherapy (n = 166)
Control (RC + PLND alone; n = 346)
EV + pembro (n = 170)
2019: Study start
Aug 2020: EV + pembro arm opened
Nov 2022: Enrollment to pembro arm stopped
2024: Last participant enrolled
1. Vulsteke C et al. N Engl J Med 2026
[Speaker panel] Anders Ullén - Perioperative pembrolizumab (pembro) or enfortumab vedotin (EV) plus pembro in pts with muscle-invasive bladder cancer (MIBC) who are cisplatin ineligible: ad hoc analysis from KEYNOTE-905
[Slide 2]
Event-Free Survival
Ad Hoc Analysis ITT Population
| | EV + pembro (n = 85) | Pembro (n = 83) | Control (n = 87) |
Events, n (%) | 27 (31.8) | 41 (49.4) | 52 (59.8)
Median (95% CI) | NR (41.2-NR) | 28.7 mo (13.9-NR) | 15.7 mo (9.5-31.6)
HR^a vs. Control (95% CI) | 0.40 (0.25-0.65) | 0.71 (0.47-1.07) |
Landmark labels (EV + pembro / Pembro / Control):
12 mo: 77.2% / 66.4% / 55.0%
24 mo: 75.8% / 55.8% / 41.0%
36 mo: 69.5% / 49.6% / 37.4%
No. at Risk (Months 0, 6, 12, 18, 24, 30, 36, 42, 48, 54, 60)
EV + pembro: 85 70 59 57 55 42 35 16 3 0 0
Pembro: 83 62 52 44 41 27 22 13 3 0 0
Control: 87 56 44 37 32 22 14 9 1 0 0
mo, months; NR, not reached. ^aComparison analysis was descriptive only (not a prespecified hypothesis test).
Data cutoff date: 6 June 2025 [low-res, best reading]
Survival table
Endpoint: EFS (ad hoc ITT, 3 concurrently randomized arms)
Arm | N | Median | Median CI
EV + pembro | 85 | NR | 41.2-NR
Pembro | 83 | 28.7 mo | 13.9-NR
Control (RC + PLND alone) | 87 | 15.7 mo | 9.5-31.6
HR: EV + pembro vs control 0.40; Pembro vs control 0.71
HR CI: 0.25-0.65; 0.47-1.07
Landmark rates:
12 mo: EV + pembro 77.2% | Pembro 66.4% | Control 55.0%
24 mo: EV + pembro 75.8% | Pembro 55.8% | Control 41.0%
36 mo: EV + pembro 69.5% | Pembro 49.6% | Control 37.4%
[Slide 3]
Overall Survival
Ad Hoc Analysis ITT Population
| | EV + pembro (n = 85) | Pembro (n = 83) | Control (n = 87) |
Events, n (%) | 23 (27.1) | 34 (41.0) | 42 (48.3)
Median (95% CI) | NR (NR-NR) | 51.0 mo (32.0-NR) | 41.7 mo (26.4-NR)
HR^a vs. Control (95% CI) | 0.48 (0.29-0.80) | 0.76 (0.48-1.20) |
Landmark labels (EV + pembro / Pembro / Control):
12 mo: 83.3% / 78.2% / 74.6%
24 mo: 78.4% / 66.9% / 62.6%
36 mo: 74.5% / 61.4% / 55.7%
No. at Risk (Months 0, 6, 12, 18, 24, 30, 36, 42, 48, 54, 60)
EV + pembro: 85 79 70 64 63 56 45 28 10 0 0
Pembro: 83 76 64 57 53 45 31 22 7 0 0
Control: 87 72 64 54 51 45 30 18 6 0 0
mo, months; NR, not reached. ^aComparison analysis was descriptive only (not a prespecified hypothesis test).
Data cutoff date: 6 June 2025 [low-res, best reading]
Survival table
Endpoint: OS (ad hoc ITT, 3 concurrently randomized arms)
Arm | N | Median | Median CI
EV + pembro | 85 | NR | NR-NR
Pembro | 83 | 51.0 mo | 32.0-NR
Control (RC + PLND alone) | 87 | 41.7 mo | 26.4-NR
HR: EV + pembro vs control 0.48; Pembro vs control 0.76
HR CI: 0.29-0.80; 0.48-1.20
Landmark rates:
12 mo: EV + pembro 83.3% | Pembro 78.2% | Control 74.6%
24 mo: EV + pembro 78.4% | Pembro 66.9% | Control 62.6%
36 mo: EV + pembro 74.5% | Pembro 61.4% | Control 55.7%
Trial design schema: Pathological Complete Response - Ad Hoc Analysis ITT
🎯 #ESMO26 EV 303 study update!
Perioperative pembro was associated with numerically better EFS and OS compared with RC! 💯@OncoAlert @myESMO @tompowles1 @PGrivasMDPhD @urotoday @GuardConsortium https://t.co/cP3d2BKht4
Pathological Complete Response
Ad Hoc Analysis ITT Population
[Bar chart] y-axis: pCR, % (95% CI); 0-100
EV + pembro: 58.8
Pembro: 25.3
Control: 10.3
[Table, right side cropped]
| | EV + pembro (n = 85) | [cropped] |
pCR, n | 50
pCR rate, % (95% CI) | 58.8 (47.6-69.4)
Estimated^a difference vs. Control, % (95% CI) | 48.6 (35.6-60.1)
- pCR: absence of viable tumor ([cropped]) from RC + PLND by central path[cropped]
- Participants who did not underg[cropped] with clinical complete response[cropped] were considered nonresponde[cropped]
^aDetermined based on stratified Miettinen & Nurminen method and may vary slightly from the numerical difference.
Comparison analysis was descriptive only (not a prespecified hypothesis test).
Summary of Analysis Populations
Future pembro vs. control analysis (n = 338)
The study continues to evaluate prespecified hypotheses under multiplicity control for concurrently randomized participants to pembro vs. control
Present ad hoc analysis ITT population (n = 255)
An ad hoc analysis was performed in participants concurrently randomized to all 3 arms between Aug 2020 and Nov 2022
Primary analysis (n = 344)
All concurrently randomized participants to the EV + pembro vs. control arms, presented previously(1)
Pembro monotherapy (n = 166)
Control (RC + PLND alone; n = 346)
EV + pembro (n = 170)
[Timeline] 2019: Study start | Aug 2020: EV + pembro arm opened | Nov 2022: Enrollment to pembro arm stopped | 2024: Last participant enrolled
1. Vulsteke C et al. N Engl J Med 2026.
PD-1 Blockade Shows Similar Benefit Across Perioperative Timings
Perioperative Pembro (EV-303) vs Adjuvant Nivo and Pembro
[Panel 1] EV-303 · perioperative pembro - EFS · blue = pembro, red = RC + PLND alone [small KM thumbnail; landmark labels illegible at this resolution]
[Panel 2] CheckMate 274 · adjuvant nivo - DFS vs placebo (ITT) [KM thumbnail: Nivolumab, Placebo]
[Panel 3] AMBASSADOR · adjuvant pembro - DFS vs observation (ITT) [KM thumbnail: Pembrolizumab, Observation]
Hazard ratio vs no active IO (95% CI) EFS for EV-303; DFS for adjuvant trials
EV-303 Perioperative pembro 0.71 (0.47-1.07)
CheckMate 274 Adjuvant nivo 0.70 (0.55-0.90)
AMBASSADOR Adjuvant pembro 0.73 (0.59-0.90)
Axis 0.4 0.6 0.8 1.0 1.2: <- Favours PD-1 blockade | Favours control ->
Footnote (very small, best-effort): HRs as reported; not directly comparable: EV-303 EFS counted from randomisation before surgery in cisplatin-ineligible patients; CheckMate 274 and AMBASSADOR DFS counted from randomisation after surgery in high-risk pathology. CheckMate 274 HR 98.22% CI. EV-303 pembro: 3 neoadjuvant + 14 adjuvant cycles; adjuvant arms ~1 year. Cross-trial comparison of different populations, endpoints and time zero; not a formal test of treatment timing.
1) Trial design schema: KEYNOTE-905/EV-303: timeline of study design development · 2) Kaplan-Meier survival data: KEYNOTE-905 ad hoc analysis: overall survival
Perioperative Pembro or EV + Pembro in Cisplatin-Ineligible #MIBC: Ad Hoc Analysis from KEYNOTE-905. Presented by Anders Ullén, MD. #ESMO26 written coverage by @chavarriagaj @PSH_Urology > https://t.co/tzAGQSZNAe #BladderCancer #Immunotherapy https://t.co/ThOGnNqg3M
[Slide 1]
Timeline of Study Design Development
2019 — Study initiated with 2 arms:
• Perioperative pembro with RC + PLND vs. RC + PLND alone
• Randomization was 1:1
• Participants had to be cisplatin-ineligible
2020 — Third arm added:
• Perioperative EV + pembro with RC + PLND
• Randomization was updated to 1:1:1
2022 — Inclusion criteria updated to include participants who were cisplatin-eligible but declined cisplatin-based chemotherapy
2022 —
• Randomization to pembro with RC + PLND was stopped
• Randomization updated to 1:1 to perioperative EV + pembro with RC + PLND vs. RC + PLND alone
• Adjuvant nivolumab permitted in the RC + PLND alone arm when clinically indicated and regionally available
Vulsteke C et al. N Engl J Med 2026.
[Slide 3]
Overall Survival
Ad Hoc Analysis ITT Population
| | EV + pembro (n = 85) | Pembro (n = 83) | Control (n = 87) |
| Events, n (%) | 23 (27.1) | 34 (41.0) | 42 (48.3) |
| Median (95% CI) | NR (NR–NR) | 51.0 mo (32.0–NR) | 41.7 mo (26.4–NR) |
| HR^a vs. Control (95% CI) | 0.48 (0.29–0.80) | 0.76 (0.48–1.20) | |
Landmarks: 12 mo: 83.3% / 78.2% / 74.6%; 24 mo: 78.4% / 66.9% / 62.6%; 36 mo: 74.5% / 61.4% / 55.7% (EV + pembro / Pembro / Control)
Y-axis: Overall survival, %; X-axis: Months
No. at Risk (months 0, 6, 12, 18, 24, 30, 36, 42, 48, 54, 60)
EV + pembro: 85, 79, 70, 64, 63, 56, 45, 28, 10, 0, 0
Pembro: 83, 76, 64, 57, 53, 45, 31, 22, 7, 0, 0
Control: 87, 72, 64, 54, 51, 45, 30, 18, 6, 0, 0
Survival table
Endpoint: Overall survival (ad hoc, ITT)
Arm | N | Median | Median CI
EV + pembro | 85 | NR | NR–NR
Pembro | 83 | 51.0 mo | 32.0–NR
Control | 87 | 41.7 mo | 26.4–NR
HR: EV + pembro vs control 0.48; Pembro vs control 0.76
HR CI: 0.29–0.80; 0.48–1.20
Landmark rates:
12 mo: EV + pembro 83.3% | Pembro 78.2% | Control 74.6%
24 mo: EV + pembro 78.4% | Pembro 66.9% | Control 62.6%
36 mo: EV + pembro 74.5% | Pembro 61.4% | Control 55.7%
Kaplan-Meier survival data: OS in ADT+docetaxel population (n=710): SOC+abiraterone vs SOC
Fantastic presentation by Karim Fizazi! PEACE-1 at 7.7 years: adding abiraterone to ADT + docetaxel improved median OS to 6.2 vs 4.4 years (HR 0.68) in de novo mCSPC. Durable benefit from upfront intensification! @myESMO #ESMO26 @oncoalert https://t.co/C6GdCHh36O
1) Kaplan-Meier survival data: long-term OS KM, overall population SOC +/- abiraterone · 2) Kaplan-Meier survival data: OS KM, ADT + docetaxel + abiraterone (triplet) vs doublet · 3) Kaplan-Meier survival data: OS KM by disease volume, triplet vs doublet: high vs low
Long-term OS with AA/P in the PEACE-1 trial for de novo mCSPC @urotoday #ESMO26
mFU: 7.7 yrs
🚨SOC (+/-RT) + Abi vs SOC (+/-RT): abs OS ⏫ 1.5 yrs (HR 0.75, 95.1% 0.65-0.87)
🚨ADT + Doce + Abi vs Abi + ADT: abs OS ⏫ 1.8 yrs (HR 0.68, 95.1% CI 0.56-0.82)
🚨Favorable effect of triplet Rx on OS, independent of vol disease (interaction test p=0.56)
1) Trial design schema: Photo of presented study · 2) Kaplan-Meier survival data: rPFS by metastatic
#KarimFizazi with final OS analysis of #PEACE1 in met hormone sensitive prostate cancer treated w abiraterone +/- XRT, and +/- docetaxel. Important OS benefit across all subsets, median survival 6.1 yrs.
@oncoalert @myESMO #ESMO26 https://t.co/GApDmrPE33
PEACE-1 at 7.7 years, de novo mCSPC: abiraterone added to ADT plus docetaxel with long term improves survival.
📈 Docetaxel population, n=710: OS HR 0.68, median 6.2 vs 4.4 years, 7-year OS 45.7% vs 30.7%
📊 OS HR was 0.75 at the 2022 analysis, so the effect grew with follow-up
🔍 86% of controls got an ARPI after progression. No long-term safety signal
Fizazi's point this investigator imitated trial gives us what few industry frontline trials by following patients this long.
#ESMO26 #ProstateCancer #mCSPC #GUonc
Conclusion: PEACE-1
• Survival is clearly improved by abiraterone in the long-term
• Almost twice more long-term survivors with triplet systemic therapy in subgroups !
• Triplet systemic therapy active regardless of metastatic « volume »
• Early is truly better in mCSPC
• Almost systematic use of an ARPI beyond progression in the control arm of PEACE-1
• No long-term safety signal
Karim Fizazi
Kaplan-Meier survival data: OS by metastatic volume, ADT+docetaxel population, triplet vs doublet KM
PEACE-1 long-term update at #ESMO2026 (median FU 7.7y): • Abiraterone + SOC: OS HR 0.75 • Triplet (ADT+doc+abi) vs doublet: mOS 6.2 vs 4.4y, HR 0.68; 8y OS 40% vs 27% • Benefit regardless of volume (interaction p=0.56) • High volume: 8y OS 38% vs 20% #ProstateCancer 1/2 https://t.co/q0yRLVVdaY
Kaplan-Meier survival data: rPFS de novo high vs low volume, room for improvement / poor responders
But 4 yrs on, maybe the debate isn't doublet vs triplet. It's what we do with poor responders. PSA >0.2 at ~6 months = major unmet need & opportunity. Good to see trials now focused here (PEACE-6 PR, TRIPLE-SWITCH, REINFORCE, EvoPAR-PR05), as Ursula Vogl discussed. #ESMO2026 2/2 https://t.co/96R7jvX9kK
But.....there is still room for improvement
rPFS: PEACE-1 de novo high volume | rPFS: PEACE-1 de novo low volume
[KM curves: Radiographic progression-free survival vs Time from randomization (in years); Triplet vs Doublet; High volume annotations 3[?]% (Triplet) vs 11% (Doublet); Low volume annotations 43% (Triplet) vs 21% (Doublet)]
Number at risk (censored): High volume Abiraterone 224(5) 181(3) 139(3) 116(4) 99(4) 88(4) 68(15) 43(36); No abiraterone row [illegible]; Low volume rows [illegible]
Early progressors despite «triplet therapy» → Precision treatment / intensification
• BRCA/HRD alterated → benefit PARPi in mCSPC1,2
• PTEN loss → benefit Akt inhibitor3
• Potential benefit from early 177Lutetium-PSMA-6174,5
• Poor responders PSA > 0.2 ng/mL at nadir → clinical trial (e.g. PEACE-6 Poor Responders6, TRIPLE-SWITCH7, REINFORCE8, EvoPAR-PR059)
Excellent responders – e.g. PSA nadir ≤ 0.2 ng/mL → De-escalation
• Clinical trial: De-escalation (EORTC 2238 DE-ESCALATE10)
Fizazi K et al., ESMO 2026
References: Attard G et al., Nat Med 2025; Agarwal N et al., N Engl J Med 2026; Fizazi K et al., Ann Oncol 2026; STAMPEDE2 (177Lu-PSMA-617) NCT06320067; Tagawa ST et al., Lancet 2026; PEACE-6 Poor Responders (177Lu-PSMA-617) NCT06496581; TRIPLE-SWITCH (docetaxel) NCT06592924; REINFORCE (docetaxel) NCT07333060; EvoPAR-PR05 (saruparib) NCT07071002; EORTC 2238 DE-ESCALATE NCT05974774 [small print; NCT digits uncertain]
Ursula Vogl
Survival table
Endpoint: Radiographic PFS, PEACE-1 de novo mCSPC (triplet vs doublet) by volume
High volume Triplet (abiraterone) | 224
High volume Doublet
Low volume Triplet
Low volume Doublet
Landmark rates:
~7 y (arrow position): High volume Triplet 3[?]% | High volume Doublet 11% | Low volume Triplet 43% | Low volume Doublet 21%
Kaplan-Meier survival data: OS by metastatic extent (volume), ADT+docetaxel population - Karim
PEACE-1: long-term OS benefit with the triplet (ADT+Doce+Abi) irrespective of metastatic extent. Need to move beyond volume/risk categories to choose systemic therapy #ESMO26 https://t.co/ETqtBho4lq
1) Trial design schema: study design (de novo mCSPC, 2x2 randomization, n=1173) · 2) Kaplan-Meier survival data: rPFS: SOC+Abi vs SOC (overall, n=583 vs 589) · 3) Kaplan-Meier survival data: rPFS in docetaxel-population (n=355 per arm): triplet
Long-Term Overall Survival with Abiraterone Acetate + Prednisone in the PEACE-1 Phase 3 Trial for De Novo #mCSPC. Presented by @fizazi_karim @GustaveRoussy. #ESMO26 written coverage by @zklaassen_md > https://t.co/Pe3FCYH4IA #ProstateCancer #GUOnc @myESMO https://t.co/iiRPp6stvm
1) Trial design schema: Discussant table: median follow-up and OS of combination phase 3 · 2) Kaplan-Meier survival data: (ADT + docetaxel ± abiraterone) and ENZAMET · 3) Slide: Discussant slide: ARPI resistance mechanisms and key alterations in advanced prostate
Invited Discussant: Long-Term Outcomes and New Therapeutic Horizons in Metastatic #ProstateCancer. Presented by @UrsulaVogl , #ESMO26 written coverage by @zklaassen_md > https://t.co/18BOyDdJVd #ProstateCancer #mCSPC #mCRPC https://t.co/672Xc0lDme
1) Slide: JNJ-6143 (RIPTAC) phase 1 mCRPC/mAPMR title slide and author list · 2) Mechanism of action: JNJ-6143 RIPTAC mechanism of action slide: AR-JNJ-6143-BRD4 · 3) Response data: JNJ-6143 PSA response waterfall and PSA50 by high-risk genomic · 4) Response data: JNJ-6143 radiographic response (ORR/DCR) and DOR at RP2D 50 mg
Thrilled to share updated results from JNJ-6143, the AR-BRD4 RIPTAC therapy, presented by @BGarmezy. Totally novel MOA was well tolerated, oral pill and produced significant benefit for pts (PSA90 50%, ORR 68%). P2 trial active now and more coming. Lots of potential! https://t.co/spwrXBg5ZZ
[Slide 1]
Safety and Efficacy of JNJ-6143, a First-in-Class Oral AR-Targeted Regulated Induced Proximity Targeting Chimera Molecule in Patients With mCRPC/mAPMR, Including High-Risk Molecular Features
Benjamin Garmezy,1 Sheena Sahota,2 Judy S. Wang,3 Sreenivasa R. Chandana,4 Gerald S. Falchook,5 Neal D. Shore,6 Xin Gao,7 Matthew R. Smith,7 Joseph W. Kim,8 Dillon Cockrell,9 Charles J. Ryan,10 Daniel P. Petrylak,8 Michael J. Morris,10 Andrew J. Armstrong,9 Johann S. De Bono,11 Alex Yu,12 Lilla Di Scala,13 Malhar Khatu,14 Lena N. Lupey-Green,15 Sebastiano Battaglia,12 Beerinder Pal Karir,12 Katherine J. Kayser-Bricker,15 Eyal Attar,16 Lindsey Hoffman,17 Andrew W. Hahn18
1Sarah Cannon Research Institute, Nashville, TN, USA; 2NEXT Oncology, Austin, TX, USA; 3Florida Cancer Specialists/Sarah Cannon Research Institute, Sarasota, FL, USA; 4START Center for Cancer Research - Midwest, Grand Rapids, MI, USA; 5Sarah Cannon Research Institute at HealthONE, Denver, CO, USA; 6START Carolinas/Carolina Urologic Research Center, Myrtle Beach, SC, USA; 7Massachusetts General Hospital and Harvard Medical School, Boston, MA, USA; 8Yale School of Medicine, New Haven, CT, USA; 9Duke University, Durham, NC, USA; 10Memorial Sloan Kettering Cancer Center, New York, NY, USA; 11The Institute of Cancer Research and the Royal Marsden NHS Foundation Trust, London, UK; 12Johnson & Johnson, Spring House, PA, USA; 13Johnson & Johnson, Basel, Switzerland; 14Johnson & Johnson, Mumbai, India; 15Johnson & Johnson, New Haven, CT, USA; 16formerly of Halda Therapeutics, Inc, New Haven, CT, USA; 17Johnson & Johnson, Los Angeles, CA, USA; 18The University of Texas MD Anderson Cancer Center, Houston, TX, USA
AR, androgen receptor; mAPMR, metastatic androgen pathway modulation-resistant prostate cancer; mCRPC, metastatic castration-resistant prostate cancer.
Presented by B Garmezy at the European Society for Medical Oncology (ESMO) Annual Congress; October 23–27, 2026; Madrid, Spain
https://www.congresshub.com/Oncology/ESMO2026/ProstateEarlyAssets/Garmezy
The QR code is intended to provide scientific information for individual reference, and the information should not be altered or reproduced in any way.
[Slide 2]
JNJ-6143,^a First-in-Class RIPTAC™ Therapeutic: Targeted Dual-Protein Lock in an Oral Small Molecule
JNJ-6143: A Regulated Induced Proximity Targeting Chimera (RIPTAC™) molecule
[Diagram: Prostate cancer cell; Nucleus; AR; BRD4]
Ternary Complex Formation: AR-JNJ-6143-BRD4
JNJ-6143 selectively binds AR and BRD4
Ternary complex sequesters and functionally inactivates BRD4
BRD4 cannot engage chromatin to drive transcription → Apoptosis
• Selectively binds AR and BRD4, resulting in BRD4 loss of function and death in PC cells1-3
• Induces tumor regression across preclinical in vivo CRPC models with AR and non-AR alterations2,3
• Preliminary phase 1 data suggest a favorable safety profile with evidence of tumor shrinkage and PSA decline in patients with mCRPC3
We report updated phase 1 data evaluating JNJ-6143 in mCRPC
^aFormerly HLD-0915.
BRD4, bromodomain-containing protein 4; CRPC, castration-resistant prostate cancer; PC, prostate cancer; PSA, prostate-specific antigen; RIPTAC™, Regulated Induced Proximity Targeting Chimera.
1. Raina K, et al. Cell Chem Biol. 2024;31(8):1490-1502. 2. Raina K, et al. J Clin Oncol. 2023;41(suppl 6):184. 3. Hahn A, et al. Presented at: AACR-NCI-EORTC Molecular Targets and Cancer Therapeutics Symposium; October 22-26, 2025; Boston, MA, USA.
Presented by B Garmezy at the European Society for Medical Oncology (ESMO) Annual Congress; October 23–27, 2026; Madrid, Spain
[Slide 3]
JNJ-6143: High PSA Response Rate Irrespective of High-Risk Molecular Features
[Waterfall: Best PSA change,^a % by dose cohort 12.5 mg, 25 mg, 50 mg, 100 mg, 150 mg; PSA50 and PSA90 reference lines]
Alteration: SNV; Loss; Indel; Amplification
[Oncoprint rows: ARamp, AR LBD mut, TP53, PTEN, RB1, BRCA1/2]
PSA50 rate by high-risk genomic alteration status in the 50 mg cohort (n=27)
Gene | Altered | Unaltered
ARamp | 13/15 | 9/12
AR LBD mut | 2/3 | 20/24
TP53 | 17/21 | 5/6
PTEN | 8/10 | 14/17
RB1 | 9/12 | 13/15
BRCA1/2 | 9/11 | 13/16
X-axis: PSA50 rate,^b % (0–100)
PSA50 was achieved in 5/6 (83%) ARv7+ patients with evaluable CTCs (n=7)
Data cutoff date: September 21, 2026.
^aPatients with both baseline and ≥1 postbaseline PSA assessment and available Cycle 1 Day 1 ctDNA data from Guardant Reveal (Guardant Health, Palo Alto, CA).
^bError bars represent Wilson 95% CI.
ARamp, androgen receptor amplification; AR LBD mut, androgen receptor ligand binding domain mutation; ARv7, androgen receptor splice variant 7; BRCA, breast cancer gene; CTC, circulating tumor cell; Indel, insertion or deletion; PSA50, 50% reduction in PSA from baseline; PSA90, 90% reduction in PSA from baseline; PTEN, phosphatase and tensin homolog; RB1, RB transcriptional corepressor 1; SNV, single nucleotide variant; TP53, tumor protein p53.
Presented by B Garmezy at the European Society for Medical Oncology (ESMO) Annual Congress; October 23–27, 2026; Madrid, Spain
[Slide 4]
JNJ-6143: High Rate of Radiographic Responses at the RP2D in Advanced mCRPC
ORR-evaluable patients in the 50 mg cohort
69% Confirmed ORR (11/16)
13% CR
56% PR^c
19% SD*
88% DCR (14/16)
Y-axis: Response rate,^b %
| 50 mg (n=16)^a
DOR, median (95% CI), months | 11.0 (5.9, NE)
*After the data cutoff, 1 patient with SD converted to confirmed PR.
Data cutoff date: September 21, 2026.
^aPatients with measurable disease at baseline and either off-study or with ≥1 postbaseline assessment.
^bResponses are based on best overall response per RECIST version 1.1. CR and PR are confirmed and without bone progression by PCWG3.
^cThree patients with PR had visceral disease.
CR, complete response; CI, confidence interval; DCR, disease control rate; DOR, duration of response; NE, not evaluable; ORR, objective response rate; PCWG3, Prostate Cancer Working Group 3; PR, partial response; RECIST, Response Evaluation Criteria in Solid Tumors; SD, stable disease.
Presented by B Garmezy at the European Society for Medical Oncology (ESMO) Annual Congress; October 23–27, 2026; Madrid, Spain
1) Slide: mCRPC: treatment-related AEs at RP2D 50 mg and all doses (Garmezy, ESMO 2026) · 2) Slide: mCRPC: swimmer plot, 69/105 (66%) remain on treatment (Garmezy, ESMO 2026)
JNJ-6143, first-in-class oral AR-BRD4 RIPTAC, phase 1 mCRPC: a wide window between efficacy and safety. n=105, doses 12.5 to 150 mg.
📈 50 mg daily: PSA50 77%, PSA90 48%, confirmed ORR 69%, after a median 4 prior lines
📊 PSA declines seen from 12.5 to 150 mg. 66% of all patients still on drug
🔍 At 50 mg: 58% any-grade TRAEs, no serious TRAEs. Median DOR 11.0 months, CI 5.9 to NE
Activity across a 12-fold dose range. Phase 2 is open at 50 mg.
Congrats to @BGarmezy on the presentation and all the investigators.
#ESMO26 #ProstateCancer #mCRPC #GUonc
@BGarmezy with 1st report of an AR RIPTAC - JNJ-6143 in metastatic castration resistant #prostatecancer showing good PSA responses across aggressive molecular subtypes, median duration 11 months. New mechanism to degrade androgen receptor is active!
@oncoalert #ESMO26 @myESMO https://t.co/ejTYkqTkgw
[Slide 1]
JNJ-6143: First-in-Human, Multicenter, Phase 1 Dose-Escalation Study
Dose escalation and backfills: 150 mg (n=10) | 100 mg (n=19) | 50 mg (n=18) | 25 mg (n=15) | 12.5 mg (n=9)
Dose optimization: 50 mg (n=20) | 25 mg (n=14)
N=105(a)
JNJ-6143 administered orally once daily in 21-day cycles
Study design
• Phase 1 dose escalation with backfill and dose optimization in patients with mCRPC
Key eligibility criteria
• Progressive mCRPC with rising PSA (≥2 ng/mL for dose escalation; ≥20 ng/mL for dose optimization)
• Prior treatment with ≥1 ARPI and may have had ≤2 prior taxanes and ≤1 RLT
• ECOG PS score of 0 or 1
Objectives
• Safety and tolerability
• PK/PD and efficacy (ie, PSA, ORR, ctDNA)
• Determine recommended doses for expansion
50 mg once daily was selected as the RP2D based on safety, efficacy, and PK
ClinicalTrials.gov identifier: NCT06800313.
(a)Patients dosed as of September 21, 2026.
ARPI, androgen receptor pathway inhibitor; ctDNA, circulating tumor DNA; ECOG PS, Eastern Cooperative Oncology Group performance status; ORR, objective response rate; PD, pharmacodynamics; PK, pharmacokinetics; RLT, radioligand therapy.
Presented by B Garmezy at the European Society for Medical Oncology (ESMO) Annual Congress; October 23–27, 2026; Madrid, Spain
[Slide 2]
JNJ-6143: Phase 1 Study Enrolled a Heavily Pretreated Population with Advanced mCRPC
Characteristic | 50 mg (n=38) | All doses(a) (N=105)
Age, years, median (range) | 73 (56, 90) | 72 (51, 90)
PSA, µg/L, median (range) | 122.2 (17.3, 2235) | 90.0 (3.6, 5000)
Lines of prior systemic therapy,(b) median (range) | 4 (1, 9) | 4 (1, 10)
Prior systemic therapy,(c) n (%) | |
RLT | 17 (46) | 45 (44)
Taxane | 20 (54) | 68 (66)
Taxane + RLT | 12 (32) | 36 (35)
PARP inhibitor | 2 (5) | 10 (10)
Visceral disease,(d) n (%) | 11 (29) | 26 (27)
Liver | 4 (11) | 5 (5)
Lung | 3 (8) | 12 (13)
Other | 5 (16) | 10 (10)
Data cutoff date: September 21, 2026.
(a)Doses ranged from 12.5 to 150 mg.
(b)Lines of prior systemic therapy counting only those used in the metastatic setting.
(c)n=97 in all doses.
(d)n=96 in all doses.
PARP, poly (ADP-ribose) polymerase.
Presented by B Garmezy at the European Society for Medical Oncology (ESMO) Annual Congress; October 23–27, 2026; Madrid, Spain
Slide: conclusions slide in mCRPC (Garmezy, ESMO 2026)
1/5
🚨 First-in-class RIPTAC™ in mAPMR
Thrilled to see this beautifully presented by @BGarmezy at #ESMO26.
JNJ-6143 is a first-in-class RIPTAC™ targeting AR × BRD4, designed to induce BRD4 loss of function and prostate cancer cell death. https://t.co/jA1TO8j0OC
JNJ-6143: Conclusions
• JNJ-6143 is a first-in-class RIPTAC™ molecule that forms a targeted dual-protein lock between AR (PC-selective tumor antigen) and BRD4 (essential cell survival protein) to trigger cell death
• JNJ-6143 was highly active with an encouraging safety profile in this phase 1 study of patients with heavily pretreated mCRPC
• At the RP2D of 50 mg once daily (oral):
– <60% any grade TRAEs
– 77% confirmed PSA50 rate and 48% confirmed PSA90 rate
– High PSA response rate irrespective of high-risk molecular features
– 69% confirmed ORR
• A phase 2 study (NCT07832292) has been initiated with 50 mg once daily
These early data suggest that JNJ-6143 has the potential to combine high tumor selectivity and robust efficacy with a favorable safety profile and convenient oral administration
Presented by B Garmezy at the European Society for Medical Oncology (ESMO) Annual Congress; October 23–27, 2026; Madrid, Spain
1) Slide: Novel AR targeted therapies in mCRPC - 'The AR Escape Map' · 2) Slide: AR alterations are enriched and frequent in mCRPC · 3) Kaplan-Meier survival data: AR alterations are associated · 4) Response data: Lessons from next generation AR inhibitors
🚨⭐🔵 #ESMO26 Novel AR targeted therapies in mCRPC
🎤 Presented by Alice Bernard-Tessier
@OncoAlert
🔬 Androgen receptor (AR) remains a central therapeutic target in mCRPC—but the field is clearly evolving beyond conventional ARPIs.
📌 KEY CONCEPTS
🧬 1. AR alterations are common
AR alterations are enriched in mCRPC and may be found in up to 80% of patients, including:
• AR amplification
• AR mutations
• AR splice variants
• AR rearrangements
These alterations are associated with worse prognosis, although their role as fully validated predictive biomarkers of ARPI resistance remains incomplete.
💊 2. The next generation of AR targeting is expanding
The session reviewed several new strategies beyond standard AR pathway inhibition:
• Next-generation AR inhibitors
• AR degraders
• CYP11A1 inhibition
• RIPTACs, a novel concept exploiting AR presence, rather than classic AR dependence
🧪 3. AR degraders are gaining momentum
Emerging compounds and trials suggest that AR degradation may overcome resistance mechanisms not fully addressed by current ARPIs.
Examples discussed included:
• Luxdegalutamide
• BMS-986460
• Other AR degraders in clinical development
🧬 4. Genotype may increasingly guide drug choice
A major practical message from this talk:
“Genotype picks the drug.”
Different novel strategies may be better suited for different AR alterations:
• AR degraders and CYP11A1 inhibition may be particularly relevant when tumors harbor AR alterations
• AR activating mutations may identify biologically distinct therapeutic vulnerabilities
💥 5. RIPTACs may shift the paradigm
The RIPTAC concept is especially interesting because it moves the field:
➡️ from AR dependence to AR presence
This could potentially expand AR-directed therapy even in tumors where canonical AR addiction is less clear.
Early phase 1 data with JNJ-6143 showed PSA responses across doses and across heterogeneous molecular backgrounds.
📌 TAKE-HOME MESSAGES
1️⃣ AR is still the target.
2️⃣ AR alterations are frequent and drive resistance to ARPIs.
3️⃣ Genotype may increasingly determine therapeutic selection.
4️⃣ RIPTACs introduce a potentially new framework for AR-directed therapy.
⭐ MY POINT OF VIEW | CLINICAL PEARL
This talk reinforces that mCRPC is entering a more biologically segmented era.
The future is not simply “more AR blockade,” but smarter AR targeting, choosing the right mechanism for the right resistance biology.
💡 The real shift is from one-size-fits-all AR inhibition to precision AR-directed therapy.
For daily practice, this means molecular characterization will become progressively more relevant—not only for prognosis, but for selecting the next therapeutic strategy after ARPI resistance emerges.
@urologysummit @gbanna74 @ravikanesvaran @Uromigos @LosUromigos @nataliagandur
@brian_rini @tompowles1 @montypal @declangmurphy @salvolarosa @RenuEapen @seanmcbride @DrJaVallejo @Silke_Gillessen @crisbergerot @DrDanielHeng @apolo_andrea @DrChoueiri @PGrivasMDPhD @TiansterZhang @HHammersMD @neerajaiims @amerseburger @sonpavde @drenriquegrande @scserendipity1 @EfstathiouEleni @BraunMDPhD @cdanicas @AOmlin
@ecancer @UrologyTimes @urotoday @wearemedsir @OpenMedicineHQ @gu_onc
#ProstateCancer #mCRPC #GUOncology #AR #PrecisionOncology #ESMO
[Slide 1]
The AR Escape Map
AR-dependent: amplification, rearrangements, mutations, splice variants
AR-bypass: PI3K/AKT, glucocorticoid receptor, other alternative pathways
AR-independent: lineage plasticity
[Metro-map style diagram; station labels include: AR amplification; LBD mutations; Rearrangements; Feria de Madrid (AR-dependent); EZH2 / NSD2 axis; RB1 / TP53 loss; Nuevos Ministerios; PI3K/AKT feedback - PTEN loss; Glucocorticoid receptor (GR); Wnt/beta-catenin pathway; AR-bypass; ASCL1-driven; AR-independent; small sub-labels illegible]
Legend: AR-dependent / AR-bypass / AR-independent
Alice BERNARD-TESSIER, MD
Conception with Claude
Alice Bernard-Tessier - Novel AR targeted therapies
[Slide 2]
AR alterations are enriched and frequent in mCRPC
AR alteration in 80% of mCRPC patients
[Horizontal bar chart of gene alteration frequency, AR at top highlighted by arrow; legend: mutation, deep deletion, amplification, fusion; x-axis Alteration frequency; gene labels illegible]
AR alteration frequency in ARPI-naive vs -exposed tumours
[Bar chart: ARPI-naive (lower) vs ARPI-exposed (higher); axis values illegible]
Different genomic AR alterations
[Schematic of AR gene/protein: AR enhancer, NTD, DBD, LBD; Copy number gain; Androgen receptor wild type; Androgen receptor splicing variants; Androgen receptor mutations - small labels partly illegible]
Alice BERNARD-TESSIER, MD
Abida et al., PNAS 2019
Abida et al., JCO Precision Oncol 2017
[Slide 3]
AR alterations are associated with worse prognosis
AR amplification ~60%
[KM curve: Overall survival (%), Months 0-42; labels include AR gain (>= copies) and AR WT - small text illegible]
AR mutations ~20%
[KM curve, Survival Probability vs days; small text illegible]
AR splicing variants ~10%
[KM curve: AR-V7 negative vs AR-V7 positive; HR and median survival text too small to read reliably]
Poor prognosis is well established; but their role as predictive biomarkers of ARPI resistance remains incompletely established.
Alice BERNARD-TESSIER, MD
Annala et al., Clin Cancer Res 2021
Annala et al., JCO Precis Oncol 2023 [partly illegible]
Antonarakis et al., JAMA 2017 [partly illegible]
[Slide 4]
Lessons from next generation AR inhibitors
Cumelutamide (TAS3681)
[Waterfall plot of PSA change; inset footnotes (low resolution): aConfirmed PSA 50 response: 3 in 600 mg QD, 1 in 300 mg BID, 1 in 400 mg BID; bConfirmed PSA 30 response: 1 in 600 mg QD, 1 in 300 mg BID, 2 in 400 mg BID - [low resolution, verify]]
[AR schematic: N-terminal domain, DNA-binding domain, Ligand-binding domain (highlighted)]
Masofaniten (EPI-7386)
[Waterfall plot; AR schematic with N-terminal domain highlighted]
Alice BERNARD-TESSIER, MD
De Bono et al., ASCO 2021
Pachynski et al., ASCO GU 2023
1) Mechanism of action: JNJ-6143 RIPTAC mechanism of action schematic · 2) Trial design schema: study design: dose escalation/backfill and dose · 3) Slide: JNJ-6143 swimmer plot: months on treatment by dose level
JNJ-6143, a First-in-Class Oral AR-Targeted RIPTAC, in Heavily Pretreated #mCRPC: Phase 1 Safety and Efficacy. Presented by @BGarmezy @SarahCannonDocs. #ESMO26 written coverage by @zklaassen_md > https://t.co/9Lpbqe1NN0 #ProstateCancer @myESMO https://t.co/7AlF1EBsq7
1) Trial design schema: substudy design: perioperative apalutamide + ADT with RP+PLND · 2) Kaplan-Meier survival data: substudy EFS Kaplan-Meier curve, APA + ADT vs RP + PLND · 3) Kaplan-Meier survival data: substudy MFS Kaplan-Meier curve, APA + ADT vs RP + PLND · 4) Kaplan-Meier survival data: substudy time to first subsequent therapy Kaplan-Meier curve
PROTEUS Substudy: Periop Apa + ADT with RP+PLND vs RP+PLND in HR PCa @urotoday #ESMO26
Periop APA + ADT (+ RP+PLND; n= 102) vs RP+PLND alone (n=306)
🚨EFS: HR 0.38, 95% CI 0.26–0.55
🚨MFS: HR 0.49, 95% CI 0.26–0.90
🚨TT 1st Sub Rx: HR 0.29, 95% CI 0.20–0.43
🚨All Gr Hot Flush: 64% vs 0.7%
[Slide 1]
PROTEUS: A Significant Advance in Surgery Outcomes in HR LPC/LAPC but No Surgery-Alone Comparator
• In HR LPC/LAPC, despite refinement of prostatectomy as an SOC,1 the frequency of disease recurrence is high and patients may be subject to additional morbidity from subsequent therapy2,3
• The PROTEUS main study, with a blinded design, demonstrated superior efficacy of 1-year perioperative apalutamide plus ADT compared with an active comparator4:
Unprecedented Study Design
• Largest size to date
• Novel end points
• PSMA PET inclusion
Enhanced Disease Control With Perioperative Apalutamide + ADT
Significant benefit:
• 9x greater pCR/MRD
• 20% lower hazard for metastasis or death
• 29% lower risk of recurrence or death
• ~3 years longer time to next treatment
Limitation
Control group did not receive SOC (surgery alone)
The PROTEUS Substudy was designed to compare perioperative apalutamide + ADT with RP + PLND versus SOC (surgery alone)
ADT, androgen deprivation therapy; HR LPC/LAPC, high-risk localized/locally advanced prostate cancer; pCR/MRD, pathologic complete response/minimal residual disease; PLND, pelvic lymph node dissection; PSMA PET, prostate-specific membrane antigen positron emission tomography; RP, radical prostatectomy; SOC, standard of care.
1. Cooley LF, Shore ND. Transl Androl Urol. 2025;14:493-495. 2. Eiber M, et al. J Clin Oncol. 2024;42:5027. 3. Stattin P, et al. BJU Int. 2024;134:96-102. 4. Taplin ME, et al. N Engl J Med. 2026;395:546-560.
Presented by A Briganti at ESMO; October 23-27, 2026; Madrid, Spain
[Slide 2]
Perioperative APA + ADT Improved MFS by Conventional or PSMA PET Imaging (BICR)
SECONDARY END POINT
[KM curve: Metastasis-Free Survival (%) vs Months from Randomization; APA + ADT vs RP + PLND alone]
HR, 0.49a
95% CI, 0.26-0.90
nominal p=0.0193b
Metastasis detection method, n (%) | APA + ADT | RP + PLND
PSMA PET | 9 (8.8) | 50 (16.3)
Conventional Imaging | 1 (1.0) | 6 (2.0)
Histopathology | 1 (1.0) | 0
No. at risk (months 0, 6, 12, 18, 24, 30, 36, 42)
APA + ADT | 102 99 97 94 90 85 52 13
RP + PLND alone | 306 262 255 241 231 220 130 25
• 51% reduction in risk of metastasis or death
• MFS by local investigator assessment:
• HR, 0.38a 95% CI, 0.22-0.66 nominal p=0.0004b
MFS: Time to first occurrence of distant metastasis on PSMA PET or conventional imaging by BICR, pathologic finding of distant metastasis, or death from any cause.
aHR is from stratified proportional hazards model; HR <1 favors APA + ADT.
bNominal p value is from a log-rank test stratified by Gleason score (7, ≥8), nodal status (N0, N1), and geographic region (North America, Europe, and ROW).
Presented by A Briganti at ESMO; October 23-27, 2026; Madrid, Spain
Survival table
Endpoint: Metastasis-free survival by BICR (secondary endpoint), PROTEUS substudy
APA + ADT | 102
RP + PLND alone | 306
HR: 0.49
HR CI: 0.26-0.90
P: nominal p=0.0193
1) Trial design schema: substudy design: perioperative apalutamide + ADT with RP + PLND vs RP + · 2) Slide: substudy baseline characteristics (Briganti, ESMO 2026) · 3) Kaplan-Meier survival data: substudy EFS Kaplan-Meier curve: perioperative APA + ADT vs RP + · 4) Slide: substudy EFS rates over time at 20/24/36 months, after testosterone recovery
PROTEUS substudy at #ESMO26 presented by Alberto Briganti 🇪🇸
Perioperative apalutamide + ADT vs RP + PLND alone in HR localized/LA prostate cancer (N=408, 1:3)
▪️ EFS HR 0.38 (0.26–0.55), p<0.0001
▪️ 36-mo EFS 63% vs 41%; SOC median EFS only 19.1 mo
▪️ Benefit held after T recovery
@neerajaiims @DrChoueiri @DrRanaMcKay @tompowles1 #ProstateCancer
[Slide 1]
The PROTEUS Substudy Compared APA + ADT With RP + PLND vs RP + PLND Alone
• Immediate RP + PLND without neoadjuvant treatment, followed by subsequent adjuvant treatment based on physician's discretion, is used to reflect SOC based on current guideline recommendations(1)
N=408 | Patients with HR LPC/LAPC → RANDOMIZED 1:3
Perioperative open-label APA + ADT: Neoadjuvant (C1 through C6) APA (240 mg QD) + ADT → 2 wks → RP + PLND(a) → 4 wks → Adjuvant (C7 through C12) APA (240 mg QD) + ADT
RP + PLND → Local standard institutional practice/observation
Primary end point
• EFS: Time to first of BCF (PSA progression) or LRR or DM, or death(c)
Secondary and exploratory end points include:
• MFS
• Time to first subsequent therapy
Randomization: 27 July 2022 to 16 October 2023
Stratification:
• cN0 vs cN1(b)
• Gleason score (7 vs 8-10)
• Region (North America, Europe, ROW)
Local or systemic adjuvant treatment based on physician's discretion and local standard institutional practice
APA, apalutamide; BCF, biochemical failure; BICR, blinded independent central review; C, cycle; DM, distant metastases; EFS, event-free survival; LRR, local or regional recurrence; PSA, prostate-specific antigen; QD, daily; ROW, rest of the world.
a APA + ADT is stopped 2 weeks prior to planned RP and then resumed 4 weeks after RP. Cardiovascular risk prophylaxis and venous thromboembolism prophylaxis given based on risk.
b Based on conventional imaging.
c BCF defined as 2 consecutive PSA rises ≥1 week apart, with the second test resulting in an absolute PSA ≥0.2 ng/mL following RP; LRR and DM based on PSMA PET or conventional imaging, both by BICR, or histopathology.
1. Cornford P, et al. Eur Urol. 2026;S0302-2838(26)02114.
Presented by A Briganti at ESMO; October 23-27, 2026; Madrid, Spain
[Slide 2]
Baseline Characteristics Were Well Balanced
ITT population | Perioperative APA + ADT (n=102) | RP + PLND alone (n=306)
Median age (range), years | 66.0 (51-82) | 66.0 (45-84)
≥75, n (%) | 9 (8.8) | 31 (10.1)
Gleason score at initial diagnosis, n (%) 7 | 4 (3.9) | 8 (2.6)
Gleason ≥8 | 98 (96.1) | 298 (97.4)
Baseline PSA(a) Median (range), ng/mL | 14.1 (1.4-422.6)(b) | 14.2 (1.5-384.3)(c)
Baseline PSA <20, n (%) | 66 (65.3) | 183 (64.0)
Baseline PSA ≥20, n (%) | 35 (34.7) | 103 (36.0)
Tumor stage at diagnosis, n (%)(d) ≤cT2 | 69 (67.6) | 217 (70.9)
≥cT3 | 31 (30.4) | 86 (28.1)
Regional lymph node stage at diagnosis, n (%) cN0 | 94 (92.2) | 285 (93.1)
cN1 | 8 (7.8) | 21 (6.9)
• At clinical cutoff on 13 July 2026:
– Median follow-up - 37.8 months
– Patients still on the study - 94% (perioperative APA + ADT, n=96) and 89% (RP + PLND alone, n=306)
ITT, intent to treat.
a PSA before first dose was the closest value assessment on or prior to the start date for ADT or APA and the closest value assessment on or prior to the date of randomization for the RP + PLND alone group.
b n101. c n=286. d TX n=2 (APA + ADT); n=3 (RP + PLND alone).
Presented by A Briganti at ESMO; October 23-27, 2026; Madrid, Spain
[Slide 3]
PROTEUS Substudy Met Primary End Point: EFS Significantly Improved
T recovery to ≥200 ng/dL: Median 20.7 months (~9 months from EOT)
APA + ADT Median not reached | 63.0% (95% CI, 52.2-71.9)
RP + PLND alone Median 19.1 months | 41.4% (95% CI, 35.6-47.1)
HR, 0.38(a) 95% CI, 0.26-0.55 p<0.0001(b)
Y-axis: Event-Free Survival (%); X-axis: Months from Randomization (0-42); dashed landmark line at 36 months
No. at risk | 0 | 6 | 12 | 18 | 24 | 30 | 36 | 42
APA + ADT | 102 | 99 | 96 | 91 | 82 | 71 | 38 | 10
RP + PLND alone | 306 | 195 | 169 | 146 | 131 | 121 | 74 | 15
• 62% reduction in risk of oncologic event or death
• Median 19.1 months EFS with SOC highlights the unmet need
EFS: Time to first of BCF (PSA progression) or LRR or DM, or death by any cause. LRR and DM based on PSMA PET or conventional imaging, both by BICR, or histopathology.
CI, confidence interval.
a HR is from stratified proportional hazards model; HR <1 favors APA + ADT.
b p Value is from a log-rank test stratified by Gleason score (7, ≥8), nodal status (N0, N1), and geographic region (North America, Europe, and ROW).
Presented by A Briganti at ESMO; October 23-27, 2026; Madrid, Spain
Survival table
Endpoint: Event-free survival (EFS)
APA + ADT (perioperative) | 102 | Not reached
RP + PLND alone | 306 | 19.1 months
HR: 0.38
HR CI: 0.26-0.55
P: <0.0001
Landmark rates:
36 months: APA + ADT 63.0% (CI 52.2-71.9) | RP + PLND alone 41.4% (CI 35.6-47.1)
[Slide 4]
Treatment Benefit for EFS Was Consistent Over Time With Perioperative APA + ADT, Even After T Recovery
• T recovery to ≥200 ng/dL with perioperative APA + ADT: Median 20.7 months (~9 months from EOT)
Time after randomization | EFS rate, % (95% CI) Perioperative APA + ADT (n=102) | EFS rate, % (95% CI) RP + PLND alone (n=306) | EFS rate difference, % (95% CI) | Nominal p value
20 months | 91 (85-97) | 49 (43-55) | 42 (33-51) | <0.001
24 months | 84 (75-90) | 46 (40-52) | 37 (27-47) | <0.001
36 months | 63 (52-72) | 41 (36-47) | 22 (10-33) | <0.001
EFS: Time to first of BCF (PSA progression) or LRR or DM, or death by any cause. LRR and DM based on PSMA PET or conventional imaging, both by BICR, or histopathology.
EOT, end of treatment; T, testosterone.
Presented by A Briganti at ESMO; October 23-27, 2026; Madrid, Spain
1) Slide: first-event breakdown: LRR/DM with perioperative apalutamide + ADT vs RP + PLND · 2) Kaplan-Meier survival data: time to first subsequent therapy Kaplan-Meier curve
More PROTEUS results: events, MFS and time to subsequent therapy #ESMO26 https://t.co/88E2f5U9Sk
[Slide 1]
Fewer Local/Regional Recurrence or Distant Metastasis Events With Perioperative APA + ADT
| Perioperative APA + ADT (n=102) | RP + PLND alone (n=306)
First event (denominator for events below), n (%) | 35/102 (34.3) | 172/306 (56.2)
Biochemical failure (BCF) | 27 (77.1) | 92 (53.5)
Local or regional recurrence by PSMA PET/conventional imaging | 4 (11.4) | 51 (29.7)
LRR by PSMA PET | 4 (11.4) | 50 (29.1)
LRR by PSMA PET without BCF | 4 (11.4) | 48 (27.9)
LRR by conventional imaging | 0 | 1 (0.6)
Distant metastasis by PSMA PET/conventional imaging/histopathology | 4 (11.4) | 28 (16.3)
DM by PSMA PET | 2 (5.7) | 24 (14.0)
DM by PSMA PET without BCF | 2 (5.7) | 23 (13.4)
DM by conventional imaging/histopathology | 2 (5.7) | 4 (2.3)
Death | 0 | 1 (0.6)
Censored, n (%) | 67/102 (65.7) | 134/306 (43.8)
• ~70% of PSMA PET–detected LRR/DM without BCF in the RP group were associated with PSA persistence (PSA ≥0.1 ng/mL) 3 months after RP
• Excluding patients (both arms) with PSMA PET–detected events (LRR or DM) without prior BCF: HR, 0.50; 95% CI, 0.33-0.76; p=0.001
Presented by A Briganti at ESMO; October 23-27, 2026; Madrid, Spain
[Slide 3]
EXPLORATORY END POINT
Time to First Subsequent Therapy Was Prolonged by ~3 Years With Perioperative APA + ADT
APA + ADT
Median 46.0 months
64.6%
(95% CI, 54.1-73.3 )
RP + PLND alone
Median 12.3 months
32.0%
(95% CI, 26.7-37.5)
HR, 0.29a
95% CI, 0.20-0.43
nominal p<0.0001b
Y-axis: Time to First Subsequent Therapy (%)
X-axis: Months from Randomization (0, 6, 12, 18, 24, 30, 36, 42)
No. at risk
APA + ADT | 102 | 97 | 91 | 87 | 81 | 73 | 42 | 12
RP + PLND alone | 306 | 178 | 145 | 126 | 105 | 98 | 59 | 14
• 71% reduced risk of starting subsequent therapy
• ~50% fewer patients started subsequent therapy by 3 years
Time to first subsequent therapy: Time from randomization to first local, regional, or systemic therapy, including reinitiation of ADT.
aHR is from stratified proportional hazards model; HR <1 favors APA + ADT.
bNominal p value is from a log-rank test stratified by Gleason score (7, ≥8), nodal status (N0, N1), and geographic region (North America, Europe, and ROW).
Presented by A Briganti at ESMO; October 23-27, 2026; Madrid, Spain
Survival table
Endpoint: Time to first subsequent therapy (exploratory)
APA + ADT | 46.0 months
RP + PLND alone | 12.3 months
HR: 0.29
HR CI: 0.20-0.43
P: nominal p<0.0001
Landmark rates:
36 months: APA + ADT 64.6% (CI 54.1-73.3) | RP + PLND alone 32.0% (CI 26.7-37.5)
PROTEUS substudy: perioperative ADT+APA vs surgery alone, benefits in EFS, MFS and time to subsequent therapy. Reinforces this strategy as a new treatment option for high-risk prostate cancer patients. #ESMO26 https://t.co/vOb9Yw7nuX
PROTEUS Substudy Conclusions
• Together with the PROTEUS main study, the PROTEUS Substudy supports 1-year perioperative APA + ADT as a treatment option for patients with HR LPC/LAPC fit for surgery and systemic therapy
• Perioperative APA + ADT improves disease control and gives patients a longer time before starting subsequent therapy
Enhanced Disease Control With Perioperative APA + ADT
• 62% lower risk of recurrence or death
• 51% lower risk of death or developing metastases over time
• ~50% fewer patients starting subsequent therapy by ~3 years
• >3× longer time to first subsequent therapy
Presented by A Briganti at ESMO: October 23-27, 2026; Madrid, Spain
Slide: substudy title slide with authors (Briganti, ESMO 2026)
At #ESMO26, Alberto Briganti presented the PROTEUS substudy, reporting improved EFS with perioperative apalutamide + ADT (HR 0.38).
Nicholas van As discussed key limitations and concluded that longer follow-up is needed before changing clinical practice.
#ProstateCancer https://t.co/WpztxJBIPh
Perioperative Apalutamide Plus Androgen Deprivation Therapy With Radical Prostatectomy Plus Pelvic Lymph Node Dissection (RP + PLND) vs RP + PLND Alone in Patients With High-Risk Localized or Locally Advanced Prostate Cancer (HR LPC/LAPC): PROTEUS Substudy
Alberto Briganti1, Thomas Steuber2, Neal D Shore3, Martin Gleave4, Alexander Kretschmer5, Lisa Wetherhold5, Eleni Efstathiou6, David J Cahn7, Ronaldo Damião8, Alexandre De La Taille9, Boris A Hadaschik10, Bernardo Herrera Imbroda11, Álvaro Juárez Soto12, Giuseppe Simone13, Zhuokai Li14, Sharon A McCarthy15, Mark Wildgust16, Suneel D Mundle16, Adam S Kibel17, Mary-Ellen Taplin18
Presented by A Briganti at ESMO; October 23-27, 2026; Madrid, Spain
Trial design schema: substudy design: perioperative apalutamide + ADT with RP + PLND
PROTEUS Substudy: Perioperative Apalutamide + ADT with RP + PLND vs RP + PLND Alone in
High-Risk Localized or Locally Advanced
Prostate Cancer. Presented by @Albert0Briganti . #ESMO26 https://t.co/zEHimrns6A
The PROTEUS Substudy Compared APA + ADT With RP + PLND vs RP + PLND Alone
• Immediate RP + PLND without neoadjuvant treatment, followed by subsequent adjuvant treatment based on physician's discretion, is used to reflect SOC based on current guideline recommendations
N=408
Patients with HR LPC/LAPC → RANDOMIZED 1:3
Perioperative open-label APA + ADT: Neoadjuvant (C1 through C6) APA (240 mg QD) + ADT → 2 wks → RP + PLNDa → 4 wks → Adjuvant (C7 through C12) APA (240 mg QD) + ADT
RP + PLND → Local standard institutional practice/observation
Local or systemic adjuvant treatment based on physician's discretion and local standard institutional practice
Primary end point: EFS: Time to first of BCF (PSA progression) or LRR or DM, or deathc
Secondary and exploratory end points include: MFS; Time to first subsequent therapy
Stratification: cN0 vs cN1b; Gleason score (7 vs 8-10); Region (North America, Europe, ROW)
Randomization: 27 July 2022 to 16 October 2023
Presented by A Briganti at ESMO; October 23-27, 2026; Madrid, Spain
Slide: substudy publication title slide - European Urology (Briganti, ESMO 2026)
Mary-Ellen Taplin, MD, is the senior author of research evaluating perioperative apalutamide plus androgen deprivation therapy alongside radical prostatectomy and pelvic lymph node dissection, compared with surgery alone, in patients with high-risk localized or locally advanced prostate cancer. Learn more: https://t.co/geZlh3BXb0 #ESMO26
Treatment Effect of Perioperative (Neoadjuvant and Adjuvant) Apalutamide plus Androgen-deprivation Therapy Versus Radical Prostatectomy Alone in Patients with High-risk Localized or Locally Advanced Prostate Cancer from the PROTEUS Substudy
Alberto Briganti, Thomas Steuber, Neal D. Shore, Martin Gleave, Alexander Kretschmer, Lisa Wetherhold, Eleni Efstathiou, David J. Cahn, Ronaldo Damião, Alexandre De La Taille, Seok-Soo Byun, Boris A. Hadaschik, Bernardo Herrera Imbroda, Álvaro Juárez Soto, Axel S. Merseburger, Giuseppe Simone, Brendan Rooney, Denis Mikerin, Zhuokai Li, Branko Miladinovic, Sharon A. McCarthy, Mark Wildgust, Suneel D. Mundle, Adam S. Kibel, Mary-Ellen Taplin
[European Urology journal cover]
Presented by A Briganti at ESMO, October 23-27, 2026, Madrid, Spain
1) Mechanism of action: XmAb819 mechanism of action and ENPP3 expression · 2) Slide: XmAb819 Ph1 ccRCC: patient characteristics and prior therapy (Pal SK et al.) · 3) Slide: XmAb819 Ph1 ccRCC: patient case study, deepening of response over time · 4) Slide: XmAb819 Ph1 ccRCC: Conclusions (Pal SK et al.)
Novel T-cell engager in RCC! @montypal presents exciting data from XmAb819 Ph.I (ENPP3×CD3) in heavily pretreated ccRCC. ORR 27%, DCR 68% (n=60), including prior HIF-2α exposure (ORR 26%).
Grade ≥3 TRAEs 61%; discontinuation 7%. Early activity beyond IO/TKI/HIF-2α.
#ESMO26 #RCC @myESMO @OncoAlert
[Slide 1]
XmAb819, ENPP3 x CD3 bispecific antibody in development for ccRCC
[Diagram labels: T cell releases cytotoxic granzymes & perforins; Apoptosis of tumor cell; High-expressing ENPP3+ tumor cell; ENPP3; CD3; Activated CD3+ T-cell; XmAb819 ENPP3 x CD3 Bispecific Antibody]
• ENPP3 is an extracellular nucleotide metabolizing enzyme with high expression in RCC and other solid tumors, and low expression in normal tissues1
• XmAb819 targets T cells for potent lysis of ENPP3+ tumor cells
• XmAb 2+1 format selectively binds and kills high density ENPP3 tumor cells, but spares low density normal tissue
[Box plot: ENPP3 gene expression (TPM) (log2); Primary Tumor vs Normal Tissue; Bladder, Breast, Colon, Kidney, Liver, Lung, Ovary, Prostate, Skin, Soft tissue,Bone]
ENPP3 ectonucleotide pyrophosphatase / phosphodiesterase family member 3
1Doñate, Fernando, et al. Clinical Cancer Research 22.8 (2016)
Pal SK, et al.
[Slide 2]
Patient characteristics
Baseline Characteristic | All IV Doses (n=119) | Expansion Doses (n=68)
Median Age, Years (range) | 61 (34, 78) | 62 (34, 78)
Male, n (%) | 97 (81.5) | 58 (85.3)
Race – White, n (%) | 101 (84.9) | 56 (82.4)
Time Since Disease Diagnosis, mo. (range) | 52.5 (7, 287) | 49.5 (7, 287)
IMDC Risk Score at Baseline1, n (%)
Favorable | 8 (6.7) | 4 (5.9)
Intermediate | 81 (68.1) | 46 (67.6)
Poor | 30 (25.2) | 18 (26.5)
Sarcomatoid Features, n (%) | 16 (13.4) | 13 (19.1)
≥3 Metastatic Sites, n (%) | 84 (70.6) | 46 (67.6)
Bone metastasis, n (%) | 58 (48.7) | 32 (47.1)
Liver metastasis, n (%) | 48 (40.3) | 27 (39.7)
Target Lesions SOD (mm), Median | 90.0 | 90.5
ENPP3 Positive From Cases With Tissues2 (%) | 83/89 (93.3) | 50/52 (96.2)
Prior Therapy | All IV Doses (n=119) | Expansion Doses (n=68)
# Prior Regimens, Median (Min, Max) | 3 (1, 10) | 3 (1, 10)
1, n (%) | 7 (5.9) | 4 (5.9)
2 | 35 (29.4) | 22 (32.4)
3 | 30 (25.2) | 18 (26.5)
≥4 | 47 (39.5) | 24 (35.3)
Prior Treatments, n (%)
Any Immune Checkpoint Inhibitor | 119 (100) | 68 (100)
Any VEGFR-TKI | 119 (100) | 68 (100)
2 or More VEGFR-TKIs | 76 (63.9) | 43 (63.2)
HIF2α Inhibitor | 42 (35.3) | 23 (33.8)
Nephrectomy, n (%) | 81 (68.1) | 46 (67.6)
HIF2α, hypoxia-inducible factor 2-alpha; IMDC, International Metastatic RCC Database Consortium; IHC, immunohistochemistry; SOD, sum of diameters; TKI, tyrosine kinase inhibitor; VEGFR, vascular endothelial growth factor receptor
Subjects who received ≥1 protocol-specified dose of XmAb819 were included in the baseline characteristics analysis. Data cut-off: 01 September 2026. Excludes 1 participant who experienced approximately 10-fold higher exposure than intended at the first and only dose administered, and who subsequently developed Grade 4 CRS and discontinued treatment.
1IMDC risk derived at study baseline using central laboratory values; KPS <80% defined as ECOG ≥2.
2Tumor ENPP3 positivity was defined as a tumor proportion score (TPS) ≥1, regardless of expression intensity, by a clinical trial IHC assay (Roche Diagnostics).
Pal SK, et al.
[Slide 3]
Patient case study: Deepening of response over time
• Background: Male, 57 years old, RCC diagnosed 10 years ago, metastatic disease ~5 years ago
• Prior therapy: 2 prior therapy lines
cabozantinib + nivolumab (1 mo) → progression
& lenvatinib + everolimus (3 yrs) → progression
• Baseline: Two enlarged mediastinal lymph nodes both > 2 cm longest diameter
multiple small lung and pancreas lesions
membrane ENPP3+ <25% tumor cells
• Response: PR week 6, deepened to CR week 42
normalization of lymph nodes
disappearance of lung and pancreas lesions
• Treatment and response ongoing at month 16
[CT images: Baseline | 15.5 Months]
Pal SK, et al.
[Slide 4]
Conclusions
• XmAb819 (ENPP3 x CD3) showed meaningful antitumor activity in patients with advanced ccRCC.
• Antitumor activity was observed in a dose-dependent manner, with a cORR of 30% at 100 µg/kg, 44% at 200 µg/kg, and 45% at 400 µg/kg, and a majority of responses ongoing at data cut.
• Consistent activity in subgroups with prior exposure to HIF2α inhibitors (cORR 35%) and ≥2 VEGFR-TKIs (cORR 45%).
• These data support continued development of XmAb819 as a monotherapy for advanced clear cell RCC and evaluation of rational combination strategies in earlier lines of treatment.
cORR, confirmed objective response rate; HIF2α, hypoxia-inducible factor 2-alpha; TKI, tyrosine kinase inhibitor; VEGF, vascular endothelial growth factor receptor
Pal SK, et al.
@montypal w phase 1 data from XmAb819 ENPP3/CD3 bispecific in tx-refractory #kidneycancer — manageable CRS & promising responses dose dependent. ENPP3 very interesting target for RCC.
@oncoalert #ESMO26 @myESMO https://t.co/Yur2ZjCBct
1) Slide: XmAb819 Ph1 ccRCC title slide and author list · 2) Slide: XmAb819 Ph1 ccRCC: antitumor activity at 100 µg/kg target dose · 3) Slide: XmAb819 Ph1 ccRCC: antitumor activity at 400 µg/kg target dose
Leveraging ENPP3 expression on RCC - @montypal presents the results of the ph I trial of ENPP3 x CD3 bispecific
Cytokine-related adverse events occur mostly in early cycles
Super promising antitumor activity with signs of durability so far
#ESMO26 @OncoAlert https://t.co/lRDXz4btwY
[Slide 1]
MADRID 2026 ESMO congress
Phase 1 results of XmAb819, a novel ENPP3 x CD3 bispecific, in advanced clear cell renal cell carcinoma (ccRCC)
Sumanta K. Pal1, Benjamin Garmezy2, Randy F. Sweis3, Mehmet A. Bilen4, Scott S. Tykodi5, Yuanquan Yang6, Karie Runcie7, David A. Braun8, David J. VanderWeele9, Claud M. Grigg10, Christopher Hoimes11, Adanma Ayanambakkam12, Joseph J. Maly13, Robert A. Franklin14, Biren Saraiya15, Chet Bohac16, Jitendra Kanodia16, Nicholas Rinella16, Ritesh R. Kotecha17, Laurence Albiges18
1City of Hope Comprehensive Cancer Center, Duarte, USA; 2Sarah Cannon Research Institute, Nashville, USA, 3University of Chicago, Chicago, USA, 4Winship Cancer Institute of Emory University, Atlanta, USA, 5University of Washington and Fred Hutchinson Cancer Center, Seattle, USA, 6The Ohio State University Comprehensive Cancer Center, Columbus, USA, 7Columbia University, New York, USA, 8Yale School of Medicine, New Haven, USA, 9Northwestern University, Chicago, USA, 10Atrium Health Wake Forest Baptist Comprehensive Cancer Center, Charlotte, NC, USA, 11Duke University Medical Center, Durham, USA, 12University of Oklahoma Health Sciences Center, Oklahoma City, USA, 13Norton Cancer Institute - St Matthews Campus, Louisville, USA, 14University of Cincinnati Medical Center, Cincinnati, OH, USA, 15Rutgers Cancer Institute, New Brunswick, USA, 16Xencor, Inc., Pasadena, California, USA, 17 Memorial Sloan Kettering Cancer Center, New York, USA, 18Institut Gustave Roussy, Villejuif, France
25 October 2026
Abstract 2684
[Slide 3]
Antitumor activity at target dose of 100 µg/kg
[Waterfall plot: Best % Change from Baseline; Ongoing Tx]
[Spider plot: % Change from Baseline vs Study Months; Ongoing Tx]
Efficacy Evaluable | 100 µg/kg (n = 30)
Confirmed ORR, % (95% CI) | 30.0 (14.7, 49.4)
BOR, n (%) |
CR | 1 (3.3)
PR | 8 (26.7)
SD | 17 (56.7)
PD | 4 (13.3)
DCR, % (95% CI) | 86.7 (69.3, 96.2)
Median follow-up, months (range) | 4.1 (1.1, 28.3)
Efficacy analysis includes subjects with ≥1 protocol-specified dose of XmAb819 and ≥1 post-baseline tumor assessment. Confirmed responses per investigator assessment, RECIST v1.1. Data cut-off: 01 September 2026. CR subject has two resolved lymph node target lesions with residual mass <10 mm
BOR, best overall response; CR, complete response; DCR, disease control rate; ORR, objective response rate; PD, progressive disease; PR, partial response; SD, stable disease; Tx, treatment
Pal SK, et al.
[Slide 4]
Antitumor activity at target dose of 400 µg/kg
[Waterfall plot: Best % Change from Baseline; bar labels PD, SD, SD, SD, SD, PR, PR, PD, PR, PR, PR; Ongoing Tx]
[Spider plot: % Change from Baseline vs Study Months; Ongoing Tx]
Efficacy Evaluable | 400 µg/kg (n = 11)
Confirmed ORR, % (95% CI) | 45.5 (16.8, 76.6)
BOR, n (%) |
CR | -
PR | 5 (45.5)
SD | 4 (36.4)
PD | 2 (18.2)
DCR, % (95% CI) | 81.8 (48.2, 97.7)
Median follow-up, months (range) | 6.0 (1.4, 7.9)
Efficacy analysis includes subjects with ≥1 protocol-specified dose of XmAb819 and ≥1 post-baseline tumor assessment. Confirmed responses per investigator assessment, RECIST v1.1. Data cut-off: 01 September 2026.
BOR, best overall response; CR, complete response; DCR, disease control rate; ORR, objective response rate; PD, progressive disease; PR, partial response; SD, stable disease; Tx, treatment
Pal SK, et al.
[Slide 1]
What remains to be answered (1)
How limiting is toxicity? Can we actually give it - and can every unit do it?
What was reported · expansion doses, n=68
TEAE, % | All grades | Grade >=3
Rash (combined term) | 91.2 | 22.1
Cytokine release syndrome | 67.6 | 5.9
ALT increased | 52.9 | 33.8
AST increased | 48.5 | 35.3
Hypotension | 29.4 | 7.4
72% related grade >=3 AEs
54% related serious AEs
7% discontinued for AEs
0 deaths from AEs
One further patient - ~10-fold overexposure at the first dose, grade 4 CRS - is excluded from every analysis.
Pal SK et al, ESMO 2026, abstract 2684 (data cutoff 1 Sep 2026). CRS graded per ASTCT; TEAEs in >25% of subjects shown.
Manuela Schmidinger, Medical University of Vienna, Austria
What it means in practice
The first month needs a centre
Priming doses need a unit that recognises and treats CRS - dexamethasone before each one, prophylactic tocilizumab before the first.
After that it settles
New CRS after day 29 in 18%, new rash in 29% and almost none severe. Transaminase rises transient, median resolution 7 days.
Defined CRS management protocol
[Slide 2]
In summary: XmAb819: where this leaves us
Points to consider:
Durability
Dose: ORR rises with dose, but PD in 36% at 200 vs 13% at 100 µg/kg
ENPP3 density threshold: the complete responder had ENPP3 on fewer than 25% of tumor cells: does intensity predict response?
Deliverability in the first month
Verdict
A strong signal: enthusiasm is justified - and this is only the floor...
worth a phase 3 - after IO and VEGF-TKI or earlier
Pal SK et al, ESMO 2026, abstract 2684 (data cutoff 1 Sep 2026)
Manuela Schmidinger, Medical University of Vienna, Austria
[Slide 3]
2 What makes ivonescimab special?
One molecule instead of two drugs - does it make treatment less toxic? And does it make it more effective?
WHY IT COULD BE LESS TOXIC
It takes the ligand, not the receptor
VEGFR-TKI
endothelial cell
VEGFR blocked
and inhibits these as well
MET | AXL | KIT | FGFR | RET
diarrhoea · hand-foot · fatigue · hypothyroidism
IVONESCIMAB
endothelial cell
VEGFR untouched
VEGF-A caught before it binds
no other kinase is inhibited
hypertension · proteinuria only
Fc-silenced (L234A/L235A): it does not kill the PD-1+ T cells it binds - in vitro
The toxicity argument is about what is not in the molecule
WHY IT COULD BE MORE EFFECTIVE
Where VEGF-A is high, ivo grips with both arms
TUMOUR
VEGF-A high
PD-1
T cell
MUTUAL COOPERATIVITY
Once VEGF-A is bound -> PD-1 binding becomes ~18 times stronger
Once PD-1 is bound -> VEGF-A binding becomes >4 times stronger
in vitro, manufacturer's own data
Design claim
NORMAL TISSUE
VEGF-A low - but not absent
PD-1
T cell
ONE ARM ONLY
only the PD-1 arm holds
no VEGF-A to tighten the grip
-> ordinary PD-1 blockade
a gradient, not an on/off switch
[illegible footnote text: references incl. HARMONi-2 (Xiong A et al, Lancet 2025...) and Zhong T et al, Science 2025]
Manuela Schmidinger, Medical University of Vienna, Austria
[Slide 4]
Take-home messages
XmAb819 · REDIRECTING
ENPP3 × CD3 T-cell engager · after IO and VEGF-TKI
MODE OF ACTION
A new mode of action
WHAT IT SHOWED
Enthusiasm is justified - the floor, not the ceiling
NEXT
Ready for phase 3 - and for earlier lines
Ivonescimab · COMBINING
PD-1 × VEGF-A bispecific · treatment-naive, favourable risk
MODE OF ACTION
A known mode of action in a new format
WHAT IT SHOWED
In the IO-TKI range - with a toxicity profile worth enthusiasm
NEXT
Ready to randomise - against what, and in whom?
Pal SK et al, ESMO 2025, abstract 2684 (data cutoff 1 Sep 2026); Yan X et al., ESMO 2026, abstract 8473 (data cutoff 14 Jul 2026)
Manuela Schmidinger, Medical University of Vienna, Austria
Response data: XmAb819 depth and duration of responses: spider plot and responder
3/5
Among 25 responders at expanded doses, 19 (76%) remained on treatment.
Median time to response: 2.7 months
Median time on treatment: 7.0 months https://t.co/4J3ogiFCjz
Depth and duration of responses
Spider Plot of Confirmed Responders Across All IV Doses (n = 27)
■ Low doses (N=2) ■ Expanded doses (N=25) ▶ Ongoing Tx
[Spider plot: % Change from Baseline vs Study Months; axis ticks not transcribed]
Responders | Expansion Doses (n=25)
Ongoing Responses, n (%) | 19 (76.0)
Median TTR, months (range) | 2.7 (1.3, 20.9)
Median time on treatment, months (range) | 7.0 (3.4, 28.3)
Efficacy analysis includes subjects with ≥1 protocol-specified dose of XmAb819 and ≥1 post-baseline tumor assessment. Confirmed responses per investigator assessment, RECIST v1.1. Data cut-off: 01 September 2026.
TTR, time to response; Tx, treatment
Pal SK, et al.
1) Slide: XmAb819 Ph1 ccRCC: cytokine release syndrome by max grade and dose · 2) Slide: XmAb819 Ph1 ccRCC: antitumor activity at 200 µg/kg target dose (Pal SK et al.)
🎯 #ESMO26 3º day Proffered paper GU non-prostate ca. Ph 1 results of XmAb819, a novel ENPP3 x CD3 bispecific, in mRCC.@montypal
👉 ORR 30%, CRS G3-4 6.0% with > ORR in> step-dose
@OncoAlert @myESMO @urotoday @DrYukselUrun @g_develasco @GuardConsortium @tompowles1 https://t.co/OMFOh0YojP
[Slide 1]
Cytokine release syndrome (CRS)
CRS by Max Grade & Dose (n=68)
CRS Grade 1 2 3 4
PD1: 45.6%; 13(19.1) grade 1; 16(23.5) grade 2; 2(2.9) grade 3
PD2: 35.8%; 7(10.4) grade 1; 15(22.4) grade 2; 2(3.0) grade 3
PD3: 25.8%; 4(6.1) grade 1; 12(18.2) grade 2; 1(1.5) grade 4
TD1: 6.2%; 2(3.1) grade 1; 1(1.5) grade 2; 1(1.5) grade 3
TD3: 1.6%; 1(1.6)
TD4: 1.7%; 1(1.7)
TD7: 4%; 1(2.0); 1(2.0)
TD8: 2.1%; 1(2.1)
TD9: 2.3%; 1(2.3)
Dosed, n | PD1 68 | PD2 67 | PD3 66 | TD1 65 | TD2 63 | TD3 62 | TD4 58 | TD5 53 | TD6 51 | TD7 50 | TD8 48 | TD9 43
• CRS was predominately low-grade and occurred during priming
• No dose delays and one treatment discontinuation due to CRS
• Premedications for XmAb819:
▪ Acetaminophen, diphenhydramine, and IV normal saline
▪ Dexamethasone prior to priming doses
▪ Tocilizumab prior to priming dose 1 (PD1)
• Graded per ASTCT consensus criteria; managed per institutional standards, or NCCN guidelines when local standards were absent
Subjects who received ≥1 protocol-specified dose of XmAb819 were included in the safety analysis. Data cut-off: 01 September 2026. Excludes 1 participant who experienced approximately 10-fold higher exposure than intended at the first and only dose administered, and who subsequently developed Grade 4 CRS and discontinued treatment. Reported TEAEs were defined per MedDRA and CTCAE; CRS graded ASTCT1. Per-protocol PK samples were not collected for subject in plot (left) with reported Grade 4 CRS at priming dose 3; drug exposure could not be determined. Two subjects each experienced 2 events of Grade ≥3 CRS.
1Lee DW, et al. Biol Blood Marrow Transplant. 2019;25:625-638.
ASTCT, American Society for Transplantation and Cellular Therapy; CRS, cytokine release syndrome; CTCAE, Common Terminology Criteria for Adverse Events; MedDRA, Medical Dictionary for Regulatory Activities; NCCN, National Comprehensive Cancer Network; PD, priming dose; TEAE, treatment-emergent adverse event; TD, target dose
Pal SK, et al.
[Slide 2]
Antitumor activity at target dose of 200 µg/kg
[Waterfall plot: Best % Change from Baseline; Ongoing Tx]
[Spider plot: % Change from Baseline vs Study Months; Ongoing Tx]
Efficacy Evaluable1 | 200 µg/kg (n = 25)
Confirmed ORR, % (95% CI) | 44.0 (24.4, 65.1)
BOR, n (%) |
CR | -
PR | 11 (44.0)
SD | 5 (20.0)
PD | 9 (36.0)
DCR, % (95% CI) | 64.0 (42.5, 82.0)
Median follow-up, months (range) | 4.5 (0.8, 11.6)
Efficacy analysis includes subjects with ≥1 protocol-specified dose of XmAb819 and ≥1 post-baseline tumor assessment. Confirmed responses per investigator assessment, RECIST v1.1. Data cut-off: 01 September 2026.
1Two subjects at 200 µg/kg discontinued treatment without a post-baseline response assessment and without documented progression.
BOR, best overall response; CR, complete response; DCR, disease control rate; ORR, objective response rate; PD, progressive disease; PR, partial response; SD, stable disease; Tx, treatment
Pal SK, et al.
Slide: in ccRCC - title/author slide, Abstract 2684 (Pal SK)
Resistance post IO in mRCC remains a challenge. ENPP3 is a novel target expressed highly in ccRCC.
Ph 1 study of Xmab819 (ENPP3 x CD3) by @montypal shows compelling ORR at 45.5% and DCR at 81.8% in heavily pre-treated population.
Dose-dependent efficacy and side effects (CRS, rash) tail off after priming doses.
#ESMO26
@RWinayak
Phase 1 results of XmAb819, a novel ENPP3 x CD3 bispecific, in advanced clear cell renal cell carcinoma (ccRCC)
Sumanta K. Pal(1), Benjamin Garmezy(2), Randy F. Sweis(3), Mehmet A. Bilen(4), Scott S. Tykodi(5), Yuanquan Yang(6), Karie Runcie(7), David A. Braun(8), David J. VanderWeele(9), Claud M. Grigg(10), Christopher Hoimes(11), Adanma Ayanambakkam(12), Joseph J. Maly(13), Robert A. Franklin(14), Biren Saraiya(15), Chet Bohac(16), Jitendra Kanodia(16), Nicholas Rinella(16), Ritesh R. Kotecha(17), Laurence Albiges(18)
(1)City of Hope Comprehensive Cancer Center, Duarte, USA; (2)Sarah Cannon Research Institute, Nashville, USA; (3)University of Chicago, Chicago, USA; (4)Winship Cancer Institute of Emory University, Atlanta, USA; (5)University of Washington and Fred Hutchinson Cancer Center, Seattle, USA; (6)The Ohio State University Comprehensive Cancer Center, Columbus, USA; (7)Columbia University, New York, USA; (8)Yale School of Medicine, New Haven, USA; (9)Northwestern University, Chicago, USA; (10)Atrium Health Wake Forest Baptist Comprehensive Cancer Center, Charlotte, NC, USA; (11)Duke University Medical Center, Durham, USA; (12)University of Oklahoma Health Sciences Center, Oklahoma City, USA; (13)Norton Cancer Institute - St Matthews Campus, Louisville, USA; (14)University of Cincinnati Medical Center, Cincinnati, OH, USA; (15)Rutgers Cancer Institute, New Brunswick, USA; (16)Xencor, Inc., Pasadena, California, USA; (17)Memorial Sloan Kettering Cancer Center, New York, USA; (18)Institut Gustave Roussy, Villejuif, France
25 October 2026
Abstract 2684
1) Trial design schema: randomized phase II title slide: perioperative pembrolizumab + · 2) Trial design schema: study design: pembrolizumab + MDT vs MDT (R 2:1), 85 patients · 3) Slide: criteria for oligometastatic RCC (timing and tumor extension) · 4) Slide: primary endpoint: relapse-free survival, pembrolizumab + MDT vs MDT
Proud to report at #ESMO2026 the results of PE-PE trial. Oligometastatic #RCC pts have a significant benefit when pembro was added to MDT irrespectively of the type of MDT used and up to 5y from previous surgery.
Thanks to the 🇮🇹 team and special thanks to @DrChoueiri!
@OncoAlert @urotoday @myESMO @KidneyCancer @Sebastiano_Buti @ciccarese_c @fmassari79 @mimma_rizzo @elena_verzoni @MatteoSantoniMD
[Slide 1]
MADRID 2026 ESMO congress
PErioperative PEmbrolizumab (P) plus metastasis-directed therapy (MDT) versus MDT alone in patients (pts) with oligometastatic renal cell carcinoma (omRCC): the randomized phase II PE-PE trial.
Roberto Iacovelli1, Alberto Dalla Volta2, Davide Bimbatti3, Sebastiano Buti4, Emanuela Fantinel5, Carlo Arcara6, Francesco Massari7, Lucia Bonomi8, Mimma Rizzo9, Elisa Zanardi10, Franco Nolè11, Helga Lipari12, Paolo Andrea Zucali13, Claudia Piombino14, Mirko Bonalda15, Elena Verzoni16, Giuseppe Prati17, Matteo Santoni18, Claudia Caserta19, Chiara Ciccarese20.
1-Fondazione Policlinico Universitario Agostino Gemelli, IRCCS, Rome, Italy. 2-Unit of Medical Oncology, Department of Medical and Surgical Specialties, Radiological Sciences, and Public Health, ASST Spedali Civili di Brescia, University of Brescia, Brescia, Italy. 3-Oncology 1 Unit, Istituto Oncologico Veneto, IOV - IRCCS, Padua, Italy. 4-Medicine and Surgery Department, University of Parma, Viale Antonio Gramsci, 14, 43126, Parma, Italy. 5-Department of Oncology, Azienda Ospedaliera Universitaria Integrata di Verona, University of Verona, Verona, Italy. 6-Medical Oncology Unit, La Maddalena Hospital, 90146 Palermo, Italy. 7-Medical Oncology, IRCCS Azienda Ospedaliero-Universitaria di Bologna, Bologna, Italy. 8-Medical Oncology Unit, ASST Papa Giovanni XXIII, Bergamo, Italy. 9-Division of Medical Oncology, A.O.U. Consorziale Policlinico di Bari, Bari, Italy. 10-IRCCS Azienda Ospedaliera Metropolitana, Genoa, Italy. 11-IRCCS Istituto Europeo di Oncologia, Milan, Italy. 12-Medical Oncology Unit, Ospedale Cannizzaro, Catania, Italy. 13-Department of Biomedical Sciences, Humanitas University, Pieve Emanuele, Milan, Italy. 14-Division of Oncology, Department of Oncology and Hematology, University Hospital of Modena, Modena, Italy. 15-Medical Oncology Unit 2, Santa Chiara Hospital, Azienda Ospedaliero-Universitaria Pisana, Pisa, Italy. 16-Department of Medical Oncology, Fondazione IRCCS Istituto Nazionale Dei Tumori di Milano, Milan, Italy. 17-Medical Oncology. Comprehensive Cancer Centre, AUSL-IRCCS di Reggio Emilia, Reggio Emilia, Italy. 18-Medical Oncology Unit, Macerata Hospital, Macerata, Italy. 19-Oncology Unit, Santa Maria della Misericordia Hospital Perugia, Italy.
[Slide 2]
Study Design
85 Pts with • Clear cell histology; • Previous nephrectomy; • ECOG PS 0 or 1; • No brain mets; • Oligometastatic disease defined by PE-PE criteria; • No previous medical treatment for RCC
R 2:1
Pembro 400 mg, 1 cycle IV 3 wks before MDT -> MDT (surgery and/or SABR) -> Pembro 400 mg, 8 cycles IV Q6 wks
MDT (surgery and/or SABR)
Primary endpoint: relapse-free survival (RFS)*.
Secondary endpoints: distant RFS*; OS*; safety.
Additional secondary endpoint not presented today: local progression in SABR population.
MDT: metastasis directed therapy
SABR: stereotactic ablative radiotherapy
* Evaluated in patients who received MDT.
Roberto Iacovelli M.D. Ph.D @DrIacovelli
[Slide 3]
Population: PE-PE criteria for oligometastatic RCC
Timing
Nephrectomy -> < 5 years -> metastasis (eligible)
OR
Nephrectomy -> Metastasectomy -> < 5 years -> metastasis (eligible)
Tumor Extension
Max 3 lesions allowed.
If bone mets. -> Max 2 lesions allowed.
AND
Each lesion diameter should not be more than 3 cm;
AND
Sum of the lesions' diameters should not be more than 5 cm.
Roberto Iacovelli M.D. Ph.D @DrIacovelli
[Slide 4]
Primary endpoint: relapse-free survival (RFS)
Relapse-Free Survival [%] vs time [months]
| Pembro + MDT N=54 | MDT N=29
Events | 19 | 16
Median (mos) | 25.4 | 11.0
HR (95%CI) | 0.47 (0.24 – 0.92); p=0.024
The median follow-up was 17.5 months (cut-off date of July 22nd, 2026).
N° at risk (0,6,12,18,24,30,36,42 months):
Pembro + MDT: 54 | 39 | 27 | 16 | 10 | 3 | 2 | 0
MDT: 29 | 17 | 7 | 4 | 3 | 1 | 0 | 0
Roberto Iacovelli M.D. Ph.D @DrIacovelli
Survival table
Endpoint: Relapse-free survival (primary)
Pembro + MDT | 54 | 25.4 mo
MDT | 29 | 11.0 mo
HR: 0.47
HR CI: 0.24 – 0.92
P: p=0.024
Slide: baseline characteristics, pembrolizumab + MDT (N=54) vs MDT (N=29)
Impressive IST (as always!) from @DrIacovelli. We often talk about application of pembro as “adjuvant” after treating oligometastatic disease. Now we have data to back it up. Maybe (as med oncs) we get pembro going as we work out MDT approach for oligomets? Discussant suggests a P3 - I’m not sure it will get done. With reasonable data for pembro in M1 NED, I say go for it. #ESMO26 @OncoAlert
Slide: secondary endpoint: distant RFS KM, pembro + MDT vs MDT
#ESMO26 PE-PE: Does periop pembro improve outcomes after MDT for oligometastatic ccRCC?
Ph 2, n=85
2:1 randomized:
🔹 Pembro → MDT (SABR/surgery) → pembro
🔹 MDT alone
🚨Perioperative pembrolizumab significantly improved RFS🚨
🔹 Median RFS: 25.4 vs 11 mo (HR 0.47, p=0.024)
🔹 94% of progression events were distant
🔹 Distant RFS: 25.4 vs 11.5 mo
🔹 Grade ≥3 AEs: 7.1% vs 3.4%
🔹 No grade ≥3 SABR-related AEs
🔑 Even in low-volume omRCC treated definitively with MDT, systemic relapse remains common. Perioperative pembrolizumab more than doubled median RFS and supports integrating systemic therapy with MDT.
@urotoday
1) Slide: trial title slide - perioperative pembrolizumab + MDT vs MDT in omRCC (Roberto Iacovelli) · 2) Slide: secondary endpoint distant-RFS KM: pembro + MDT vs MDT (Iacovelli)
PE-PE trial: pembro + MDT in #RCC
Definition of Oligomets: Less than 2️⃣ bone 🦴 met
Less than 3️⃣ cm 📏 soft tissue lession
Better relapse free survival ⬆️
#ESMO26 @myESMO @drlacovelli https://t.co/kmLVFoAIAE
1) Trial design schema: phase II study design: perioperative pembrolizumab + MDT vs MDT alone · 2) Slide: patient disposition (Iacovelli, ESMO 2026)
Perioperative Pembrolizumab + MDT vs MDT Alone in Oligometastatic #RCC: The Phase II PE-PE Trial. Presented by @DrIacovelli. #ESMO26 written coverage by @rksayyid > https://t.co/SO2jCp3yZ3 #KidneyCancer #Immunotherapy @myESMO https://t.co/VmavFZM5K3
1) Kaplan-Meier survival data: updated DCO: OS KM curve, capivasertib + abiraterone · 2) Kaplan-Meier survival data: updated DCO: rPFS KM curve, capivasertib + abiraterone · 3) Kaplan-Meier survival data: updated DCO: SSE-FS KM curve, capivasertib + · 4) Safety data: adverse events by grade (butterfly chart), capi + abi vs pbo + abi
Capi + Abi vs PBO + Abi in PTEN-deficient mHSPC: Updated OS from CAPItello-281 @urotoday #ESMO26
Capi + Abi vs PBO + Abi:
📌mOS: 57.4 mos vs 46.5 mos; HR 0.82, 95%CI 0.68–0.99; p=0.044
📌m-rPFS: 35.5 mos vs 26.0 mos; HR 0.83, 95%CI 0.70–0.99; p=0.033
📌mSSE-FS: 43.8 mos vs 35.9 mos; HR 0.83, 95%CI 0.69–0.99; p=0.044
Updated CAPItello-281 data at #ESMO26
In PTEN-deficient mHSPC, capivasertib + abiraterone improved median OS (57.4 vs 46.5 months; HR 0.82) and rPFS (35.5 vs 26.0 months).
Encouraging OS trend, but not statistically significant at this analysis #KarimFizazi @OncoAlert https://t.co/xvPGYUnGkL
[Slide 1]
13:30 - 15:00 Rapid oral: Genitourinary tumours, prostate, penile and testis
CHAIRS: THOMAS HWANG, EDMOND KWAN, ALISON REID
CAPItello-281: Study design
A global, multicentre, Phase III, randomised, double-blind study
Patients with PTEN-deficient de novo mHSPC
• PTEN deficiency: (diagnostic cut-off of ≥90% of viable malignant cells with no specific cytoplasmic staining by IHC)*
1012 patients randomised (1:1)
Capivasertib 400 mg BID 4 days on, 3 days off + Abiraterone/pred + ADT 1000 mg QD + ADT
Placebo BID 4 days on, 3 days off + Abiraterone/pred + ADT 1000 mg QD + ADT
Stratification factors:†
• High-volume disease with/without visceral metastases; low-volume disease
• Geography
Primary endpoint
• Investigator-assessed rPFS
Secondary endpoints analysed at ad hoc DCO
• Overall survival
• Symptomatic skeletal event-free survival
• Time to castration resistance
• Time to PSA progression
• Safety
Exploratory post hoc PTEN deficiency subgroups
NCT04493853. Full eligibility criteria available in Fizazi et al.¹ *Determined using investigational antibody for PTEN (SP218) (Roche Diagnostics). †High-volume disease (per CHAARTED criteria) with visceral metastases, high-volume disease without visceral metastases, low-volume disease; North America, Western Europe and Australia; Latin America and Eastern Europe; Asia.
ADT, androgen deprivation therapy; BID, twice daily; DCO, data cut-off; IHC, immunohistochemistry; mHSPC, metastatic hormone-sensitive prostate cancer; pred, prednisone/prednisolone; PSA, prostate specific antigen; PTEN, phosphatase and tensin homolog; QD, once daily; rPFS, radiographic progression-free survival
1. Fizazi K et al. Ann Oncol 2026;37:53–68
Karim Fizazi MD, PhD
[Side panel: presenter video] Karim Fizazi — Capivasertib (capi) + abiraterone (abi) vs placebo (pbo) + abi in patients (pts) with PTEN-deficient metastatic hormone-sensitive prostate cancer (mHSPC): Updated overall survival (OS) from CAPItello-281
BILBAO AUDITORIUM - HALL 3
[Slide 2]
13:30 - 15:00 Rapid oral: Genitourinary tumours, prostate, penile and testis
CHAIRS: THOMAS HWANG, EDMOND KWAN, ALISON REID
CAPItello-281 updated DCO: OS
Clinically meaningful improvement in OS for capi + abi
Capi + abi (N=507) | Pbo + abi (N=505)
Events, n (%): 195 (38.5) | 226 (44.8)
Median, months (95% CI): 57.4 (47.0, NC) | 46.5 (40.7, 53.2)
HR (95% CI): 0.82 (0.68, 0.99)
P-value: 0.044*
*Descriptive OS analysis: alpha controlled, did not meet statistical significance
Legend: Capivasertib + abiraterone; Placebo + abiraterone
Y-axis: Probability of OS; X-axis: Time from randomisation (months) 0-66
Number of patients at risk
Capi + abi: 507 486 473 454 441 415 398 387 366 338 291 256 215 176 149 118 91 60 45 25 10 2 0
Pbo + abi: 505 493 478 457 438 409 381 359 344 313 263 233 195 158 126 106 81 58 42 25 13 5 0
Data cut-off: 9 Mar 2026. Tick marks represent censored observations. The analysis was carried out using a stratified Cox proportional hazards model adjusting for the variables selected in the pooling strategy: volume of disease/visceral metastases. HR (95% CI) for OS at the primary rPFS analysis was 0.90 (0.71, 1.15). Predefined OS subgroup analyses are available in the article.
abi, abiraterone; capi, capivasertib; CI, confidence interval; DCO, data cut-off; HR, hazard ratio; NC, not calculable; OS, overall survival; pbo, placebo; rPFS, [illegible]
Karim Fizazi MD, PhD
[Side panel: presenter video] Karim Fizazi — Capivasertib (capi) + abiraterone (abi) vs placebo (pbo) + abi in patients (pts) with PTEN-deficient metastatic hormone-sensitive prostate cancer (mHSPC): Updated overall survival (OS) from CAPItello-281
BILBAO AUDITORIUM - HALL 3
Survival table
Endpoint: Overall survival (CAPItello-281 updated DCO, 9 Mar 2026)
Arm | N | Median | Median CI
Capi + abi | 507 | 57.4 mo | 47.0, NC
Pbo + abi | 505 | 46.5 mo | 40.7, 53.2
HR: 0.82
HR CI: 0.68-0.99
P: 0.044 (descriptive; alpha controlled, did not meet statistical significance)
[Slide 3]
13:30 - 15:00 Rapid oral: Genitourinary tumours, prostate, penile and testis
CHAIRS: THOMAS HWANG, EDMOND KWAN, ALISON REID
CAPItello-281 updated DCO: Conclusions
• In CAPItello-281, ~25% of tested patients had PTEN-deficient tumours
• A clinically meaningful improvement in OS (42% maturity) was observed for capi + abi vs pbo + abi (HR 0.82, 95% CI 0.68, 0.99; median OS: 57.4 vs 46.5 months)
• rPFS and SSE-FS outcomes were consistent with the primary analysis and continued to favour capi + abi
• The safety profile remained consistent with the primary analysis
– Most common AEs were on-target diarrhoea, rash and hyperglycaemia
These updated results support capivasertib plus abiraterone as a first-in-class treatment for this PTEN-deficient mHSPC population (high- and low-volume disease) with poor prognosis
Data cut-off: 9 Mar 2026
abi, abiraterone; AE, adverse event; capi, capivasertib; CI, confidence interval; DCO, data cut-off; HR, hazard ratio; mHSPC, metastatic hormone-sensitive prostate cancer; OS, overall survival; pbo, placebo; PTEN, phosphatase and tensin homolog; rPFS, radiographic progression-free survival
Karim Fizazi MD, PhD
[Side panel: presenter video] Karim Fizazi — Capivasertib (capi) + abiraterone (abi) vs placebo (pbo) + abi in patients (pts) with PTEN-deficient metastatic hormone-sensitive prostate cancer (mHSPC): Updated overall survival (OS) from CAPItello-281
BILBAO AUDITORIUM - HALL 3
[Slide 4]
13:30 - 15:00 Rapid oral: Genitourinary tumours, prostate, penile and testis
CHAIRS: THOMAS HWANG, EDMOND KWAN, ALISON REID
CAPItello-281 updated DCO: Adverse events (≥10% of patients)
With 17 months additional follow-up, the safety profile of capi + abi was consistent with the primary analysis¹
Total (%)/Grade ≥3 (%) — Capi + abi (N=503) [Grade 1 | Grade 2 | ≥Grade 3] vs Pbo + abi (N=503) [≥Grade 3 | Grade 2 | Grade 1]
Capi + abi values (listed top to bottom): 52.7/6.4; 40.4/11.3; 36.4/12.7; 27.0/5.6; 24.3/10.1; 24.1/7.6; 16.3/0.4; 15.3/4.6; 15.1/4.4; 13.5/2.8; 13.1/0.8; 12.5/1.0; 12.1/0.8; 11.7/0.6; 11.3/1.2; 11.1/0.2; 11.1/0.2; 10.7/0.6; 10.1/0.4; 10.1/1.0; 9.9/0.4
Pbo + abi values (listed top to bottom): 9.5/0.4; 13.9/1.0; 8.0/0.2; 14.9/1.6; 15.7/6.2; 26.4/9.5; 14.3/0.8; 11.9/1.6; 14.1/3.6; 12.9/2.2; 5.4/0.2; 5.8/0.4; 9.3/0.6; 13.1/0.6; 3.2/0; 13.9/0; 2.6/0; 4.0/0; 11.1/0.4; 4.2/0; 13.9/0
AE rows (listed top to bottom): Diarrhoea; Hyperglycaemia*; Rash†; Anaemia; Hypokalaemia; Hypertension; Fatigue; Urinary tract infection; ALT increased; AST increased; Nausea; Asthenia; COVID-19; Back pain; Pyrexia; Hot flush; Pruritus; Blood creatine increase; Arthralgia; Decreased appetite; Constipation
[Butterfly bar chart, x-axis 100-0-100 %]
Data cut-off: 9 Mar 2026. DKA was reported in six patients (1.2%) in the capi + abi arm, and one patient (0.2%) in the pbo + abi arm; the pbo + abi arm case was euglycaemic DKA. No new cases of DKA were reported in the capi + abi arm since the primary analysis. *Grouped term (includes the preferred terms of blood glucose increased, hyperglycaemia). †Grouped term (includes the preferred terms of erythema, rash, rash erythematous, rash macular, rash maculo-papular, rash papular, rash pruritic). abi, abiraterone; AE, adverse event; ALT, alanine aminotransferase; AST, aspartate aminotransferase; capi, capivasertib; DKA, diabetic ketoacidosis; pbo, placebo.
1. Fizazi K et al. Ann Oncol 2026;37:53–68.
Karim Fizazi MD, PhD
[Side panel: presenter video] Karim Fizazi — Capivasertib (capi) + abiraterone (abi) vs placebo (pbo) + abi in patients (pts) with PTEN-deficient metastatic hormone-sensitive prostate cancer (mHSPC): Updated overall survival (OS) from CAPItello-281
BILBAO AUDITORIUM - HALL 3
Kaplan-Meier survival data: updated descriptive OS analysis at 42% maturity
📢 #ESMO26 concomitant paper - Capivasertib plus abiraterone in PTEN-deficient de novo metastatic hormone-sensitive prostate cancer: updated survival analysis from CAPItello-281.
🔗https://t.co/lltkpAu4ee
@Daniel_J_George https://t.co/a44Q705GM8
CAPItello-281 updated^a descriptive analyses at 42% OS data maturity
A
[Kaplan-Meier plot; y-axis: Probability of OS 0.0-1.0; x-axis: Time from randomization (months) 0-66; dashed line at 0.5]
Capivasertib + abiraterone; Placebo + abiraterone
Callout: Median OS was reached for the first time in both arms, with ~11 months difference between arms
| Capi + abi (n = 507) | Pbo + abi (n = 505)
Events, n (%): 195 (38.5) | 226 (44.8)
Median OS, months (95% CI): 57.4 (47.0-NC) | 46.5 (40.7-53.2)
HR (95% CI): 0.82 (0.68-0.99)
P-value: 0.044
Callout: Outcomes in the control arm remained similar to the primary analysis and highlight the poor prognosis of patients with PTEN-deficient mHSPC on standard-of-care treatment
Number of patients at risk
Capi + abi: 507 486 473 454 441 415 398 387 366 338 291 256 215 176 149 118 91 60 45 25 10 2 0
Pbo + abi: 505 493 478 457 438 409 381 359 344 313 263 233 195 158 126 106 81 58 42 25 13 5 0
With an additional 17 months' follow-up, findings from this updated descriptive analysis support the clinically meaningful OS benefit of adding capivasertib to abiraterone in the treatment of patients with PTEN-deficient mHSPC
^aData cut-off: March 9, 2026. Abi, abiraterone; Capi, capivasertib; CI, confidence interval; HR, hazard ratio; mHSPC, metastatic hormone sensitive prostate cancer; NC, not calculable; OS, overall survival; Pbo, placebo; PTEN, phosphatase and tensin homolog
Survival table
Endpoint: Overall survival (updated descriptive analysis, 42% maturity)
Arm | N | Median | Median CI
Capivasertib + abiraterone | 507 | 57.4 months | 47.0-NC
Placebo + abiraterone | 505 | 46.5 months | 40.7-53.2
HR: 0.82
HR CI: 0.68-0.99
P: 0.044
1) Mechanism of action: mechanism of action: PTEN-deficient cell · 2) Kaplan-Meier survival data: primary endpoint: investigator-assessed rPFS
Capivasertib + Abiraterone vs Placebo + Abiraterone in Patients with PTEN-Deficient #mHSPC: Updated Overall Survival from CAPItello-281. Presented by @fizazi_karim @GustaveRoussy. #ESMO26 written coverage by @zklaassen_md > https://t.co/RNMWMqAvrS #ProstateCancer @myESMO https://t.co/qV0KyAPKjr
1) Slide: Talazoparib patient-reported outcomes forest plot: worse with talazoparib · 2) Slide: AKT inhibitor trials in prostate cancer forest plot: IPATential150, ProCAID
Beyond Progression – What Matters to Patients. Presented by @thomasmd @BrighamWomens. #ESMO26 written coverage by @zklaassen_md > https://t.co/DPYuwYsc74 #ProstateCancer #mCRPC #mHSPC @myESMO https://t.co/D9CI0Bqjpb
1) Kaplan-Meier survival data: updated DCO: OS (Fizazi) · 2) Kaplan-Meier survival data: updated DCO: OS in post hoc PTEN deficiency cut-off · 3) Kaplan-Meier survival data: updated DCO: Symptomatic skeletal event-free survival
CAPItello-281 in PTEN-def mHSPC (N=1,012):
🔹 OS: 57.4 v 46.5 mo (HR 0.82; p=0.044)
🔹 rPFS: 35.5 v 26.0 mo (HR 0.83)
🔹 Greater OS benefit w/ more stringent PTEN-loss cutoffs (HR 0.74–0.76)
Encouraging OS trend w/ capi/abi, though formal stat sig not achieve @OncoAlert #ESMO26 https://t.co/E6CedGuDrc
4 slide posts · 4 physiciansDual immunotherapy vs immunotherapy + TKI assigned by local PD-L1 status · 1L metastatic clear-cell RCC (pragmatic Phase 3; ESMO26: local vs central PD-L1 concordance, presented by Laurence Albiges; clinical outcomes not yet reported)All posts →
1) Trial design schema: (NCT06364631) pragmatic biomarker-driven phase 3 trial design · 2) Biomarker data: local vs central PD-L1 reproducibility: 90% concordance (N=374)
Excellent presentation by @AlbigesL! CARE1: local and central PD-L1 testing showed 90% concordance in metastatic RCC. An important foundation for testing biomarker-guided treatment selection. Clinical outcomes still to come! #ESMO26 @oncoalert @myESMO @GustaveRoussy https://t.co/lhlpgd1coJ
1) Biomarker data: title slide: feasibility and reproducibility of PD-L1 assessment · 2) Biomarker data: PD-L1 assessment conclusions
Rigorous biomarker trials are extremely difficult to design. @AlbigesL is doing it!
Looking forward to seeing the results at a future meeting.
#ESMO26 @OncoAlert https://t.co/2Gs9AjrUjf
[Slide 1]
MADRID 2026 ESMO congress
CARE1 PRAGMATIC CLINICAL TRIAL
Feasibility and reproducibility of PD-L1 assessment within CARE1: a phase III, randomized, biomarker-driven pragmatic trial to optimize first line treatment in patients with metastatic clear-cell renal cell carcinoma
Ronan Flippot, Nathalie Rioux-Leclercq, Stéphanie Foulon, Bohuslav Melichar, Sofie Wilgenhof, Manuela Schmidinger, Elena Verzoni, Katriina Jalkanen, Viktor Gruenwald, Cristina Suarez, Guillermo de Velasco, Cristiane Bergerot, Rose Woodward, Pierre Moricheau-Beauchant, Stéphane Sockeel, Maia Claveau, Malek Kammoun, Bernard Escudier, Thomas Powles, Laurence Albigès
October 25th, 2026
[Slide 4]
Conclusions
PD-L1 is evaluated as a pragmatic biomarker in CARE1, the 1st phase 3 trial comparing dual ICI and ICI + TKI in patients with mRCC
Local PD-L1 assessment within the CARE1 trial was highly reproducible regardless of disease features or antibodies
PD-L1 expression was associated with adverse clinical features including higher grade, presence of sarcomatoid or rhabdoid features, and necrosis
PD-L1 staining was associated with distinct vascular and immune phenotypes which could portend distinct sensitivity to dual ICI or ICI + TKI
Local PD-L1 has potential to inform patient selection for immunotherapy combinations
Ronan Flippot MD PhD
CARE-1 has received funding from the European Union's Horizon Europe research and innovation programme under grant agreement No. 101104801.
1) Biomarker data: PD-L1 positivity and baseline · 2) Biomarker data: PD-L1 positivity vs tissue
@AlbigesL with 1st deliverable for #CARE1 trial, PD-L1 stratified IO-IO vs IO-TKI in metastatic #kidneycancer. Local PD-L1 status correlated well w central review. Much more to come from this pragmatic trial!
@oncoalert #ESMO26 @myESMO https://t.co/K2N2PMPjFt
1) Biomarker data: local PD-L1 assessment workflow · 2) Biomarker data: local vs central PD-L1 concordance table (N=374, concordance 90%)
#ESMO26 Can PD-L1 help guide first-line treatment selection in metastatic ccRCC?
CARE1 is a phase III biomarker-driven trial testing dual ICI vs ICI + TKI according to local PD-L1 status.
🔹 Local vs central PD-L1 concordance: 90%
🔹 Reproducibility remained high across disease features, tissue source + different PD-L1 assays
🔹 PD-L1+ tumors were enriched for grade 4 disease, sarcomatoid/rhabdoid features + necrosis
🔹 PD-L1 expression was also associated with distinct immune + vascular phenotypes
🔑 These data show that local PD-L1 testing is feasible and reproducible in routine practice. The key question for CARE1 is whether this biomarker can identify who benefits most from dual ICI vs ICI + TKI.
@urotoday
Biomarker data: Sacituzumab tirumotecan + pembrolizumab PFS by TROP2 and PD-L1 in metastatic
SAC-TMT + pembro shows 68% response rates in metastastic bladder cancer #ESMO2026 . Trofuse-55 explores this combination in bladder sparing approaches in a randomized phase 3. The triplet with EVP seems a justified research randomised question. Triplet data from yesterday showed 81% RRs. @OncoAlert
PFS by TROP2 and PD-L1
Left panel: Median (95% CI), mo
TROP2 H-score <median | 11.2 (3.7–NR)
TROP2 H-score ≥median | 11.9 (5.6–21.1)
PFS, % 0–100; Time, mo 0 3 6 9 12 15 18 21 24 27 30
No. at risk
TROP2 H-score <median: 18 16 11 9 7 7 7 6 3 1 0
TROP2 H-score ≥median: 19 17 12 10 9 8 6 4 0 0 0
Right panel: Median (95% CI), mo
PD-L1 CPS <10 | 15.6 (7.2–NR)
PD-L1 CPS ≥10 | 5.7 (0.5–NR)
No. at risk
PD-L1 CPS <10: 32 30 22 18 15 15 13 9 4 1 0
PD-L1 CPS ≥10: 8 5 3 3 3 2 2 2 0 0 0
• In the overall cohort, median PFS was 11.2 (95% CI, 5.8–NR) months and median OS was NR (95% CI, 17.2 mo to NR)
Median study follow-up duration, 22.8 (range, 19.8–30.0) months. Median PFS and OS are based on the Kaplan-Meier method for censored data. Data cutoff, Jan 26, 2026.
Survival table
Endpoint: PFS by TROP2 H-score (left panel)
Arm | N | Median | Median CI
TROP2 H-score <median | 18 | 11.2 mo | 3.7–NR
TROP2 H-score ≥median | 19 | 11.9 mo | 5.6–21.1
Slide: Cross-trial comparison table of perioperative IO in MIBC: ENERGYZE, KN866
It hard to explain why 1 trial with gem/cis +/-PD(L)1 (NIAGARA) is +ve for EFS/OS and 2 very similar trials (presented today) are negative in MIBC. Potentially NIAGARA has the highest risk population, not all respond to IO and the maintenance phase the most effect- but the OS of gem/cis pembro HR of 1 is concerning. This reflects what we saw in metastatic disease with contradictory results for the big combination trials. Overall EVP looks better and more consistent #ESMO26 @myESMO @Annals_Oncology @OncoAlert
1) Response data: Is the combination hypothesis incorrect? pCR across · 2) Kaplan-Meier survival data: Were populations different? EFS in control · 3) Slide: How I explain these two studies · 4) Slide: Were studies designed differently? CA017-078, NIAGARA designs
So no one knows why Durvalumab worked and Pembrolizumab and Nivo failed in perioperative MIBC trials. @DrChoueiri @tompowles1 @HHammersMD @montypal @OncoAlert @myESMO #esmo26 https://t.co/3kilxJWJnB https://t.co/xf4MDnwcxJ
[Slide 1]
13:30 - 15:00 Proffered paper 1: Genitourinary tumour, renal and urothelial
CHAIRS: AXEL BEX, ANJA LORCH
Is the combination hypothesis incorrect?
pCR outcomes were consistent across trials
KEYNOTE-866
[Bar chart; y-axis: pCR Rate, % (95% CI)] Pembro + cis + gem vs Placebo + cis + gem
Estimated difference:b 8.9% (95% CI, 2.5-15.1)*
CA017-078
pCR overall (co-primary endpoint)a
9.5% (95% CI 2.3-16.7) (99.91% CI −2.6 to 21.6)b
[Bars; y-axis: Patients (%)] 39.1 | 29.6
Overall ITT
NIAGARA
Re-analysis (Apr 2024)
Odds ratio 1.60 (95% CI, 1.23-2.08) nominal P=0.0005
Durvalumab arm N=533: 37.3% 199/533 95% CI, 33.2-41.6
Comparator arm N=530: 27.5% 146/530 95% CI, 23.8-31.6
[y-axis: pCR rate (%)]
Robert Jones
Invited Discussant 47350, 47360 and 47420
BARCELONA AUDITORIUM - HALL 9
[Slide 2]
13:30 - 15:00 Proffered paper 1: Genitourinary tumour, renal and urothelial
CHAIRS: AXEL BEX, ANJA LORCH
Were populations different?
EFS outcomes were good in control arms of these studies
[Thumbnail 1] Primary End Point: EFS by Investigator Assessment, ITT Population — Pembro + cis + gem n = 453 vs Placebo + cis + gem n = 454; Events, n (%) 157 (34.7) vs 168 (37.0); Median (95% CI), mo 74.1 (72.4-NR) vs NR (67.7-NR); HR 0.88 (95% CI, 0.71-1.10), 1-sided P = 0.1366*; landmark labels 76.7%/70.0%, 69.2%/66.3%, 66.0%/62.3%, 63.5%/61.9%; No. at risk Pembro 453 401 366 338 329 304 296 273 224 175 114 51 11 0; Placebo 454 400 345 310 300 291 283 257 208 168 106 51 12 0
[Thumbnail 2] Event-free survival by treatment arm (co-primary endpoint) — NIVO+GC (N = 325) vs GC (N = 328); events 104/325 (32.0) vs 104/328 (31.7); median NR vs 67.6 (63.0-NE); HR (95% CI) 0.94 (0.72-1.24); HR (95.74% CI) 0.94 (0.71-1.25); P 0.6697; landmark labels 82.6%/78.6%, 72.3%/71.6%, 68.1%/68.5%, 67.3%/65.8%; No. at risk NIVO+GC 325 283 243 227 209 197 189 146 100 60 25 5 0 0; GC 328 271 219 199 187 176 168 131 90 61 23 4 1 0
KEYNOTE-866 | CA017-078 | NIAGARA
T2 (%) 15 | 76 | 40
N1 (%) 0.7 | Excluded | 5
ECOG 0 (%) 76 | - | 78
24 month EFS in control arm (%) 70.0 | 71.6 | 59.8
Robert Jones
Invited Discussant 47350, 47360 and 47420
BARCELONA AUDITORIUM - HALL 9
[Slide 3]
13:30 - 15:00 Proffered paper 1: Genitourinary tumour, renal and urothelial
CHAIRS: AXEL BEX, ANJA LORCH
How I explain these two studies
• More similarities than differences with NIAGARA
• Patient mix had better than expected prognosis
- this makes it harder to demonstrate modest improvement
• Small imbalances, unseen at baseline, may explain different findings between the trials
Robert Jones
Invited Discussant 47350, 47360 and 47420
BARCELONA AUDITORIUM - HALL 9
[Slide 4]
13:30 - 15:00 Proffered paper 1: Genitourinary tumour, renal and urothelial
CHAIRS: AXEL BEX, ANJA LORCH
Were studies designed differently?
Callouts: Only KN-866 used placebo | Differences in cisplatin eligibility | Only CA017-078 excluded N1 | Subtle differences in primary endpoint definitions | Some differences in statistical design
[Panel] Phase 3 KEYNOTE-866 Study Design (NCT03924856) — Adults with MIBC; clinical stage T2-T4aN0M0 or T1-T4aN1M0; urothelial histology ≥50%; eligible for RC + PLND; did not meet Galsky criteria for cisplatin ineligibility incl. GFR ≥60 mL/min; ECOG PS 0 or 1. R 1:1: n = 453 Pembrolizumab 200 mg + cisplatin 70 mg/m2 + gemcitabine 1000 mg/m2 x4 → RC + PLND → Pembrolizumab 200 mg Q3W 13 cycles; n = 454 Placebo + cisplatin + gemcitabine → Placebo Q3W 13 cycles. Primary end point: EFS by investigator assessment. Key secondary: OS and pCR (pT0N0) by central pathologist review. Other secondary: Safety.
[Panel] Study design: CA017-078 — Phase 3 randomized trial of neoadjuvant NIVO plus GC, followed by adjuvant NIVO, vs neoadjuvant GC alone for previously untreated MIBC (NCT03661320). Key inclusion: MIBC (predominant urothelial component); cT2-T4a, N0, M0; GFR ≥ 50 mL/min; ECOG PS 0-1. R 1:1: GC Q3W x 4 cycles + NIVO 360 mg Q3W x 4 cycles (N = 325) → radical cystectomy → NIVO 480 mg Q4W x 9 cycles; GC Q3W x 4 cycles (N = 328) → radical cystectomy → no further treatment. [Greyed arm: GC + NIVO 360 mg + BMS986205 (blinded) 100 mg QD → NIVO 480 mg Q4W + BMS986205 — TERMINATED (Dec 2021), excluded from formal testing of NIVO+GC vs GC alone.] Stratification: clinical stage (T2 vs T3/T4a); GFR (50 to <60 mL/min vs ≥60 mL/min); PD-L1 status (≥1% vs <1%/indeterminate/NE) by central review. Co-primary endpoints: pCR and EFS per BICR. Secondary: OS, safety. Exploratory: ctDNA analyses. Median follow-up (range): 54.5 months (39.4-77.0).
[Panel] NIAGARA: Study Design — Adults; cisplatin-eligible MIBC (cT2-T4aN0/1M0); UC or UC with divergent differentiation or histologic subtypes; evaluated and confirmed for RC; CrCl of ≥40 mL/min. R 1:1: Durvalumab arm N=533: neoadjuvant Durvalumab 1500 mg IV Q3W + Gemcitabine + cisplatin (4 cycles) → radical cystectomy → adjuvant Durvalumab 1500 mg IV Q4W (8 cycles); Comparator arm N=530: Gemcitabine + cisplatin → radical cystectomy → no treatment. Dual primary endpoints: EFS, pCR. Key secondary endpoint: OS. Safety. EFS was defined as: progressive disease that precluded RC; recurrence after RC; date of expected surgery in patients who did not undergo RC; death from any cause.
Placebo, primary endpoints
Robert Jones
Invited Discussant 47350, 47360 and 47420
BARCELONA AUDITORIUM - HALL 9
1) Slide: Practical decision framework for high-volume mHSPC in fit patients · 2) Slide: Practical decision framework for low-volume mHSPC in fit patients
#ESMO26 Personalized Systemic Therapy for mHSPC @AOmlin @urotoday
Two Practice Decision Frameworks:
🔔High volume mHSPC in fit pts
🔔Low volume mHSPC in fit pts https://t.co/kPJJpmonEJ
#ESMO26 | VOLGA | Presidential Symposium-1
In cisplatin-ineligible/refusing MIBC, neoadjuvant EV + perioperative durvalumab significantly improved EFS and OS vs the control arm.
EFS: HR 0.55 (24-month: 78% vs 69%)
OS: HR 0.58 (24-month: 83% vs 75%)
pCR: 45% vs 10%
Impressive results!
Unlike KEYNOTE-905/EV-303, EV was administered only in the neoadjuvant setting, with no adjuvant EV.
I’m looking forward to the discussion during the session.
Context: the LBA2 abstract in this post reports, for D+EV vs control, EFS HR 0.51 (0.38-0.67) with 24-month EFS 64% vs 45%, and OS HR 0.58 (0.40-0.83) with 24-month OS 78% vs 69% (VOLGA pre-planned interim analysis, data cutoff 2 Mar 2026).
LBA2 - Perioperative durvalumab with or without tremelimumab plus neoadjuvant enfortumab vedotin in muscle-invasive bladder cancer: Results from the phase 3 VOLGA trial
Speakers Thomas B. Powles (London, United Kingdom)
Lecture Time 16:54 - 17:06
Abstract
Background
The standard of care continues to evolve for patients (pts) with muscle-invasive bladder cancer (MIBC). We evaluated if neoadjuvant durvalumab (D) ± tremelimumab (T) plus enfortumab vedotin (EV) followed by radical cystectomy (RC) and adjuvant D±T would be an effective option.
Methods
VOLGA (NCT04960709), a phase 3, randomised, open-label trial, enrolled pts with MIBC (cT2-T4aN0/1M0 or cT1N1M0) ineligible for or who refused treatment (tx) with cisplatin and were planned for RC. Pts were randomised 1:1:1 to D+EV, D+T+EV, or control. D+EV and D+T+EV arms: perioperative D±T (neoadjuvant: 3 cycles of D, 2 cycles of T; adjuvant: 9 cycles of D, 1 cycle of T) and 3 cycles of neoadjuvant EV; RC was completed after neoadjuvant tx. Control arm: RC and observation or locally approved adjuvant tx. Dual primary endpoints were event-free survival (EFS): D+EV vs control and D+T+EV vs control. Overall survival (OS) was the key secondary endpoint. Safety was also assessed. Here we present results from a pre-planned interim analysis (data cutoff: 02 Mar 2026).
Results
Overall, 233, 233, and 229 pts were randomised to the D+EV, D+T+EV, and control arms, respectively. RC was completed in 85% (D+EV), 79% (D+T+EV), and 78% (control) of pts; and 55% (D+EV) and 42% (D+T+EV) completed adjuvant tx. Median EFS follow-up was 22.9 mo. D+EV showed significant improvements in EFS (HR 0.51 [95% CI, 0.38–0.67], P<0.0001; 24-mo rate 64% vs 45%) and OS (HR 0.58 [95% CI, 0.40–0.83], P=0.0027; 24-mo rate 78% vs 69%) vs control. D+T+EV also showed a significant improvement in EFS vs control (HR 0.61 [95% CI, 0.47–0.80], P=0.0004; 24-mo rate 60% vs 45%) but did not meet significance for OS; follow-up is ongoing. Pathological complete response per local review was observed in 45% (95% CI, 38.6–51.7) of pts in the D+EV arm and 10% (95% CI, 6.1–14.2) in the control arm. In the D+EV and D+T+EV arms, max. Grade 3/4 tx-related adverse events occurred in 30% and 42% of pts, respectively. ctDNA results will also be presented.
Conclusions
Dual primary endpoints of EFS were met. Perioperative D plus 3 cycles of neoadjuvant EV also demonstrated a significant improvement in OS vs control. Safety profiles were consistent with those of the individual agents.
Slide: Discussant scatter plot: absolute pCR gain vs EFS hazard ratio
#ESMO26 Optimal induction treatment in non-metastatic bladder cancer @niklas_kluemper @urotoday
Depth of response tracks with benefit: Absolute pCR gain vs EFS HR https://t.co/L7T3XcdOuD
[Slide 1]
Perioperative trials in MIBC – how much is enough?
Trial | IO agent (all perioperative) | Comparator | Neoadj. cytotoxic | Adj. cytotoxic | Adjuvant cytotoxic received (% of randomised) | EFS | OS
Chemotherapy backbone
NIAGARA1 | Durvalumab | Neoadj. GC | GC x4 | None | Not applicable | Positive HR 0.68 | Positive HR 0.75
KEYNOTE-8662 | Pembrolizumab | Neoadj. GC | GC x4 | None | Not applicable | Negative HR 0.88 | Negative HR 1.00
ENERGIZE3 | Nivolumab | Neoadj. GC | GC x4 | None | Not applicable | Negative HR 0.94 | Negative HR 0.88 (immature)
Enfortumab vedotin backbone
KN-905/EV-3034 | Pembrolizumab | Surgery alone | EV x3 | EV x6 | Adjuvant started 59% (100/170); all 6 EV cycles ≥29%a | Positive HR 0.40 | Positive HR 0.50
KN-B15/EV-3045 | Pembrolizumab | Neoadj. GC | EV x4 | EV x5 | Adjuvant started 65% (262/405); adj. EV received 56% (225/405)b | Positive HR 0.53 | Positive HR 0.65
VOLGA (D+EV)6 | Durvalumab | Surgery ± adj. | EV x3 | None | Not applicable | Positive HR 0.51 | Positive HR 0.58
VOLGA (D+T+EV)6 | Durvalumab + tremelimumab | Surgery ± adj. | EV x3 | None | Not applicable | Positive HR 0.61 | Not significant HR 0.77 (interim)
aData cutoff Jun 2025; median 6 adjuvant EV cycles among starters, so at least half of starters received all 6. bMedian 5 (range 1-5) adjuvant EV cycles among recipients (Suppl. Table S3); 208/405 (51%) completed the whole adjuvant phase. GC, gemcitabine-cisplatin; EV, enfortumab vedotin; D, durvalumab; T, tremelimumab. Shaded rows: adjuvant cytotoxic component. HR: EFS / OS vs comparator.
Niklas Klümper, X: @niklas_kluemper
Powles T, NEJM 2024; Bedke J, ESMO 2026 (4735O); Necchi A, ESMO 2026 (4736O); Vulsteke C, NEJM 2026; Galsky MD, NEJM 2026; Powles T, ESMO 2026 LBA2
[Slide 3]
VOLGA: perioperative Durva, only neoadjuvant/ induction EV
n = 695, cisplatin-ineligible or -declining | 3x EV before cystectomy, no adjuvant EV
Arm 1: D + T + EV
1:1:1, n = 695 in total
Arm 2: D + EV
Arm 3: RC
± approved adjuvant therapy
RC
Enfortumab vedotin
Durvalumab
Tremelimumab
Niklas Klümper, X: @niklas_kluemper
Powles T et al., ESMO 2026 LBA2 (Presidential Symposium); VOLGA NCT04960709; data cutoff 02 March 2026
[Slide 4]
VOLGA: durvalumab + 3 cycles of EV vs cystectomy
Durvalumab + EV arm | ITT | median follow-up 23 (EFS) and 26 (OS) months
Event-free survival HR 0.51 (0.38-0.67) 24 mo: 64% vs 45%
Overall survival HR 0.58 (0.40-0.83) 24 mo: 78% vs 69%
D+EV N=233 | Control N=229
Probability of EFS
Probability of OS
Time from randomisation (months)
Durvalumab+EV arm
Control arm
No. of patients at risk
40% vs 8% pCR, central review (local: 45% vs 10%)
60% ctDNA clearance before cystectomy (52/87, exploratory)
85% vs 79% underwent cystectomy (198/233 vs 180/229)
For patients: similar benefit to EV-P with only 3 EV cycles - 64% vs 45% event-free and 78% vs 69% alive at 2 years
Niklas Klümper, X: @niklas_kluemper
Survival table
Endpoint: Event-free survival and overall survival, ITT (D+EV vs control/cystectomy)
Durvalumab + EV (D+EV) | 233
Control (radical cystectomy) | 229
HR: EFS 0.51; OS 0.58
HR CI: EFS 0.38-0.67; OS 0.40-0.83
24-mo EFS 64% vs 45%
24-mo OS 78% vs 69%
pCR 40% vs 8% central review (local 45% vs 10%)
Underwent cystectomy 85% vs 79% (198/233 vs 180/229)
ctDNA clearance before cystectomy 60% (52/87, exploratory)
Honoured to have had the opportunity to present "Optimal induction treatment in non-metastatic bladder cancer" at #ESMO26 in Madrid!
🚨 Does a deeper pathological response translate into greater survival benefit in perioperative MIBC?
An intriguing pattern across four phase III trials:
🔹 NIAGARA: ΔpCR +10 pp | EFS HR 0.68
🔹 KEYNOTE-B15: +23 pp | HR 0.53
🔹 VOLGA: +32 pp | HR 0.51
🔹 KEYNOTE-905: +49 pp | HR 0.40
Larger absolute pCR gains appear to track with greater EFS benefit.
But the comparator matters!
KEYNOTE-905 and VOLGA used surgery-based controls without neoadjuvant systemic therapy (control "pCR" ~8–9%), whereas NIAGARA and KEYNOTE-B15 used active neoadjuvant cisplatin-based chemotherapy.
Thus, the magnitude of ΔpCR is not directly comparable across trials.
The key question: Can pCR, combined with utDNA + ctDNA clearance, become a reliable tool for response-adapted treatment intensity?
⚠️ This is an exploratory, trial-level observation—not proof that pCR improvements cause EFS benefits or that pCR is a validated surrogate endpoint!
Better biomarkers could help us maximize cure while minimizing overtreatment. 🔬
#ESMO26 #BladderCancer
@weoncologists @urotoday @Uromigos
@OncoAlert Faculty: @DrChoueiri @tompowles1 @apolo_andrea @neerajaiims @montypal @Silke_Gillessen @AOmlin @brian_rini @PGrivasMDPhD @TiansterZhang @amerseburger @DrDanielHeng @HHammersMD @scocmem @AndreaNecchi @AmandaNizamMD @drenriquegrande @nataliagandur @AlbigesL @cdanicas @declangmurphy @seanmmcbride @shilpaonc @DrRanaMcKay @scserendipity1 @DrYukselUrun @ravikanesvaran @BraunMDPhD @EfstathiouEleni @mzugman @crisbergerot @Markuseckstein3
1) Slide: Industry satellite symposium slide: EV+P · 2) Trial design schema: EV-304 study design · 3) Slide: Industry symposium summary slide: EV+P
@PGrivasMDPhD rocking the stage #ESMO26 discussing current treatment landscape in advanced/metastatic and in muscle-invasive #urothelial #carcinoma @myESMO @Uromigos https://t.co/Z9gGr7aptK
[Slide 1]
EV+P is approved across the UC continuum and is the recommended 1L treatment for unresectable/mUC*1
ESMO Clinical Practice Guidelines2
Treatment-naïve mUC
EV+P†§
Disease progression: • PBCT‡ • Erdafitinib¶
If EV+P is unavailable or contraindicated
Treatment-naïve mUC
Cis-eligible: Nivolumab + CisGem§
Cis- or carbo-eligible: CisGem or CarboGem
Disease progression: • Pembrolizumab§ • Atezolizumab
No disease progression: • Maintenance avelumab§††
Disease progression: • Erdafitinib¶§ • EV§ • Sacituzumab govitecan†§ • Vinflunine or taxanes‡‡¶¶§§
Figure adapted from Figure 1 from Powles T et al. 2024.2
*Disclaimer: The ESMO Clinical Practice Guideline aligns with the EU regulatory approval for P 'for the 1L treatment of unresectable or mUC in adults'; †No longer approved in the US; not EMA approved; ‡Rechallenge with single-agent ICI is not encouraged without further evidence; ¶In tumours with selected FGFR3 DNA fusions and mutations; §ESMO-MCBS v1.1 was used to calculate scores for new therapies/indications approved by the EMA or FDA. The scores have been calculated and validated by the ESMO-MCBS Working Group and reviewed by the authors (https://www.esmo.org/guidelines/esmo-mcbs/esmo-mcbs-evaluation-forms); ††This should be assessed within 10 weeks of completion of chemotherapy; ‡‡Rechallenge with PBCT may be considered if progression occurred 12 months after the end of previous PBCT or 12 months after the end of previous PBCT and maintenance avelumab; ¶¶Platinum doublets to be considered if the treatment-free interval from the last PBCT is >1 year; §§To be considered when other therapies are not available.
1L, first-line; Carbo, carboplatin; Cis, cisplatin; EMA, European Medicines Agency; ESMO, European Society for Medical Oncology; EV, enfortumab vedotin; FDA, U.S. Food and Drug Administration; FGFR3, fibroblast growth factor receptor 3; Gem, gemcitabine; ICI, immune checkpoint inhibitor; MCBS, Magnitude of Clinical Benefit Scale; mUC, metastatic urothelial carcinoma; P, pembrolizumab; PBCT, platinum-based chemotherapy; UC, urothelial carcinoma.
1. Enfortumab vedotin. Summary of Product Characteristics; 2. Powles T et al. Ann Oncol 2024;35:485–490.
[Slide 3]
EV-304 study: Pivotal Phase III trial of perioperative EV+P vs. CisGem and RC+PLND in cisplatin-eligible patients with MIBC
Adults with MIBC
Key eligibility criteria
• Clinical stage T2–T4aN0M0 or T1–T4aN1M0 by central assessment
• Tumours with ≥50% urothelial histology
• Did not meet any Galsky criteria for cisplatin ineligibility
• ECOG PS 0–1
• Eligible for curative-intent RC+PLND
N=808 | R 1:1
n=405: Four cycles neoadjuvant EV 1.25 mg/kg Day 1 and Day 8 IV Q3W + Four cycles neoadjuvant pembrolizumab 200 mg Day 1 IV Q3W → RC+PLND → Five cycles adjuvant EV 1.25 mg/kg Day 1 and Day 8 IV Q3W + 13 cycles adjuvant pembrolizumab 200 mg Day 1 IV Q3W
n=403: Four cycles neoadjuvant CisGem 70 mg/m2 Day 1 IV (Cis) + 1000 mg/m2 Day 1 and Day 8 IV (Gem) → RC+PLND → Observation*
Endpoints1
• Primary: EFS by BICR
• Key secondary: OS and pCR by central pathologist review
• Other secondary: pDS and safety
Participants were randomised between 12 May 2021 and 12 December 2023. Data cutoff date: 27 October 2025.
*As of February 2023, adjuvant nivolumab was permitted when clinically indicated and regionally available.
BICR, blinded independent central review; Cis, cisplatin; ECOG PS, Eastern Cooperative Oncology Group performance status; EFS, event-free survival; EV, enfortumab vedotin; Gem, gemcitabine; IV, intravenous; MIBC, muscle-invasive bladder cancer; OS, overall survival; P, pembrolizumab; pCR, pathological complete response; pDS, pathological downstaging rate; Q3W, every 3 weeks; R, randomised; RC+PLND, radical cystectomy with standard pelvic lymph node dissection.
Galsky MD et al. N Engl J Med 2026;395:338-348.
[Slide 4]
Summary
EV+P is the recommended 1L SOC for LA/mUC in patients who are platinum-eligible, as included in multiple international treatment guidelines including ESMO and EAU guidelines1,2
In EV-302, ~3.5-year follow-up data confirm sustained OS benefit and higher ORR and CR rates for EV+P vs. PBCT in 1L LA/mUC, with patients continuing to achieve CR over time. No new safety findings were identified3
Real-world outcomes closely mirror those of EV-302, with consistent ORR, CR, and survival benefit observed4–7
Data from the EV-303 and EV-304 trials supports perioperative EV+P as an effective treatment option for patients with resectable MIBC, regardless of cisplatin-eligibility8,9
1L, first-line; CR, complete response; EAU, European Association of Urology; ESMO, European Society for Medical Oncology; EV, enfortumab vedotin; LA, locally advanced; MIBC, muscle-invasive bladder cancer; mUC, metastatic urothelial carcinoma; ORR, objective response rate; OS, overall survival; P, pembrolizumab; SOC, standard of care.
1. European Association of Urology. Muscle-invasive and metastatic bladder cancer. Available at: https://uroweb.org/guidelines/muscle-invasive-and-metastatic-bladder-cancer. Last accessed: October 2026; 2. Powles T et al. Ann Oncol 2024;35:485–490; 3. Powles TB. Presented at ASCO 2026. #4507; 4. Zschäbitz S et al. Cancer Immunol Immunother 2026;75:184; 5. Niedersüß-Beke D et al. Int J Cancer 2025;158:1654–1665; 6. Jindal T et al. Presented at ESMO 2024. Abstract 1988P; 7. Jain P et al. Clin Genitourin Cancer 2025;23:102453; 8. Vulsteke C et al. N Engl J Med 2026;394:1257–1269; 9. Galsky MD et al. N Engl J Med 2026;395:338-348.
1) Biomarker data: KIM-1 dynamics and tissue biomarkers · 2) Slide: Integrated tissue, blood and HRQoL profiling to guide · 3) Trial design schema: CARE-1 study design and PD-L1 · 4) Biomarker data: Need for validated biomarkers and PROs
Brilliant discussion by @ZaydTippu, tying together #ESMO26 abstracts from @AlbigesL, @VincentWenxinXu & @DrDanielHeng. Not easy to weave between abstracts pertaining to PD-L1 assessment in #CARE1, #KIM1 in #COSMIC313 & #HRQOL in #LITESPARK11, but he pulls together a very cohesive story. Definitely worth a watch! @OncoAlert
[Slide 1]
ESMO ANNALS OF ONCOLOGY
ORIGINAL ARTICLE · Articles in Press, October 25, 2026
Final prespecified analysis of the phase 3 LITESPARK-011 study: belzutifan plus lenvatinib versus cabozantinib for advanced renal cell carcinoma after anti–PD-(L)1 therapy
D.Y.C. Heng 1,* · M. Schmidinger 2 · R. McDermott 3 · ... · D. Vickery 29 · R.J. Motzer 30,* on behalf of the LITESPARK-011 Investigators ... Show more
HIGHLIGHTS
• Belzutifan plus lenvatinib continues to demonstrate PFS and ORR benefit versus cabozantinib at the final analysis of LITESPARK-011
[Slide 2]
ESMO ANNALS OF ONCOLOGY
ORIGINAL ARTICLE · Articles in Press, October 25, 2026
Pembrolizumab plus lenvatinib with belzutifan or quavonlimab as first-line therapy for advanced renal-cell carcinoma: randomized open-label phase 3 LITESPARK-012 study
Brian I. Rini 1 · Toni K. Choueiri 2 · Martin H. Voss 3 · ... · Joseph E. Burgents 19 · Karla G. Rodriguez-Lopez 19 · Thomas B. Powles 20 ... Show more
Highlights
• LITESPARK-012 evaluated novel first-line combination therapies for advanced RCC.
• Neither HIF-2α (belzutifan) nor CTLA-4 (quavonlimab) blockade added to the efficacy of first-line pembrolizumab plus lenvatinib in advanced RCC.
1) Slide: Educational slide: how much systemic therapy in high-risk localised · 2) Biomarker data: perioperative apalutamide summary: pCR/MRD, 5-year MFS · 3) Slide: Comparison of STAMPEDE, ENZARAD and intensification results · 4) Slide: Evidence for 18-36 months of ADT in high-risk localized prostate cancer
🎯 #ESMO26 Starting the Day with Excellent educational session of How to optimise care for pts receiving prostate cancer systemic therapy.
👉 @BarbaraJereczek nice presentation updating the management of HR-PC pts! 😊@OncoAlert @myESMO @APCCC_Lugano @urotoday @GuardConsortium https://t.co/2iNYcQokIz
[Slide 1]
How much systemic therapy?
ADT remains essential – but who needs intensification?
• Long-term ADT – backbone of treatment (typically 18–36 months)
• ADT + 2 years abiraterone – standard for selected very-high-risk / cN1 M0
• STAMPEDE – major change in practice
• ENZARAD – negative for MFS; 8-y MFS 74% vs 72%
• ARPI intensification – not simply a class effect
• Docetaxel – very limited role in M0 locally advanced disease
and DASL-HiCaP...
Bottom line: ADT remains the backbone. Intensify selectively — strongest evidence supports abiraterone, while enzalutamide cannot be considered interchangeable.
Selected references
Bolla et al. N Engl J Med. 2009 Nabid et al. Eur Urol. 2018 Attard et al. Lancet. 2022 (STAMPEDE)
Nguyen et al. ESMO Congress 2025, LBA86 (ENZARAD) James et al. JNCI Cancer Spectr. 2022
[Slide 2]
PROTEUS: a new piece of the puzzle
1 Neoadjuvant 6 months
ADT ± apalutamide
2 Radical prostatectomy + PLND
3 Adjuvant 6 months
ADT ± apalutamide
pCR/MRD
8.9% vs 1.0%
5-year MFS
78.2% vs 73.5%
Post-op RT
~1 in 3
patients
High-risk / locally advanced prostate cancer often requires multimodal care.
Taplin ME, et al. Perioperative Apalutamide in High-Risk Localized Prostate Cancer. N Engl J Med. 2026;395:546–560.
[Slide 3]
PROTEUS, STAMPEDE, DASL-HiCaP and ENZARAD: what can we conclude?
Different clinical contexts and designs — NOT head-to-head comparisons
PROTEUS
Surgery pathway
Perioperative apalutamide + ADT
5-year MFS 78.2% vs 73.5%
STAMPEDE
Definitive RT pathway
ADT ± abiraterone-based intensification
MFS HR 0.54; OS HR 0.63
ENZARAD
Definitive RT pathway
24-month enzalutamide + ADT
8-year MFS 74% vs 72%; HR 0.88
No significant MFS benefit
DASL-HiCaP
Definitive or salvage RT
96-week ADT ± darolutamide
4-year MFS 95% vs 88%;
HR 0.42
Systemic intensification may strengthen local treatment · but results are not uniform
Sources: Taplin et al. NEJM 2026 (PROTEUS); STAMPEDE; DASL-HiCaP ESMO 2026 abstract; ENZARAD ESMO 2025 abstract.
[Slide 4]
The Evidence Mandates 18–36 Months for High-Risk Disease
Global Consensus
ESMO and EAU guidelines remain unified: true high-risk localized disease requires 18–36 months (2–3 years) of ADT.
Proven Survival Benefit
Meta-analyses (Kishan 2022, Zaorsky 2025) and landmark trials (RADICALS-HD, STAMPEDE) prove premature cessation sacrifices Metastasis-Free Survival (MFS) and Overall Survival (OS).
The ARPI Intensification
Adding next-generation androgen receptor pathway inhibitors (ARPIs) enhances efficacy but does not replace the need for long-term ADT duration.
1) Slide: Stage migration between conventional imaging and PSMA PET · 2) Biomarker data: Available biomarkers for treatment personalisation · 3) Biomarker data: STAMPEDE biomarker analysis: transcriptome-based · 4) Slide: APCCC 2026 expert voting on ADT plus ARPI with or without docetaxel
🎯 #ESMO26 Excellent update of the management of mCSPC pts by @AOmlin a new intensification triplets are arriving! @OncoAlert @myESMO @APCCC_Lugano @Silke_Gillessen @GuardConsortium @ThePCCTC https://t.co/G39gATiTOI
[Slide 1]
Stage Migration with PSMA PET Imaging
MIGRATION BETWEEN CONVENTIONAL IMAGING AND PSMA PET
Conventional imaging (CI) (CT/MRI + Bone Scan) ------> PSMA-PET
High-Volume Disease (HVD-CI) n = 17
Low-Volume Disease (LVD-CI) n = 50
High-Volume Disease (HVD-PET) n = 27
Low-Volume Disease (LVD-PET) n = 24
Non-Metastatic Disease (M0-PET) n = 16
94%
22%
48%
30%
Consider over- but also under-treatment depending on imaging used*
Note: only 67 patients
Aurelius Omlin
*Unterrainer et al. J Nucl Med 2025; 66:54–60
Sundahl et al. Eur Urol. 2021 May;79(5):565-567.
[Slide 2]
Available Biomarkers for Treatment Personalisation
Method | Biomarker Result | Potential Treatment Implication
PSA / Androgen Receptor (Serum, IHC) | Approx. 99% positive | ADT + ARPI
Imaging by PSMA PET/CT* | 87% positive (syn- and metachronous mHSPC/APMS) | 177Lu-PSMA-617#
Immunohistochemistry on tumour tissue** | 25% PTEN-loss ≥90% (synchronous mHSPC/mAPMS) | ADT + abiraterone + capivasertib#
Next-Generation Sequencing (Tumour and/or ctDNA/Plasma)
AMPLITUDE Panel*** | 18% HRR-alterations — of which 56% BRCA1/2 (syn- and metachronous mHSPC/APMS) | ADT + abiraterone + niraparib (optional 6x docetaxel upfront)##
TALAPRO-3 Panel**** | 19% HRR-alterations — of which 35% BRCA1/2 (syn- and metachronous mHSPC/APMS) | ADT + enzalutamide + talazoparib#
* PSMAddition (68Ga-PSMA-11 PET/CT)
** CAPItello-281 (Antibody for PTEN, SP218; Roche Diagnostics, Tucson, AZ)
*** AMPLITUDE: BRCA1/2, BRIP1, CHEK2, CDK12, FANCA, PALB2, RAD51B, RAD54L
**** TALAPRO-3: ATM, ATR, BRCA1/2, CDK12, CHEK2, FANCA, MLH1, MRE11A, NBN, PALB2, RAD51C
# Not approved yet by EMA
## approved by EMA only for BRCA1/2
Aurelius Omlin
[Slide 3]
STAMPEDE – Biomarker Analysis
Associated with shorter survival on abiraterone
Cellular plasticity / Immune activity / Tumor proliferation / Higher AR signalling / Longer survival
RNA profiling of advanced prostate cancer
Randomized in STAMPEDE trial (survival status after ~14 years)
Abiraterone Docetaxel
Tumor biopsy RNA
Transcriptome classifiers
PTEN inactivity
High Decipher score
Predict survival benefit from docetaxel in metastatic patients
Transcriptome-based classification of PTEN activity
PTEN inactive 53% of pts
PTEN active 47% of pts
A M1, PTEN inactive — Overall survival — Years since randomization
B M1, PTEN active — Overall survival — Years since randomization
PTEN active / PTEN inactive — Lower Decipher / High Decipher
G Docetaxel treatment effect (all-cause death hazard ratio)
Aurelius Omlin
* Note: PTEN IHC by Cell Signaling Technology, Clone D4.3 XP antibody
Grist et al. Cell, 2025
Survival table
Endpoint: Overall survival, M1 patients, ADT vs ADT + docetaxel, by transcriptome PTEN status
PTEN inactive: ADT (reference) vs ADT + doce
PTEN active: ADT (reference) vs ADT + doce
[Slide 4]
ADT plus ARPI ± Docetaxel: Experts' Treatment Choice
| Disease | ADT + ARPI | ADT + ARPI + docetaxel | ADT + ARPI + 177Lu-PSMA | Comment
PSMA positive, no HRR, no PTEN loss | Synchronous, high-volume | 25% | 68% | 7% |
| Metachronous, high-volume | 45% | 41% | 13% | 1% for ADT + ARPI (± docetaxel) + PARPi
PSMA positive, no HRR, no PTEN loss | Synchronous, low-volume | 90% | 3% | 6% | 1% for ADT + ARPI (± docetaxel) + PARPi
| Metachronous, low-volume | 90% | 1% | 7% | 2% for ADT + ARPI (± docetaxel) + PARPi
Most uncertainty around metachronous high-volume disease
Aurelius Omlin
Source: APCCC 2026 consensus voting, publication pending
Sumanta K. Pal, MD, FASCO@montypal
1) Trial design schema: BRAVE-RCC study design slide (Laurence Albiges, ESMO 2026) · 2) Slide: Outlook: where cellular therapy for RCC goes next (ESMO 2026 RCC session) · 3) Mechanism of action: Barrier 3: Payload - CD70/TIM-1 ADCs in ccRCC (ESMO 2026)
Brilliant talks from @AlbigesL, @KoenvdMijn, @YujiMiura5 & @BraunMDPhD at #ESMO26 highlighting novel therapies for #kidneycancer. Lots of perspective shifting evidence & discussion - I’m walking away with (1) the thought that we could still optimize ADCs for RCC despite multiple failed attempts (need to watch the talk!) and (2) the need to explore “smarter TILs”. @OncoAlert
1) Slide: Discussant 'My Thoughts' on dual primary endpoints not met · 2) Slide: Positioning HIF-2a inhibition: completed/ongoing HIF-2a
Pragmatic overview and RCC discussion with #DrNaomiHaas: LITESPARK-012 shows no benefit from intensifying 1L Pembro/Len, LITESPARK-011 supports Bel/Len after IO progression, and PE-PE explores Pembro + MDT in oligometastatic RCC.
Right drugs, right setting, right patients?
#RCC @myESMO @OncoAlert #ESMO26
[Slide 1]
My Thoughts
- Did LITESPARK-012 meet its primary endpoint?
- No, dual primary endpoints of PFS and OS were not met for either drug combinations of lenvatinib/belzutifan/ pembrolizumab or lenvatinib + quavonlimab + pembrolizumab
- Are these findings practice changing? No
- Bispecific T cell engagers are under investigation as future first-line therapies
- What this means for patients:
- 4 approved SOC regimens remain as benchmark first-line therapies for clear cell renal cancer:
- Ipilimumab +nivolumab
- Axitinib +pembrolizumab
- Cabozaninib + nivolumab
- Lenvatinib + pembrolizumab
[Slide 2]
Positioning HIF-2α inhibition
- HIF-2α pathway modulation studies are ongoing
HIF-2α inhibitors
Completed
(NCT03634540) Phase II LITESPARK-003 belzutifan + cabozantinib (Choueiri, Lancet 2025) -active and tolerable
Ongoing
(NCT07011719) PEAK-1 (Phase 3): casdatifan + cabozantinib versus cabozantinib alone in patients with metastatic ccRCC post immunotherapy
( NCT05536141) ARC-20 casdatifan monotherapy post PD-(L)1 and VEGFR-TKI therapies (arms include ivonescimab VEGFTKI-IO bispecific)
(NCT07489495) LITESPARK-034/LS-034/MK-6482-034 Zanzanitinib + belzutifan vs belzutifan post VEFRTKI +ICI
(NCT07227402) LITESPARK-033 Belzutifan and Zanzalintinib Versus Cabozantinib post Adjuvant Therapy
Glue Degraders
(NCT07300241) Phase I/II NEO-811 investigational molecular glue degrader
(NCT07195682) BMS-986506: cereblon E3 ligase modulator (CELMoD) / molecular glue candidate
Pre-clinical Molecular Glue cc-885 Inhibits VHL-Deficient Clear Cell Renal Cell Carcinoma
[Slide 1]
16:30 - 18:15 Presidential Symposium I
CHAIRS: FABRICE ANDRÉ, JAMES LARKIN
EFS and pCR in VOLGA and KN905/EV303: hint at contribution of components?
[Top-left inset: reproduced VOLGA EFS by BICR D+EV vs control KM curve; small text]
D+EV N=233 | Control N=229
HR (95% CI) 0.51 (0.38–0.67); Stratified log-rank P value <0.0001
73% | 64% (D+EV); 50% | 45%[?] (Control)
Durvalumab+EV arm | Control arm | Median follow-up: 23 months
[Bottom-left: KEYNOTE-905/EV-303 EFS KM curve]
| EV + pembro (N = 170) | Control (N = 174)
Events, n (%) | 48 (28.2) | 95 (54.6)
Median, mo (95% CI) | NR (37.3–NR) | 15.7 (10.3–20.5)
HR 0.40, 95% CI 0.28–0.57, one-sided P <.0001*
77.8% | 74.7% EVP; 55.1% | 39.4% control
Event-free survival, %; Months 0-60
No. at Risk
EV + pembro | 170 | 140 | 116 | 73 | 56 | 42 | 35 | 16 | 3 | 0 | 0
Control | 174 | 116 | 84 | 48 | 33 | 22 | 14 | 9 | 1 | 0 | 0
Cross-trial differences limit comparison
• Both trials positive for EFS
• Lower HR in KN905/EV303 (0.40 vs 0.51)
• 95% CIs overlap
pCR: lower with D+EV compared to EVP
Less neoadjuvant activity than EV+pembro?
EV + durvalumab | EV + pembrolizumab
VOLGA investigator-assessed 45% | VOLGA central review 40% | KEYNOTE-905/EV-303 57% | KEYNOTE-B15/EV-304 56%
Michiel van der Heijden
Invited Discussant LBA2
ALICANTE AUDITORIUM - HALL 6
Survival table
Endpoint: EFS, KEYNOTE-905/EV-303 (EV + pembro vs control), as reproduced on discussant slide
Arm | N | Median | Median CI
EV + pembro | 170 | NR | 37.3–NR
Control | 174 | 15.7 | 10.3–20.5
HR: 0.40
HR CI: 0.28–0.57
P: one-sided P <.0001
Landmark rates:
12 months: EV + pembro 77.8% | Control 55.1%
24 months: EV + pembro 74.7% | Control 39.4%
[Slide 2]
16:30 - 18:15 Presidential Symposium I
CHAIRS: FABRICE ANDRÉ, JAMES LARKIN
Perioperative EV-IO trials in MIBC - Conclusions
• Three positive trials with perioperative EV+IO for patients with MIBC
• EFS HRs somewhat different, landmark 2yr OS similar, further follow-up needed
• VOLGA shows high efficacy without adjuvant EV
• Trials on the adjuvant component(s) of peri-operative regimens are needed
• Whereas less may be enough, with anti-CTLA-4, more seems to be too much.
• Congratulations to the study team for completing VOLGA in a difficult to study disease setting!!
Trial | EV | EV cycles | Control arm | 24-mo EFS Exp | 24-mo EFS Control | EFS HR (95% CI) | 24-mo OS Exp | 24-mo OS Control | OS HR (95% CI)
VOLGA (D+EV)1 | Neoadjuvant only | 3 | RC ± approved adjuvant | 64% | 45% | 0.51 (0.38-0.67)* | 78% | 69% | 0.58 (0.40-0.83)*
VOLGA (D+T+EV)1 | Neoadjuvant only | 3 | RC ± approved adjuvant | 60% | 45% | 0.61 (0.47–0.80)* | 75% | 69% | 0.77 (0.54–1.07)
KEYNOTE-905/EV-3032 | Perioperative | 3+6=9 | RC alone | 74.7% | 39.4% | 0.40 (0.28–0.57)* | 80% | 63.1% | 0.50 (0.33–0.74)*
KEYNOTE-B15/EV-3043 Cisplatin eligible | Perioperative | 4+5=9 | Neoadj GC → RC | 79.4% | 66.2% | 0.53 (0.41–0.79)* | 87% | 81.3% | 0.65 (0.48–0.89)*
1Powles, ESMO 2026 2Vulsteke, NEJM 2026; 3Galsky, NEJM 2026; *significant. RC, radical cystectomy; GC, gemcitabine-cisplatin; D, durvalumab; T, tremelimumab; Exp, experimental arm. 24-month rates are Kaplan-Meier estimates.
Michiel van der Heijden
Invited Discussant LBA2
ALICANTE AUDITORIUM - HALL 6
1) Slide: Cross-trial table: VOLGA vs KEYNOTE-905/EV-303 · 2) Kaplan-Meier survival data — KEYNOTE-B15 / EV-304, KEYNOTE-905 / EV-303 · 3) Slide: VOLGA design + EFS/OS curves recap · 4) Kaplan-Meier survival data: EFS and pCR in VOLGA
#ESMO26 Dr. Michiel van der Heijden discussed the implications of VOLGA alongside KEYNOTE-905 and KEYNOTE-B15:
🔹 EV + durvalumab doublet: EFS HR 0.51; OS HR 0.58, a 42% reduction in the hazard of death.
🔹 Triplet (+ tremelimumab): EFS HR 0.61; OS not yet significant. More toxicity, without a demonstrated advantage from CTLA-4 blockade.
🔹 Crucial difference: VOLGA used only 3 neoadjuvant cycles of EV, followed by RC and adjuvant durvalumab, without adjuvant EV.
🔹 The unresolved question: Which patients need adjuvant therapy? pCR is informative, but does not guarantee eradication of micrometastatic disease.
🚨Key message: The doublet is the regimen most likely to move forward. The next breakthrough may come from response-adapted treatment, not adding another drug.
@UroToday @myESMO
Starting day 3 @myesmo #ESMO26 w kidney/bladder orals! What a great lineup of trials & speakers — #LITESPARK012 w @DrChoueiri, #LITESPARK011 w @DrDanielHeng, #PEPE w @Iacovelli, phase 1 of XmAb819 w @montypal & AK112 ivonescimab w #JunGuo
@oncoalert https://t.co/PQ1kKTxdrE
[Slide 2]
Background
• Belzutifan is a first-in-class HIF-2α inhibitor approved as:
– Monotherapy in patients with advanced ccRCC following anti–PD-(L)1 therapy and ≥1 (US) or ≥2 (EU) VEGFR-TKIs
– Adjuvant therapy in combination with pembrolizumab for adults with ccRCC at increased risk of recurrence following surgery (US)
• Addition of belzutifan to VEGFR-TKI therapy in advanced ccRCC may enhance therapeutic benefit through orthogonal inhibition of HIF-2α and VEGF-mediated signaling pathways
• Belzutifan + lenvatinib significantly improved PFS and ORR versus cabozantinib in participants with advanced ccRCC following anti–PD-(L)1 therapy in the phase 3 LITESPARK-011 study^1
– PFS at IA2: 14.8 vs 10.7 mo, HR 0.70 (95% CI 0.59–0.84), P=0.00007
– ORR at IA1: 52.6% vs 39.6%, P=0.0002
– These findings led to the US approval of belzutifan in combination with lenvatinib in adults with advanced ccRCC following anti–PD-(L)1 therapy on 24 September 2026
• We present LITESPARK-011 final analysis results
1) Trial design schema: VOLGA design, EFS and OS · 2) Slide: Perioperative trials in MIBC - how much · 3) Kaplan-Meier survival data: OS in VOLGA
Fantastic discussion by @MichvdHeijden putting the data in (a now wide complicated) context and modeling a patient's journey
It's truly been inspiring watching the progress made in bladder cancer over the last years✨
#ESMO2026 @OncoAlert https://t.co/0T6G3aNFla
[Slide 1]
[Composite discussant slide: VOLGA study design schema + EFS and OS KM thumbnails; small embedded text low resolution]
Patients
• Adults aged ≥18 years
• MIBC (cT2-T4aN0/1M0 or cT1N1M0) by local assessment
• Ineligible for or refused cisplatin
• UC or UC with divergent differentiation or histological subtypes
• Evaluated and confirmed for cystectomy
Neoadjuvant | Adjuvant
D+EV N=233: Durvalumab Q3W × 3 cycles; Enfortumab vedotin Q3W × 3 cycles | Durvalumab Q4W × 9 cycles
D+T+EV N=233: Durvalumab Q3W × 3 cycles; Tremelimumab Q3W × 2 cycles; Enfortumab vedotin Q3W × 3 cycles | Durvalumab Q4W × 9 cycles; Tremelimumab Q4W × 1 cycle
Control N=229: No treatment, Straight to RC | Observation/locally approved treatment
• D+EV positive for EFS and OS
• D+T+EV positive for EFS
• Another great result for bladder cancer patients!!
VOLGA: EFS by BICR for Durvalumab+EV vs Control – ITT [thumbnail; numbers too small to read reliably]
VOLGA: OS for Durvalumab+EV vs Control – ITT [thumbnail; numbers too small to read reliably]
Michiel van der Heijden
Invited Discussant LBA2
[Slide 2]
Contribution of adjuvant component in perioperative therapy?
Perioperative trials in MIBC – how much is enough?
Trial | IO agent: all Perioperative | Comparator | Neoadj cytotoxic | Adj cytotoxic | Adjuvant cytotoxic Received in % of randomized | EFS | OS
Chemotherapy backbone
NIAGARA1 | Durvalumab | Neoadj GC | GC ×4 | None | Not applicable | Positive | Positive
KEYNOTE-8662 | Pembrolizumab | Neoadj GC | GC ×4 | None | Not applicable | Negative | Negative
ENERGIZE3 | Nivolumab | Neoadj GC | GC x4 | None | Not applicable | Negative | Negative
Enfortumab vedotin backbone
KN-905/EV-3034 | Pembrolizumab | Surgery alone | EV ×3 | EV ×6 | EV started 59% (100/170) all 6 cycles ≥29%(a) | Positive | Positive
KN-B15/EV-3045 | Pembrolizumab | Neoadj GC | EV ×4 | EV ×5 | EV started 65% (262/405) all 5 cycles ≥32%(b) | Positive | Positive
VOLGA (D+EV)6 | Durvalumab | Surgery ± adj | EV ×3 | None | Not applicable | Positive | Positive
VOLGA (D+T+EV)6 | Durvalumab + tremelimumab | Surgery ± adj | EV ×3 | None | Not applicable | Positive | Not significant (interim)
1Powles, NEJM 2024; 2Bedke, ESMO 2026 (4735O); 3Necchi, ESMO 2026 (4736O); 4Vulsteke, ESMO 2025; NEJM 2026; 5Galsky, ASCO GU,NEJM 2026; 6ESMO 2026 LBA2; (a)Data cutoff Jun 2025; median 6 adjuvant EV cycles among starters (ESMO 2025), so at least half of starters received all 6. (b)Median 5 (range 1-5) adjuvant EV cycles among starters; EV-specific completion not reported. 208/405 (51%) completed the whole adjuvant phase.
GC, gemcitabine-cisplatin; EV, enfortumab vedotin; D, durvalumab; T, tremelimumab; NR, not reported. Lower bounds derived from median cycle numbers. Shaded rows: adjuvant cytotoxic component.
Michiel van der Heijden
Invited Discussant LBA2
[Slide 3]
OS in VOLGA and KN905/EV303
[Top-left inset: reproduced VOLGA OS D+EV vs control KM curve, small text]
D+EV N=233 | Control N=229
Deaths, n (%) 49 (21) | 74 (32); Median OS, months (95% CI) NR (NC–NC) | NR (37.7–NC)
HR (95% CI) 0.58 (0.40–0.83); Stratified log-rank P value 0.0027
87% | 78% (Durvalumab+EV arm); 81% | 69% (Control arm)
Median follow-up: 26 months
[Bottom-left: KEYNOTE-905/EV-303 OS KM curve]
| EV + pembro (N = 170) | Control (N = 174)
Events, n (%) | 38 (22.4) | 68 (39.1)
Median, mo (95% CI) | NR (NR–NR) | 41.7 (31.8–NR)
HR 0.50, 95% CI 0.33–0.74, one-sided P =.0002*
86.3% | 79.7% (EV + pembro); 75.7% | 63.1% (Control)
Overall survival, %; Months 0-60
No. at Risk
EV + pembro | 170 | 159 | 144 | 94 | 68 | 56 | 45 | 28 | 10 | 0 | 0
Control | 174 | 150 | 130 | 75 | 54 | 45 | 30 | 18 | 6 | 0 | 0
OS HRs | HR (95% CI)
KN905/EV303 | 0.50 (0.33–0.74)
VOLGA: 2 arms without adjuvant EV
EV + Durva | 0.58 (0.40–0.83)
EV + Durva + Treme | 0.77 (0.54–1.07)
Hazard ratio (log scale) 0.25 0.5 1 2
← Favours experimental | Favours control →
Michiel van der Heijden
Invited Discussant LBA2
Survival table
Endpoint: OS, KEYNOTE-905/EV-303 (EV + pembro vs control), as reproduced on discussant slide
Arm | N | Median | Median CI
EV + pembro | 170 | NR | NR–NR
Control | 174 | 41.7 | 31.8–NR
HR: 0.50
HR CI: 0.33–0.74
P: one-sided P =.0002
Landmark rates:
12 months: EV + pembro 86.3% | Control 75.7%
24 months: EV + pembro 79.7% | Control 63.1%
1) Slide: Robert Jones invited discussion - Prior hypothesis 2. · 2) Response data: Is the combination hypothesis · 3) Trial design schema: Were studies designed · 4) Slide: Were populations different? EFS outcomes in control
🚨⭐🟠 #ESMO26 GU Oncology Invited Discussion
🎤 Prof. Robert Jones 🇬🇧
@OncoAlert
🔬 Why did NIAGARA succeed while KEYNOTE-866 and ENERGIZE failed to meet their primary efficacy endpoints?
📊 EFS HR:
✅ NIAGARA: 0.68
❌ KEYNOTE-866: 0.88
❌ ENERGIZE: 0.94
🧩 Different populations, baseline risks, eligibility criteria and trial designs complicate comparisons.
⭐ MY POINT OF VIEW
Different outcomes across trials do not establish superiority of PD-L1 over PD-1 blockade.
💡 In curative-intent MIBC, patient selection, endpoint definitions and absolute clinical benefit matter as much as the HR.
Cross-trial comparisons generate hypotheses, not definitive conclusions.
🌍 GU Oncology Community
@gbanna74 @ravikanesvaran @urologysummit
@tompowles1 @PGrivasMDPhD @apolo_andrea @sonpavde @AndreaNecchi @drenriquegrande @DrYukselUrun @yekeduz_emre @cdanicas
@ecancer @UrologyTimes @urotoday @wearemedsir @OpenMedicineHQ @UCSFCancer
#BladderCancer #UrothelialCancer #GUOncology #ADC #ClinicalTrials
[Slide 2]
Is the combination hypothesis incorrect?
pCR outcomes were consistent across trials
KEYNOTE-866 | CA017-078 | NIAGARA
[KEYNOTE-866 bar chart] Estimated difference:b 8.9% (95% CI, 2.5-15.1)* ; Pembro + cis + gem | Placebo + cis + gem
[CA017-078 bar chart] pCR overall (co-primary endpoint) 39.1 | 29.6 ; Overall ITT
[NIAGARA bar chart] Re-analysis Apr 2024 [small text illegible at this resolution]
[Slide 4]
Were populations different?
EFS outcomes were good in control arms of these studies
Primary End Point: EFS by Investigator Assessment, ITT Population [KEYNOTE-866 KM curve - small text illegible]
Event-free survival by treatment arm (co-primary endpoint) [CA017-078 KM curve - small text illegible]
| KEYNOTE-866 | CA017-078 | NIAGARA
T2 (%) | 15 | 76 | 40
N1 (%) | 0.7 | Excluded | 5
ECOG 0 (%) | 76 | - | 78
24 month EFS in control arm (%) | 70.0 | 71.6 | 59.8
🚨 Important new ctDNA data from KEYNOTE-B15 at ESMO 2026!
In cisplatin-eligible MIBC, EV+pembrolizumab achieved:
🔹 82.1% ctDNA clearance during neoadjuvant treatment vs 66.7% with gemcitabine/cisplatin.
🔹 87.0% ctDNA negativity before surgery vs 80.3% with chemotherapy.
🔹 95.2% ctDNA negativity after cystectomy vs 86.5% with chemotherapy.
Strikingly, only 4.8% remained ctDNA-positive after neoadjuvant EV+pembrolizumab and surgery!
We know from IMvigor011 that postoperative ctDNA can identify patients at high risk of recurrence and help guide adjuvant treatment strategies.
But what about patients achieving both pCR and sustained ctDNA negativity?
Do they really need another 5–6 cycles of adjuvant EV, with the potential for cumulative tox/ neuropathy?
Could pCR + ctDNA clearance, followed by longitudinal ctDNA monitoring, define a population suitable for treatment de-escalation?
VOLGA will add another important piece to this puzzle, using only 3 neoadjuvant EV cycles without adjuvant EV.
Of course, neither KEYNOTE-B15 nor VOLGA can establish the necessity of adjuvant EV through cross-trial comparisons.
We urgently need prospective, biomarker-guided de-escalation trials—not simply more treatment for everyone.
@OncoAlert Faculty @DrChoueiri , @tompowles1 , @apolo_andrea , @neerajaiims , @montypal , @Silke_Gillessen , @AOmlin , @brian_rini , @PGrivasMDPhD , @TiansterZhang , @amerseburger , @DrDanielHeng , @HHammersMD , @scocmem , @AndreaNecchi , @AmandaNizamMD , @drenriquegrande , @nataliagandur , @AlbigesL , @cdanicas , @declangmurphy , @seanmmcbride , @shilpaonc , @DrRanaMcKay , @scserendipity1 , @DrYukselUrun , @ravikanesvaran , @BraunMDPhD , @EfstathiouEleni , @mzugman , @crisbergerot @Markuseckstein3
Imvigor011: ctDNA- post RC
INV-assessed DFS
| | No treatment (n=357) |
Events, n (%) | 39 (10.9)
DFS, median (95% CI), mo | NE (NE)
Median 21.8 mo fro[m ... - cropped]
[Kaplan-Meier curve; shaded region 0-12 mo labelled: q6w ctDNA monitoring; dashed markers at 12 and 24 mo]
95.4% (at 12 mo marker)
88.4% (at 24 mo marker)
Y axis: DFS (%)
X axis: Time from cystectomy (mo)
No. at risk
No treatment: 357 357 357 342 337 329 303 289 275 233 185 156 116 102 78 66 46 38 20 11 3 (at 0,2,4,...,40 mo)
8 DFS events were deaths not clearly attributed to disease recurrence
Survival table
Endpoint: INV-assessed DFS (ctDNA-negative post-RC, no treatment cohort)
Arm | N | Median | Median CI
No treatment | 357 | NE | NE
Landmark rates:
12 mo: No treatment 95.4%
24 mo: No treatment 88.4%
1) Biomarker data: Baseline ctDNA status may be · 2) Biomarker data: Does pre-cystectomy ctDNA clearance · 3) Response data: Could triplet therapy become a new · 4) Slide: Can this be delivered in practice? TROPHY-U-01 Cohort 7
🚨⭐🟠 #ESMO26 | GU Oncology — Invited Discussion
KEYNOTE-866 • ENERGIZE • TROPHY-U-01
🎤 Prof. Robert Jones 🇬🇧
@OncoAlert @urologysummit
🔬 Why do apparently similar trials produce different outcomes?
An excellent critical appraisal of perioperative immunotherapy in #MIBC and emerging triplet strategies in metastatic #UrothelialCancer.
📊 1️⃣ PERIOPERATIVE IMMUNOTHERAPY
✅ NIAGARA: EFS HR 0.68
❌ KEYNOTE-866: EFS HR 0.88
❌ ENERGIZE: EFS HR 0.94
But are these trials directly comparable?
📌 Important baseline differences:
• T2 disease: 40% vs 15% vs 76%
• 24-month control-arm EFS: 59.8% vs 70% vs 71.6%
Different populations, endpoints and statistical designs complicate cross-trial interpretation.
🧬 2️⃣ ctDNA: PROGNOSTIC ≠ PREDICTIVE
Pretreatment ctDNA positivity was associated with shorter EFS and OS.
⚠️ In ENERGIZE, baseline ctDNA positivity differed between arms (59% vs 51%), potentially introducing prognostic imbalance.
🔬 ctDNA clearance before cystectomy identified patients with more favorable outcomes.
But can ctDNA clearance identify candidates for bladder preservation?
Not yet! Prospective validation is essential before considering omission of radical cystectomy.
💊 3️⃣ DUAL ADC + IMMUNOTHERAPY: THE NEXT FRONTIER?
TROPHY-U-01 Cohort 7:
✅ ORR 81%
✅ Median PFS 19.3 months
✅ Median DoR 16.7 months
⚠️ Grade ≥3 treatment-related AEs: 52%
⚠️ Treatment-related discontinuation of ≥1 agent: 33%
Promising efficacy, but only 21 patients and no randomized comparator.
⭐ MY POINT OF VIEW CLINICAL PEARLS
🔹 A positive trial does not prove the superiority of one checkpoint inhibitor over another.
🔹 ctDNA may redefine risk stratification, but molecular clearance is not yet a license to omit surgery.
🔹 Dual ADC intensification is scientifically exciting, but added efficacy must justify added toxicity.
💡 The future of GU oncology is not about treating everyone more aggressively. It is about treating the right patient with the right strategy, at the right time.
📌 PRACTICE IMPLICATION
These new results do not independently establish a new standard of care. Individual trials must be interpreted on their own merits.
Access also matters: perioperative gemcitabine/cisplatin + durvalumab remains an important option where EV + pembrolizumab is unavailable.
🌍 GU Oncology Community
@gbanna74 @ravikanesvaran @urologysummit
@tompowles1 @PGrivasMDPhD @apolo_andrea @sonpavde @DrYukselUrun @yekeduz_emre @drenriquegrande @TiansterZhang
@ecancer @UrologyTimes @urotoday @wearemedsir @OpenMedicineHQ @UCSFCancer
#BladderCancer #GUOncology #ctDNA #OncoAlert
[Slide 1]
Baseline ctDNA status may be a valuable prognostic factor in MIBC
EFS and OS by pre-treatment ctDNA status (pooled)a
[KM panel: EFS by pretreatment ctDNA status - ctDNA positive vs ctDNA negative; numbers at risk illegible]
[KM panel: OS by pretreatment ctDNA status; numbers at risk illegible]
NIAGARA Baseline: ctDNA Detection Was Prognostic for EFS
[KM panel; EFS (combined arms); HR/CI text illegible] [ASCO logo]
….. And may have been an unstratified source of inbalance in CA017-078
| Gem-cis | Gem-cis nivolumab
ctDNA positive at baseline | 51% | 59%
Survival table
Endpoint: EFS and OS by pre-treatment ctDNA status (pooled); NIAGARA EFS by baseline ctDNA
ctDNA positive
ctDNA negative
[Slide 2]
Does pre-cystectomy ctDNA clearance identify a group of patients for bladder preservation?
EFS by ctDNA clearance status
[KM curve: Survival probability vs Months 0-80; dashed vertical line with circled point around month ~24]
Legend: C1D1 to C4D1 cleared; C1D1 to C4D1 not cleared
No. at risk
C1D1 to C4D1 cleared: [low-res; approx. 152 129 118 86 86 57 21 1 0 - low confidence]
C1D1 to C4D1 not cleared: [low-res; approx. 46 21 14 9 9 4 4 1 0 - low confidence]
Survival table
Endpoint: EFS by ctDNA clearance status (C1D1 to C4D1)
C1D1 to C4D1 cleared
C1D1 to C4D1 not cleared
[Slide 3]
Could triplet therapy become a new standard in first line mUC?
Drug class | Exemplar | ORR | Duration of response | DoR > 12 months
Chemotherapy | Platinum + gemcitabine (EV-302) | 44% | 7 months | 35%
Immune checkpoint inhibitor | Pembrolizumab (KN-052) | 29% | 30 months | 67%
ADC + ICPI | EV + pembrolizumab (EV-302) | 68% | 23 months | 68%
Vuky et al. Journal of Clinical Oncology Volume 38, Number 23 August 2020
Powles et al. Volume 36, Issue 10 – 2025
McGregor et al. ESMO 2024
[Slide 4]
Can this be delivered in practice?
Safety Summary
Participants, n (%) | Cohort 7 (n = 21)
Median treatment duration (range), months
SG | 8.0 (0-18)
EV | 7.5 (0-16)
ZIM | 9.7 (0-20)
Any TEAE/grade ≥ 3 TEAE | 21 (100)/14 (67)
Any TRAE/grade ≥ 3 TRAE | 21 (100)/11 (52) [circled]
Participants, n (%) | Cohort 7 (n = 21)
TRAEs leading to any drug discontinuation | 7 (33) [circled]
Discontinuation of SG | 4 (19)
Discontinuation of EV | 6 (29)
Discontinuation of ZIM | 1 (5)
TEAE leading to death | 0
DLTa | 1/12 (8)
Deborah Mukherji@dmukherji
Slide: Poster 1217P : Novel candidate genes in pathogenesis and cisplatin resistance of testicular germ cell
Best Poster Award – Testicular Germ Cell Tumours at #ESMO26
Identifying novel genes involved in tumour development and cisplatin resistance, paving the way for new therapeutic strategies
Congratulations to the research team!
@OncoAlert @UrsulaVogl @AzadOncology https://t.co/ZkDbQO5YBS
[Photo of presenter (badge: Laura Matouskova) beside poster; section signs: GERM CELL (TESTICULAR) CANCER AND PENILE CANCER; board 1217P; BEST POSTER rosette]
#6234 Novel candidate genes implicated in the pathogenesis and cisplatin resistance of testicular germ cell tumors
[logos: EuTTN, CLIP, FN Motol, Thomayer University Hospital, NICR, TTIP]
[M]atouskova L1,2, Bakardjieva-Mihaylova V1, Zwyrtkova M1, Soffrova K1, Krivonoskova S2, Winkowska L1, Stuchly J1, Skvarova Kramarzova K1, Boublikova L1,2
1 Dept. of Pediatric Hematology and Oncology, Second Faculty of Medicine, Charles University and University Hospital in Motol and Homolka, Prague, Czech Republic; 2 Dept. of Oncology, 1st Faculty of Medicine, Charles University and Thomayer University Hospital, Prague, Czech Republic
CONCLUSION
- WES revealed distinct somatic alteration profiles between cisplatin-naive (primary tumors) and cisplatin-exposed (metastatic) TGCT samples
- Significant proportion of somatic variants present in cfDNA at diagnosis was detectable in metastases and not in primary tumors, highlighting the potential of liquid biopsy for early identification of metastasis-associated molecular alterations.
INTRODUCTION
[...]h testicular germ cell tumors (TGCTs) respond well to cisplatin (cDDP)-based chemotherapy. [...] develop cDDP resistance, resulting in treatment failure with no effective alternative treatments [...] molecular mechanisms underlying cDDP resistance and TGCT pathogenesis remain incompletely [...] this issue, we performed whole-exome sequencing (WES) of primary tumors, metastases and [...] samples from patients with advanced TGCTs to identify genetic alterations that may contribute [...] and therapy resistance.
MATERIALS AND METHODS
Sample characteristics: Primary tumors 25; Metastases 7; cfDNA from diagnosis 6; gDNA (background control) 25
Whole exome sequencing
- Library preparation: SureSelect XT HS Human All Exon + SureSelect XT HS Reagent kits (Agilent)
- Sequencing: Illumina platform (NextSeq500, 2000)
- Sequencing depth = 50 million read pairs/sample
- Target mean coverage = 100x
Variant filtering
- Minimum tumor sequencing depth: >=15x
- Minimum alternative allele depth: >=10x
- Variant allele frequency (VAF): >=5%
- Exclusion of variants detected in matched germline
- Exclusion of non protein-altering variants
- Selection of genes with qualifying alterations in >=3 of 25 patients for primary tumor analysis and >=2 of 7 patients for metastasis analysis
- Evaluation of candidate genes based on their biological function, recurrence of detected variants across patient samples and their predicted functional consequences
Figure panels: Somatic alterations in primary TGCTs; Somatic alterations in metastatic TGCTs; Figure 1: Oncoplot of top 20 altered genes shared with at least 3 patiens (primary tumors, left) and at least 2 patiens (metastases, right); Somatic variant distribution across primary tumors and metastases; Overlap of diagnostic cfDNA variants with primary tumors and metastases; Recurrent gene variants present in all sample types in more than one patient [gene-level figure text illegible]
laura.matouskova@lfmotol.cuni.cz
European Testicular Tumor Network [QR code]
[Slide 1]
4741RO
Exploratory Analysis of Molecular Subtypes and Association With Treatment Outcomes in Patients With Muscle-Invasive Bladder Cancer From NIAGARA
Matthew D. Galsky,1 Michiel S. van der Heijden,2 Ricky Joshi,3 James W. F. Catto,4 Joshua J. Meeks,5 Hiroyuki Nishiyama,6 Hikmat Al-Ahmadie,7 Toan Quang Vu,8 Lorenzo Antonuzzo,9 Tae Hwan Kim,10 Hiroaki Kikukawa,11 Vagif Atduev,12 Bernhard Eigl,13 Kazuo Nishimura,14 Yousef Zakharia,15 Jae Lyun Lee,16 Svetlana Ho,17 Huiling Xiong,18 Agrin Moeini,3 Thomas Powles19
1Icahn School of Medicine at Mount Sinai, New York, NY, USA; 2Netherlands Cancer Institute, Amsterdam, Netherlands; 3AstraZeneca, Barcelona, Spain; 4University of Sheffield, Sheffield, UK; 5Northwestern University, Feinberg School of Medicine, Chicago, IL, USA; 6University of Tsukuba, Tsukuba, Japan; 7Memorial Sloan Kettering Cancer Center, New York, NY, USA; 8Vietnam National Cancer Hospital, Hanoi, Vietnam; 9SODC Oncologia Medica-Azienda Ospedaliera-Universitaria Careggi, Florence, Italy; 10Kyungpook National University School of Medicine, Kyungpook National University Chilgok Hospital, Daegu, Republic of Korea; 11National Hospital Organization Kumamoto Medical Center, Kumamoto, Japan; 12Volga District Medical Center, Federal Medical-Biological Agency, Nizhny Novgorod, Russia; 13British Columbia Cancer Agency, Vancouver, BC, Canada; 14Osaka International Cancer Institute, Osaka, Japan; 15University of Iowa Hospitals and Clinics, Holden Comprehensive Cancer Center, Iowa City, IA, USA; 16Asan Medical Center, University of Ulsan College of Medicine, Seoul, Republic of Korea; 17AstraZeneca, Gaithersburg, MD, USA; 18AstraZeneca, Waltham, MA, USA; 19Barts Cancer Institute ECMC/BRC, Queen Mary University of London, Barts Health NHS Trust, London, UK
[Slide 3]
NIAGARA: Increased T Effector Infiltration and IFNγ Signalling are Associated with Enhanced Perioperative Durvalumab + NAC Benefit
MIBC transcriptional subtypes (basal-squamous & luminal-infiltrated) are enriched for T effector infiltration and IFNγ signalling
Association of gene signature reflective of chemotherapy or immune response with EFS
ITT
BEP
Gene signature enrichment: Platinum sensitivity | Gemcitabine sensitivity | T effector infiltration | IFNγ signalling | Stromal TGF-β signalling
High Sig score | Low Sig score
EFS HR (log scale) 0.25 0.5 1 2
Favours D arm | Favours C arm
Panels: T effector infiltration | IFNγ signalling | Stromal TGF-β signalling (immunosuppressive)
High Sig score / Low Sig score
Basal-squamous | Luminal | Luminal-infiltrated | Luminal papillary | Neuronal
Left graph depicts EFS HR (square) and 95% confidence intervals (lines), and was assessed by the Cox proportional hazards model, with treatment as the only covariate and ties handled by the Efron approach.
BEP, biomarker-evaluable population; C, comparator; D, durvalumab; EFS, event-free survival; ITT, intention-to-treat population; MIBC, muscle-invasive bladder cancer.
[Slide 4]
NIAGARA: Increased T Effector Infiltration and IFNγ Signalling are Associated with Enhanced Perioperative Durvalumab + NAC Benefit
MIBC transcriptional subtypes (basal-squamous & luminal-infiltrated), enriched for T effector infiltration and IFNγ signalling, showed up to 16% higher pCR rates in the D arm vs the C arm
MIBC subtype | Gemcitabine + platinum sensitivity | Stromal TGF-β signalling | T effector infiltration | IFNγ signalling | pCR rates (D arm vs C arm)
Basal-squamous | High | High | High | High | 50% vs 34% (16%)
Luminal | High | Low | Low | Low | 44% vs 44%
Luminal-infiltrated | Low | High | High | High | 36% vs 25% (11%)
Luminal papillary | Low | Low | Low | Low | 38% vs 37%
Neuronal | High | Mid | Low | Low | 25% vs 47%
C, comparator; D, durvalumab; MIBC, muscle-invasive bladder cancer; pCR, pathological complete response.
NIAGARA: EFS Benefit in MIBC Transcriptional Subtypes
Addition of perioperative durvalumab to NAC appeared to improve EFS across most transcriptional subtypes, including basal-squamous
Subtype | Patients with UC with DDHS | EFS rate at 24 months – C arm | Number of patients D arm | C arm | HR (95% CI)
BEP n=402 | 15% | 66.7% | 207 | 195 | 0.65 (0.46–0.90)
Basal-squamous (23%) n=91 | 26% | 67.8% | 47 | 44 | 0.47 (0.20–1.11)
Luminal (34%) n=139 | 10% | 65.9% | 70 | 69 | 0.52 (0.28–0.94)
Luminal-infiltrated (19%) n=77 | 15% | 67.3% | 47 | 30 | 0.67 (0.35–1.31)
Luminal papillary (17%) n=68 | 10% | 78.3% | 34 | 34 | 1.35 (0.64–2.87)
Neuronal (7%) n=27 | 11% | 44.4% | 9 | 18 | Not calculated^a
EFS HR (log scale) 0.25 0.5 0.75 1.0 1.5 2.0 3.0
Favours D arm | Favours C arm
P value P<0.001
Graph depicts EFS HR (square) and 95% confidence intervals (lines), and was assessed by the Cox proportional hazards model, with treatment as the only covariate and ties handled by the Efron approach. A significant p-value provides evidence against the null hypothesis that observations are equally likely to fall into each category, suggesting the category probabilities are not all equal, p-value obtained from a Chi-squared test. ^aNot calculated as there are fewer than 20 patients per arm. BEP, biomarker-evaluable population; C, comparator; CI, confidence interval; D, durvalumab; DDHS, divergent differentiation or histological subtype; EFS, event-free survival; HR, hazard ratio; MIBC, muscle-invasive bladder cancer; NAC, neoadjuvant chemotherapy; UC, urothelial carcinoma.
Response data: Is the combination hypothesis incorrect? pCR outcomes consistent across
Durvalumab plus cisplatin showed positive results, while the pembrolizumab and nivolumab trials were negative. I’m not sure how to make sense of this puzzle. #ESMO2026 @tompowles1 @ProfSyedHussain @PGrivasMDPhD @PGrivasMDPhD @montypal @DrYukselUrun https://t.co/7AXG6J6zOj
Slide: Discussion slide: chemo-IO and negative vs NIAGARA, EFS/OS forest
Great slide at #ESMO26!
Similar pCR improvements (~9–10%) across NIAGARA, KEYNOTE-866 and ENERGIZE, but only NIAGARA demonstrated significant EFS and OS benefits.
A reminder that improvements in pCR do not necessarily translate into survival benefits.
#BladderCancer https://t.co/SBPEgFkr6q
1) Slide: Discussant: Pembrolizumab Adds to EV Perioperatively · 2) Slide: Discussant: PD-1 Blockade Shows Similar Benefit Across · 3) Biomarker data: KEYNOTE-B15 exploratory ctDNA analysis
Invited Discussant: Perioperative EV + Pembrolizumab in #MIBC – KEYNOTE-905 and KEYNOTE-B15 ctDNA Analyses. Presented by @MTeoMD @MSKCancerCenter. #ESMO26 written coverage by @chavarriagaj @PSH_Urology > https://t.co/Jpmv636OLh #BladderCancer #Immunotherapy @myESMO https://t.co/9DpRjkVuwi
1) Trial design schema: Discussant (Michiel van der Heijden) talk · 2) Kaplan-Meier survival data: Discussant talk: KN905/EV303 · 3) Kaplan-Meier survival data: Discussant talk: design, EFS and OS
Is Less Enough and More Too Much? Implications of #VOLGA for the Peri-Operative Therapeutic Landscape in MIBC. Presented by @MichvdHeijden @NKI_nl. #ESMO26 written coverage by @chavarriagaj @PSH_Urology > https://t.co/BGiEPXpeva #BladderCancer #MIBC #Immunotherapy @myESMO https://t.co/MSeYISm9wm
[Slide 1]
Cisplatin-ineligible MIBC: an unmet need was met
Primary Endpoint: EFSa by BICR
ITT Population
| EV + pembro (N = 170) | Control (N = 174)
Events, n (%) | 48 (28.2) | 95 (54.6)
Median, mo (95% CI) | NR (37.3–NR) | 15.7 (10.3–20.5)
HR 0.40, 95% CI 0.28–0.57, one-sided P <.0001*
12 months: 77.8% vs 55.1%; 24 months: 74.7% vs 39.4%
• 29/174 pts (16.7%) in the control arm received adjuvant nivolumab as of data cutoff per local guidelines/prescribing information
No. at Risk
EV + pembro 170 140 116 73 56 42 35 16 3 0 0
Control 174 116 84 48 33 22 14 9 1 0 0
KEYNOTE-905/EV-303
EVP vs resection alone
MIBC, n=344
Neoadjuvant: 3 cycles EVP
Adjuvant: 6 cycles (total 9)
Vulsteke et al, ESMO&NEJM 2025
Survival table
Endpoint: EFS by BICR (ITT)
Arm | N | Median | Median CI
EV + pembro | 170 | NR | 37.3–NR
Control (resection alone) | 174 | 15.7 | 10.3–20.5
HR: 0.40
HR CI: 0.28–0.57
P: one-sided P<.0001
Landmark rates:
12 months: EV + pembro 77.8% | Control 55.1%
24 months: EV + pembro 74.7% | Control 39.4%
[Slide 2]
KN905/EV303 & EV304/KN-B15: a paradigm shift for patients with neoadjuvant MIBC
Primary Endpoint: EFSa by BICR ITT Population [KEYNOTE-905 KM, same as prior slide: HR 0.40, 95% CI 0.28–0.57, one-sided P <.0001; 12-mo 77.8% vs 55.1%; 24-mo 74.7% vs 39.4%]
KEYNOTE-905/EV-303 EVP vs resection alone MIBC, n=344
Neoadjuvant: 3 cycles EVP
Adjuvant: 6 cycles (total 9)
Vulsteke et al, ESMO&NEJM 2025
pCR: Estimated differencea 48.3% (95% CI 39.5–56.5) one-sided P <.000001* (EV + pembro vs Control)
Primary Endpoint: EFS by BICR ITT Population
EV + pembro N=405 | Cis + gem N=403
Events, n (%) | [illegible] | [illegible]
Median, mo (95% CI) | [illegible] | [illegible]
HR 0.53, 95% CI 0.41–0.70, 1-sided P <.0001*
12 months: 86.0% vs 75.4%; 24 months: 79.4% vs 66.2%
No. at Risk
EV + pembro 405 351 317 303 257 154 100 63 23 0
Cis + gem 403 350 286 259 216 131 70 45 16 0
KEYNOTE-B15/EV-304
EVP vs cisplatin/gemcitabine
MIBC, n= 808
Neoadjuvant: 4 cycles EVP
Adjuvant: 5 cycles (total 9)
pCR: Estimated differencea 23.4% (95% CI 16.7–29.8) 1-sided P <.0001* (EV + pembro vs Cis + gem)
Galsky et al, ASCO-GU&NEJM 2026
Survival table
Endpoint: EFS by BICR (ITT) — KEYNOTE-B15/EV-304 panel
EV + pembro | 405
Cis + gem | 403
HR: 0.53
HR CI: 0.41–0.70
P: 1-sided P<.0001
Landmark rates:
12 months: EV + pembro 86.0% | Cis + gem 75.4%
24 months: EV + pembro 79.4% | Cis + gem 66.2%
[Slide 3]
Patients
• Adults aged ≥18 years
• MIBC (cT2-T4aN0/1M0 or cT1N1M0) by local assessment
• Ineligible for or refused cisplatin
• UC or UC with divergent differentiation or histological subtypes
• Evaluated and confirmed for cystectomy
R (1:1:1) N=695
D+EV N=233: Neoadjuvant Durvalumab Q3W × 3 cycles + Enfortumab vedotin Q3W × 3 cycles → RC → Adjuvant Durvalumab Q4W × 9 cycles
D+T+EV N=233: Durvalumab Q3W × 3 cycles + Tremelimumab Q3W × 2 cycles + Enfortumab vedotin Q3W × 3 cycles → RC → Durvalumab Q4W × 9 cycles + Tremelimumab Q4W × 1 cycle
Control N=229: No treatment, Straight to RC → Observation/locally approved treatment
• D+EV positive for EFS and OS
• D+T+EV positive for EFS
• Another great result for bladder cancer patients!!
VOLGA: EFS by BICR for Durvalumab+EV vs Control – ITT
D+EV N=233 | Control N=229
Events, n (%) | [illegible] | [illegible]
Median EFS, months (95% CI) | NR ([illegible]) | [illegible]
HR (95% CI) | 0.51 (0.38–0.67)
Stratified log-rank P value | <0.0001
12 months: 73% vs 50%; 24 months: 64% vs 45%
Median follow-up: 23 months
VOLGA: OS for Durvalumab+EV vs Control – ITT
D+EV N=233 | Control N=229
Deaths, n (%) | [illegible] | [illegible]
Median OS | [illegible] | [illegible]
HR (95% CI) | 0.58 (0.40–0.83)
Stratified log-rank P value | 0.0027
12 months: 87% vs 81%; 24 months: 78% vs 69%
Median follow-up: [illegible] months
No. of patients at risk [illegible]
Survival table
Endpoint: VOLGA EFS by BICR and OS, D+EV vs control (ITT)
Durvalumab + EV | 233
Control | 229
HR: EFS 0.51; OS 0.58
HR CI: EFS 0.38–0.67; OS 0.40–0.83
P: EFS <0.0001; OS 0.0027 (stratified log-rank)
Landmark rates:
12 months (EFS): D+EV 73% | Control 50%
24 months (EFS): D+EV 64% | Control 45%
12 months (OS): D+EV 87% | Control 81%
24 months (OS): D+EV 78% | Control 69%
1) Slide: Cross-trial comparison of perioperative PD-(L)1 trials in MIBC: NIAGARA · 2) Kaplan-Meier survival data: EV-pembrolizumab vs cisplatin-gemcitabine · 3) Kaplan-Meier survival data: Event-free survival by pCR status · 4) Slide: 2-year EFS, pCR and downstaging with cystectomy alone vs pembrolizumab vs EV
Optimal Induction Treatment in Non-Metastatic #BladderCancer. Presented by @niklas_kluemper, #ESMO26 written coverage by @zklaassen_md > https://t.co/GbW4pbnZAw #MIBC #GUOnc @myESMO https://t.co/GO52iOozbq
1) Safety data: Poster 1047P: Patient-Reported toxicity precedes clinician-graded DLTs · 2) Slide: Poster 4465P: Prognostic value of Decipher GC and NE signatures in real-world de novo M1 · 3) Slide: Poster 3274P: Predicting informative liquid biopsy in advanced thoracic malignancies · 4) Trial design schema: Poster: Role of MDT in omHSPC - early toxicity and efficacy data
🔹 Gustave Roussy at #ESMO26 🔹
Today's poster sessions:
• Dr Kaissa Ouali
• Dr Alice Bernard-Tessier
• Dr Marianna Peroni
• Dr Youssef Ghannam
@myESMO #ESMO https://t.co/kJvRWQd2vA
[Slide 1]
1047P
Patient-Reported toxicity precedes clinician-graded DLTs and tolerability events in Phase I Trials: A prospective DITEP cohort
K. Ouali^1, A. Yazigi^2, S. Jetley^2, A. Hollebecque^1, Y. Loriot^1, M. Sakkal^1, A. Gazzah^1, J.-M. Michot^1, R. Bahleda^1, T. Hueso^1, K. Amrane^1, A. Patrikidou^1, S. Postel-Vinay^1, F.-X. Danlos^1, V. Ribrag^1, A. Marabelle^1, A. Italiano^1, J. Ribeiro^1, C. Ferte^2, C. Massard^1
^1Drug Development Department, Institut Gustave Roussy, Villejuif, France, ^2Resilience Care, Resilience, Paris, France
BACKGROUND [partially obscured by presenter]
RESULTS
Among 608 pts included in phase 1 trials at DITEP between September 2024 and November 2025, 431 with evaluable PRO-CTCAE data were included in the analysis. Median number of completed questionnaire was 11 [95% CI, 10-30].
Population, n (%): n 431; Age, median [Q1,Q3] 62.0 [54.0,69.0]; Gender: Female 242 (56.1), Male 189 (43.9); Cancer stage: Localized 10 (2.3), Locally advanced 29 (6.7), Metastatic 392 (90); [Type] of drug: Targeted therapy (TT) 182 (42.2), Immunotherapy (IO) 156 (36.2), ADC 68 (15.8), IO+ Chemo 10 (2.3), IT IO 6 (1.4), IO + RT 3 (0.7), IO + TT 3 (0.7), IO + ADC 1 (0.2), Radioligand 1 (0.2), TT + RT 1 (0.2)
Figure 1: Percentage of pts experiencing PRO-CTCAE G>=3 events, by symptom [bar chart; values largely illegible]
Figure 2: Frequency of PRO-CTCAE G>=3 events by symptom [stacked bar chart; values largely illegible]
Table 2: Time to first DLT, tolerability event and PRO-CTCAE G>=3 event (Kaplan-Meier)
Event | Median Time-to-event | Event-free Probability at Day 30
DLT | NR | 0.96
Tolerability | NR | 0.92
PRO-CTCAE G>=3 | 23.0 days, 95%CI [17.0 - 35.0] | 0.47
Figure 3: Kaplan-Meier estimates of time to first PRO-CTCAE G>=3 event, DLT and TE
- DLT rate was 4.6% (n=20) with a median time to DLT of 14 days [95% CI, 7-21] among pts with a DLT. 12.5% pts had a dose interruption, 8.4% a dose reduction and 6.5% discontinued treatment due to toxicity making a total of 90 tolerability events (20.9%). Median time to tolerability event was 42 days [95% CI, 31-63] among pts with a TE.
- Grade >=3 PRO-CTCAE events occurred earlier, preceding tolerability events by a median of 11 days [95% CI, 8-21] and DLTs by 2.5 days [95% CI, -3 to 12].
- Incorporating grade >=3 PRO-CTCAE data improved prediction of safety/tolerability events (AUROC 0.65 vs. 0.61). The PRO-CTCAE G>=3 flag was an independent predictor beyond clinical variables (adjusted OR 5.9 [95% CI, 2.2-15.5], p<0.001).
Figure 4: Mean cross-validated AUROC (±1 SD) of the model including the PRO-CTCAE G>=3 flag (ablative analysis)
[CONC]LUSION: [PRO]-CTCAE events preceded tolerability events and added independent predictive information beyond clinical variables (adjusted OR 5.9). Continuous PRO-CTCAE monitoring [...] both earlier and complementary toxicity signals to refine dose-escalation decisions and RP2D identification.
Contact: kaissa.ouali@gustaveroussy.fr
[Presenter Kaissa Ouali standing beside poster]
[Slide 2]
4465P
4465P - Prognostic value of the Decipher prostate genomic classifier (GC) and neuroendocrine (NE) gene expression signatures in real-world de novo metastatic (M1) prostate cancer
Alice Bernard-Tessier^1, E. Walker^2, J. A. Proudfoot^2, Qi Joselove Xu^2, Yang Liu^2, Elai Davicioni^2, Himisha Beltran^3
^1Gustave Roussy, Departement de medecine oncologique, Villejuif, France. ^2Veracyte Inc, San Diego, USA. ^3Department of Medical Oncology, Dana-Farber Cancer Institute, Boston, MA, USA
INTRODUCTION
The prognostic impact of molecular features in de novo metastatic (M1) hormone-sensitive prostate cancer (mHSPC) remains largely underexplored in real-world settings.
The Decipher Genomic Classifier (GC) predicts benefit from docetaxel (Grist et al., Cell 2025; Sweeney et al., ASCO 2026). In addition, PEACE-1 data showed that approximately 25% of de novo mHSPC presented neuroendocrine markers on IHC (Pobel et al., ESMO 2024), suggesting that transcriptomic features beyond GC may carry prognostic information.
Objective: to evaluate the prognostic value of GC and of validated gene expression signatures for overall survival in a large real-world cohort of de novo mHSPC, independently of clinical variables.
METHODS
Population. US patients with a diagnosis of prostate cancer (PCa) and a GC test performed on the diagnostic biopsy, with metastases diagnosed within 90 days before or after the PCa diagnosis (de novo M1).
Data. Clinical outcomes were obtained by linkage to electronic health record data. Transcriptome-wide gene expression profiling was performed in a clinical laboratory (Veracyte, San Diego, CA).
Signatures. GC and validated signatures: AR activity, small cell/NE-like, PTEN, TP53, PAM50, PSC; MKI67 and individual AR-dependent and NE-related genes.
Statistics. Associations with overall survival (OS) from diagnostic biopsy were assessed using Cox proportional hazards models, with GC and signatures dichotomized using published thresholds, MKI67 and individual genes as top 20% vs bottom 80%. Multivariable analyses (MVA) were adjusted for age, T stage, Gleason grade group and PSA. OS was estimated using the Kaplan-Meier method and compared with the log-rank test.
RESULTS
1 2,303 de novo mHSPC patients: aggressive disease, most with high-risk GC
209,649 pts with PCa and GC testing -> 2,303 pts (1.1%) with de novo M1 disease (M1 within 90 days of PCa diagnosis)
Most patients had aggressive disease: 55% had Gleason grade group 4-5 and 76% had high-risk GC, including 55% very high risk (score >0.85). A small cell NE-like transcriptomic signature was found in 6% of tumors.
2 Higher GC is independently associated with worse OS
On MVA, higher GC was independently associated with worse OS (HR 1.37 per 0.1-unit increase; p<0.001). Very high vs lower GC risk conferred a 3-fold increased risk of death (HR 3.31; p<0.001).
3 GC and TP53 combine to identify the highest-risk patients
Combined GC risk (very high vs lower) and TP53 stratification demonstrated incremental risk, with 5-year OS rates of 93.3% for lower GC + wildtype, 93.3% for lower GC + mutant, 67.6% for very high GC + wildtype, and 58.7% for very high GC + mutant.
4 NE-like, TP53, PTEN, MKI67 and low AR activity signatures predict worse OS
On MVA, the small cell NE-like signature (HR 2.57; 95% CI 1.56-4.24), the TP53 mutant signature (HR 2.31; 1.47-3.63), the PTEN inactivity signature (HR 1.58; 1.06-2.36), lower AR activity (HR 2.37; 1.61-3.48) and higher MKI67 expression (top 20%; HR 1.82, 1.24-2.67) were associated with worse OS. No deaths among the 30 patients (1%) classified the NE classified according to Beltran [partially obscured]
5 Neuroendocrine marker expression is associated with worse OS
On MVA, high KLK2 expression was associated with better OS (HR 0.46; 95% CI 0.25-0.87). Among NE-related genes, high DLL3 (HR 1.54; 1.03-2.30), CEACAM5 (HR 1.63; 1.08-2.47) and EZH2 (HR 1.55; 1.04-2.32) expression were associated with worse OS. Chromogranin A, SEZ6, INSM1 and synaptophysin showed similar trends (HR 1.12-1.37) without reaching significance.
[Table 1, Fig. 1-3 and forest plot: small text largely illegible]
[CONC]LUSION [partially obscured by presenter]
Disclosures. Study funded by Veracyte. Genomic data and assay provided by Veracyte (San Diego, CA).
[Presenter Alice Bernard-Tessier standing beside poster]
[Slide 3]
3274P
Predicting informative liquid biopsy in [advan]ced thoracic malignancies to optimize ctDNA-only molecular profiling at diagnosis
Marianna Peroni^1, Daniela Miliziano^1, Francesca Colamartini^1, Noemie Simon-Tillaux^2, Olfa Trabelsi-Grati^3, Maxime Borgeaud^1, Giulia La Cava^1, Lodovica Zullo^1, Arianna Marinello^1, Adrien Rousseau^1, Pernelle Lavaud^1, Pamela Abdayem^1, Maxime Frelaut^1, Jordi Remon^1, Fabrice Barlesi^4, Benjamin Besse^1, Antoine Italiano^5, David Planchard^1, Etienne Rouleau^3, Mihaela Aldea^4 [affiliations small]
BACKGROUND
In advanced thoracic malignancies, liquid biopsy (LB) accelerates molecular diagnosis and treatment initiation. Since its sensitivity remains variable and concurrent tissue NGS (tNGS) raises cost-efficiency concerns, identifying clinical predictors of LB positivity is essential to define when LB alone may suffice.
Can we predict, using baseline clinical features available at first visit, which patients are likely to have an informative baseline LB?
METHODS
We retrospectively included patients with advanced thoracic malignancies and available baseline LB at Gustave Roussy (2021-2026). LB samples were analysed through FoundationOne Liquid CDx. Baseline clinical features (age, sex, smoking habit (pack-years), stage at diagnosis, metastatic burden/sites, ECOG PS) were analysed through multivariable logistic regression. The predictive model was developed using clinically plausible variables and internally validated using bootstrap optimism correction.
RESULTS
516 baseline available LBs; 71 (14%) non-informative -> Multivariable logistic regression -> Predictive model development (variables: sex, pack-years, PS, stage at diagnosis, liver and bone metastases) -> Discrimination and internal validation (complete-case analysis on 417 patients) -> Potential clinical impact (using a >=90% predicted probability threshold)
INDEPENDENT PREDICTORS [forest plot, Multivariable logistic regression; odds ratio values small/partly illegible]: Age 1.00 (0.97-1.03), p = 0.927; Female 0.48 (0.25-0.94), p = 0.031; Pack-years 1.03 (1.01-1.05), p = 0.001; PS 2-4 2.46 (0.96-6.18), p = 0.055; Stage IV at diagnosis 1.48 (0.67-3.29), p = 0.333; N. of metastatic sites 1.02 (0.75-1.39), p = 0.890; Liver metastases 3.12 (0.97-10.04), p = 0.057; Brain metastases 1.45 (0.70-2.98), p = 0.320; Bone metastases 2.46 (1.14-5.33), p = 0.022
PREDICTIVE MODEL DISCRIMINATION [ROC curve]: Apparent AUC = 0.763 (95% CI 0.700-0.825); Optimism-corrected AUC = 0.736 (95% CI 0.675-0.800)
PREDICTIVE MODEL CALIBRATION [calibration plot]: Apparent; Optimism-corrected = 0.87; O/E = 1.00
CLINICAL IMPACT
417 patients included
Predicted probability >=90% n = 216 (52%) -> Liquid biopsy first -> 11/216 (5.1%) Non-informative LB (missing one KRAS non-G12C mut and one ROS1 fusion); 205/216 (PPV 94.9%) True informative LB -> 49% Potential reduction in concurrent tissue NGS (205/417)
Predicted probability <90% n = 201 (48%) -> Liquid biopsy + tissue NGS
CONCLUSION
A simple prediction model using clinical features available at first oncology visit may identify pts with high probability of informative LB, potentially sparing more than 40% of concurrent tNGS and optimizing resources.
marianna.peroni@gustaveroussy.fr I have no COI to declare
[Presenter Marianna Peroni standing beside poster]
[Slide 4]
[Poster number partially obscured]
Role of metastasis directed therapy (MDT) in hormone sensitive [oligometa]static prostate cancer (omHSPC): early toxicity and efficacy data from the phase III randomized PEACE 6 Oligo-PRESTO trial
Y. Ghannam, C. Bargain, S. Supiot, J. Chamois, P. Ronchin, G. Loos, P. Sargos, J. Khalifa, L. Cartier, G. Crehange, G. Gravis, J.-C. Trone, P.E. Brachet, I. Latorzeff, D. Pasquier, L. Lefebvre, G. Bera, V. Schartner, S. Foulon, P. Blanchard [affiliations small/illegible]
[OBJECTIVE and participant flow panels partially obscured by presenter; visible: ARM B SOC* n = 283]
MDT MODALITY: SBRT data on 400 lesions (245 patients): 71,5% in 3 fractions / 27,5% in 5 fractions
STUDY POPULATION
Baseline characteristics were well balanced between randomized arms.
Characteristic | Overall N=565 | Arm A (SOC+MDT) N=282 | Arm B (SOC) N=283
Age, years - median (IQR) | 71 (65-75) | 71 (65-75) | 72 (66-76)
ECOG performance status 0 | 486 (86.0%) | 241 (85.5%) | 245 (86.6%)
Number of metastases: 1-2 | 421 (74.5%) | 211 (74.8%) | 210 (74.2%)
3-5 | 144 (25.5%) | 71 (25.2%) | 73 (25.8%)
Disease presentation: De novo | 289 (51.2%) | 145 (51.4%) | 144 (50.9%)
Recurrent | 276 (48.8%) | 137 (48.6%) | 139 (49.1%)
Metastatic sites: Bone | 558 (98.8%) | 279 (98.9%) | 279 (98.6%)
Lymph nodes | 209 (37.0%) | 104 (36.9%) | 105 (37.1%)
Staging imaging: Choline PET/CT | 354 (62.7%) | 178 (63.1%) | 176 (62.2%)
PSMA PET/CT | 211 (37.3%) | 104 (36.9%) | 107 (37.8%)
Additional systemic treatment: None | 85 (15.0%) | 42 (14.9%) | 43 (15.2%)
Docetaxel | 2 (0.4%) | 1 (0.4%) | 1 (0.4%)
New-generation hormonal therapy | 478 (84.6%) | 239 (84.8%) | 239 (84.5%)
Baseline PSA, ng/mL - median (IQR) | 6 (1-22) | 7 (2-22) | 6 (1-22)
Data are n (%) unless otherwise stated. IQR, interquartile range.
ACUTE SAFETY WITHIN 6 MONTHS
Most frequent acute AEs related to hormonal therapy: hot flush, asthenia, pollakiuria, fatigue and diarrhoea. Most were grade 1-2, with no apparent excess following SBRT.
Acute AEs within 6 months by randomized arm, n (%)
Maximum grade | ARM A (SOC + MDT) n=279 | ARM B (SOC) n=282
Any acute AE | 253 (90.7) | 277 (98.2)
Grade 1 | 92 (33.0) | 108 (38.3)
Grade 2 | 115 (41.2) | 126 (44.7)
Grade 3 | 39 (14.0) | 37 (13.1)
Grade 4 | 3 (1.1) | 4 (1.4)
Grade 5 | 4 (1.4) | 2 (0.7)
Modified ITT: treated patients by randomized arm; maximum grade per patient.
Quality of life analysis showed no impact of MDT on EPIC subdomains (urinary, bowel, sexual, hormonal), nor on pain scores (BPI, below)
Brief Pain Inventory Scores in patients with bone pain at baseline [two line charts: Brief Pain interference score; Brief Pain severity score; SOC + MDT vs SOC; Baseline, Week 6, Month 3, Month 6; numbers of patients at visit small]
EARLY PSA ASSESSMENT
At 6 months, PSA remained low in both arms: SOC + MDT median 0 (mean 0.3) vs SOC alone median 0 ng/mL (mean 0.1); n=525, p=0.27
CONCLUSION
No apparent excess of high-grade acute toxicity was observed with SBRT. Longer follow-up is required to determine efficacy.
Acknowledgements, Funding: French Government grant (PHRC-K) and Johnson and Johnson; Disclosures [small]
corresponding author email: youssef.ghannam@gustaveroussy.fr
[Presenter Youssef Ghannam standing beside poster]
1) Kaplan-Meier survival data: EV+P vs chemotherapy OS KM · 2) Slide: Perioperative MIBC trial designs overview: NIAGARA · 3) Safety data: Clinical case: adverse events onset - EV-103
OncoDaily Grand Rounds at ESMO 2026: Bladder Cancer Edition continues!
María José Juan Fita (@mjuanfi81) discusses major clinical trials Niagara, EV-304/KN-B15, EV-303/KN-905, VOLGA, and their use in practice bringing case by case examples and challenges. https://t.co/IQ6trOKjeY
[Slide 1]
...e going to talk about EV-P?
...rm were alive vs 24.6% in the...
Events/N | Median OS (95% CI), mo | Stratified HR (95% CI)
240/442 | 33.6 (26.6, 39.8) | 0.53 (0.45, 0.63)
329/444 | 15.9 (13.6, 18.3)
Curve labels: 44.0% EV+P; 24.6% Chemotherapy
Number at risk rows partially visible, [illegible]
Powles T. ASCO2026
OncoDaily Grand Rounds During ESMO 2026
Survival table
Endpoint: Overall survival
Arm | N | Median | Median CI
[row 1, arm label cropped] | 442 | 33.6 | 26.6, 39.8
[row 2, arm label cropped] | 444 | 15.9 | 13.6, 18.3
HR: 0.53
HR CI: 0.45, 0.63
Landmark rates:
[not visible]: EV+P 44.0% | Chemotherapy 24.6%
[Slide 3]
What are we going to talk about?
Cis-Eligible:
Niagara (reported 2024; FDA approval March 2025; EU approval July 2025) | GC x 4 / GC + Durva x 4 | Radical Cystectomy and PLND | Observation / Durva x 8
EV-304/KN-B15 (reported: Feb 2026) | EV + Pembro x 4 / GC x 4 | Radical Cystectomy and PLND | EV x 5 + Pembro x 13 / Observation
Cis-Ineligible:
EV-303/KN-905 (reported 2025; FDA approval Nov 2025) | EV + Pembro x 3 / No preop therapy | Radical Cystectomy and PLND | EV x 6 + Pembro x 14 / Observation
VOLGA | Durva + EV x 3 / Durva/Treme + EV x 3 / No preop therapy | Radical Cystectomy and PLND | Durva x 9 / Treme x 1 + Durva x 9 / Per physician choice
...ADDER ...NCER EDITION | OncoDaily Grand Rounds During ESMO 2026
Other GU slides
231 slide posts · 45 physiciansNot tied to a single tracked trial
Renee Maria Saliby@ReneeSaliby
Slide: Renee Saliby with poster 3628P: mechanisms of resistance to nivolumab in older vs younger adults
Leaving beautiful Madrid with renewed energy and enthusiasm!
Amazing conversations, reunions, practice-changing data, and art!
#ESMO26 @OncoAlert https://t.co/yzmVmby2mP
Mechanisms of resistance to nivolumab in Older vs Younger Adults with metastatic Renal Cell Carcinoma
Renée Maria Saliby, Wassim Daoud Khatoun, Mustafa Saleh, Pablo Moura Barrios, Eddy Saad, Marc Eid, Liliana Ascione, Marc Machaalani, Clara Steiner, Toni Choueiri, David Braun
BACKGROUND
• RCC incidence rises with age -> Older Adults (OA) are a growing share of patients receiving immune checkpoint inhibitors (ICI).
• Whether age influences immune response remains unclear.
RESULTS
Table 1. Baseline characteristics of patients with resistance to nivolumab (PD, or SD with PFS <6 months) by age group.
Figure 1. OA have higher tumor mutational burden (N = 75 OA, 73 YA).
Figure 2. OA have higher ERV expression (mean log2 expression across all ERV loci). (N = 35 OA, 34 YA).
Figure 3. Immune composition (CIBERSORTx) was similar between groups, except for fewer memory activated CD4+ T cells in OA (N= 35 OA, 34 YA).
CONCLUSIONS
The mechanisms of resistance to PD-1 inhibition in mRCC may differ by age. In older adults, resistance to nivolumab may reflect age-associated immune dysfunction despite preserved tumor immunogenicity, as suggested by higher TMB and ERV expression but reduced memory activated CD4+ T-cell infiltration.
In contrast, resistance in younger adults may be driven more by tumor-intrinsic programs, including CNA-associated alterations and proliferative signaling. These data support further study of age-specific resistance biology and age-tailored strategies in mRCC.
@BraunMDPh @DrChoueiri @ReneeSaliby
FPN: 3628P
Toni Choueiri, MD@DrChoueiri
1) Trial design schema: Cohort I of KEYNOTE-365 (NCT02861573) study design - NEPC · 2) Slide: KEYNOTE-365 Cohort I response summary per RECIST v1.1 by BICR (measurable disease) · 3) Kaplan-Meier survival data: KEYNOTE-365 Cohort I rPFS per PCWG3-modified RECIST v1.1 by BICR · 4) Kaplan-Meier survival data: KEYNOTE-365 Cohort I overall survival
Encouraging OS results in neuroendocrine prostate cancer at #ESMO26!
#KEYNOTE-365 evaluated pembrolizumab + carboplatin/etoposide vs chemotherapy alone.
• mOS: 10.2 vs 7.1 months (HR 0.33)
• rPFS: 5.1 vs 4.0 months (HR 0.66)
• PD-L1 CPS ≥1: mOS 11.0 vs 4.8 months (HR 0.16)
No new safety signals observed.
@myESMO @oncoalert
[Slide 1]
Cohort I of KEYNOTE-365 (NCT02861573)
Key Eligibility Criteria
- Aged >=18 years
- Pathologicallya confirmed treatment-emergentb or de novo metastatic NEPC per central histology reviewc
- No prior platinum-based chemotherapy for NEPC
- ECOG PS 0 or 1
N = 70, Rd 1:1 or 3:1
n = 40: Pembrolizumab 200 mg IV Q3W x <=35 cycles + Carboplatin AUC IV 5 Q3W x 4-6 cycles + Etoposide 100 mg/m2 IV d1-3 Q3W x 4-6 cycles
n = 30: Carboplatin AUC 5 IV Q3W x 4-6 cycles + Etoposide 100 mg/m2 IV d1-3 Q3W x 4-6 cycles
-> Treatment continued until unacceptable toxicity, PD, or participant or physician decision to withdraw
Stratification factor
- ECOG PS (0 vs 1)
Primary endpoints included
- ORR per RECIST v1.1 by blinded independent central review (BICR)
- Safety
Secondary endpoints included
- DOR per RECIST v1.1 by BICR
- rPFS per PCWG3-modified RECIST v1.1 by BICR
- OS
Post hoc analysis
- ORR, rPFS, and OS by PD-L1 status
Median study follow-up (time from randomization to data cutoff date [November 19, 2025]): 15.4 months (range, 0.8-43.5)
aBy morphology and immunohistochemistry. bParticipants had progression <=6 months before screening and prior treatment with ADT for metastatic disease. Prior treatment with <=2 chemotherapy regimens for mCRPC and <=2 prior NHA for mCRPC was allowed. Docetaxel for mHSPC was allowed in addition to docetaxel for mCRPC. If docetaxel chemotherapy was used more than once, it was considered 1 therapy. cParticipants had one of the following: small cell carcinoma, large cell neuroendocrine carcinoma, or mixed (adenocarcinoma with either small or large cell neuroendocrine carcinoma). Participants with adenocarcinoma with neuroendocrine features were not eligible. Neuroendocrine histology according to the Epstein criteria (Epstein JI et al. Am J Surg Pathol. 2014;38:756-767) was confirmed by central histology review. dRandomization was 1:1 initially, then updated to 3:1 after a protocol amendment effective February 7, 2025.
[Slide 2]
Response Summary per RECIST v1.1 by BICR Among Participants With RECIST-Measurable Disease
Columns: Total population - Pembro + chemo n = 36 | Chemo n = 27; PD-L1 subgroup CPS >=1 - Pembro + chemo n = 15 | Chemo n = 11; CPS <1 - Pembro + chemo n = 20 | Chemo n = 15
ORR, % (95% CI)a: 28 (14-45) | 15 (4-34) | 40 (16-68) | 18 (2-52) | 15 (3-38) | 13 (2-40)
DCR, % (95% CI)b: 50 (33-67) | 48 (29-68) | 67 (38-88) | 55 (23-83) | 35 (15-59) | 47 (21-73)
Best overall response, n (%)
CR: 0 | 0 | 0 | 0 | 0 | 0
PR: 10 (28) | 4 (15) | 6 (40) | 2 (18) | 3 (15) | 2 (13)
SD of any duration: 8 (22) | 9 (33) | 4 (27) | 4 (36) | 4 (20) | 5 (33)
SD >=6 mo: 3 (8) | 1 (4) | 1 (7) | 0 | 2 (10) | 1 (7)
PD: 13 (36) | 6 (22) | 3 (20) | 2 (18) | 10 (50) | 3 (20)
No assessmentc: 5 (14) | 7 (26) | 2 (13) | 3 (27) | 3 (15) | 4 (7)
Not evaluabled: 0 | 1 (4) | 0 | 0 | 0 | 1 (27)
DOR, median (range), mo: 6.2 (2.0+ to 10.2+) | 4.1 (2.8+ to 6.2) | 8.3 (3.2+ to 10.2+) | 4.9 (3.5 to 6.2) | 4.1 (2.0+ to 4.1) | 4.1 (2.8 to 4.1+)
"+" indicates no PD at the time of the last disease assessment. aIncludes participants with confirmed CR or PR. bIncludes participants with CR, PR, or SD of any duration. cIncludes participants without postbaseline assessments as of the data cutoff date, including missed treatment, discontinued treatment, or death before first postbaseline assessment. dIncludes participants who had a baseline assessment but no postbaseline assessment at the data cutoff date. Data cutoff date: November 19, 2025.
[Slide 3]
rPFS per PCWG3-Modified RECIST v1.1 by BICR
Total population
[table] Events, n (%) | Median (95% CI), mo | HR (95% CI)
Total population
Pembro + chemo (n = 40): 23 (58) | 5.1 (4.1-6.3) | 0.66 (0.36-1.21)
Chemo (n = 30): 23 (77) | 4.0 (2.1-5.0)
PD-L1 CPS >=1
Pembro + chemo (n = 15): 8 (53) | 6.0 (3.9-NR) | 0.40 (0.16-1.01)
Chemo (n = 12): 11 (92) | 3.8 (0.4-5.0)
PD-L1 CPS <1
Pembro + chemo (n = 23): 14 (61) | 5.1 (4.0-6.3) | 0.87 (0.38-1.97)
Chemo (n = 16): 11 (69) | 4.1 (1.9-7.0)
Curve label at 6 months: 49% (pembro + chemo) / 26% (chemo)
Y-axis: rPFS, %; X-axis: Months
No. at risk (0,2,4,6,8,10,12,14,16 mo)
Pembro + chemo: 40 32 22 12 3 1 0 0 0
Chemo: 30 20 13 5 2 0 0 0 0
Data cutoff date: November 19, 2025.
Survival table
Endpoint: rPFS per PCWG3-modified RECIST v1.1 by BICR, total population (subgroups in table)
Arm | N | Median | Median CI
Pembro + chemo (total) | 40 | 5.1 | 4.1-6.3
Chemo (total) | 30 | 4.0 | 2.1-5.0
Pembro + chemo (CPS>=1) | 15 | 6.0 | 3.9-NR
Chemo (CPS>=1) | 12 | 3.8 | 0.4-5.0
Pembro + chemo (CPS<1) | 23 | 5.1 | 4.0-6.3
Chemo (CPS<1) | 16 | 4.1 | 1.9-7.0
HR: 0.66 (total); 0.40 (CPS>=1); 0.87 (CPS<1)
HR CI: 0.36-1.21 (total); 0.16-1.01 (CPS>=1); 0.38-1.97 (CPS<1)
Landmark rates:
6 mo: Pembro + chemo (total) 49% | Chemo (total) 26%
[Slide 4]
Overall Survival
Total population
[table] Events, n (%) | Median (95% CI), mo | HR (95% CI)
Total population
Pembro + chemo (n = 40): 25 (63) | 10.2 (8.0-11.4) | 0.33 (0.17-0.63)
Chemo (n = 30): 25 (83) | 7.1 (4.0-8.2)
PD-L1 CPS >=1
Pembro + chemo (n = 15): 9 (60) | 11.0 (8.7-11.9) | 0.16 (0.05-0.49)
Chemo (n = 12): 12 (100) | 4.8 (1.9-8.6)
PD-L1 CPS <1
Pembro + chemo (n = 23): 14 (61) | 8.1 (6.6-13.0) | 0.49 (0.21-1.11)
Chemo (n = 16): 12 (75) | 7.1 (3.6-9.9)
Curve label at 6 months: 85% (pembro + chemo) / 59% (chemo)
Y-axis: OS, %; X-axis: Months
No. at risk (0,2,4,6,8,10,12,14,16,18,20,22,24 mo)
Pembro + chemo: 40 34 31 26 18 13 5 3 3 3 3 2 2
Chemo: 30 26 21 17 10 2 1 0 0 0 0 0 0
Data cutoff date: November 19, 2025.
Survival table
Endpoint: OS, total population (subgroups in table)
Arm | N | Median | Median CI
Pembro + chemo (total) | 40 | 10.2 | 8.0-11.4
Chemo (total) | 30 | 7.1 | 4.0-8.2
Pembro + chemo (CPS>=1) | 15 | 11.0 | 8.7-11.9
Chemo (CPS>=1) | 12 | 4.8 | 1.9-8.6
Pembro + chemo (CPS<1) | 23 | 8.1 | 6.6-13.0
Chemo (CPS<1) | 16 | 7.1 | 3.6-9.9
HR: 0.33 (total); 0.16 (CPS>=1); 0.49 (CPS<1)
HR CI: 0.17-0.63 (total); 0.05-0.49 (CPS>=1); 0.21-1.11 (CPS<1)
Landmark rates:
6 mo: Pembro + chemo (total) 85% | Chemo (total) 59%
Tom Powles@tompowles1
Response data: ABBV-969 PSA waterfall: deep and durable PSA responses after taxanes and RLTs
ABBV-969 dual-targeting ADC #ESMO26
MOA = PSMA/STEAP1— TOPO1
Deep responses in metastatic castration-resistant prostate cancer
Surely this one can beat Docetaxel? https://t.co/NRR8xw9KS3
ABBV-969 achieved deep and durable PSA responses in patients with bone and soft tissue lesions who progressed on taxanes and RLTs
• Confirmed PSA50 at ≥ 3 mg/kg was 67.4% (29/43)
• Confirmed PSA90 at ≥ 3 mg/kg was 30.2% (13/43)
• Median duration of PSA response was 10.8 months (95% CI: 6.7, NE)
• Median time to PSA response was 3.0 months (95% CI: 2.0, 5.2)
[Waterfall plot] PSA change from baseline, % (30 to −100); PSA50; PSA90
Dose: 1 mg/kg · 2 mg/kg · 3 mg/kg · 5 mg/kg · 8 mg/kg · 10 mg/kg · 12.5 mg/kg
Prior PSMA-RLT / Prior Taxane / Target Lesion / RECISTᵇ [per-patient grid]
Yes · No · CR · PR · SD · NAᵃ
Julian Chavarriaga@chavarriagaj
1) Kaplan-Meier survival data: POTOMAC DFS KM curves in papillary-only and T1 subgroups · 2) Slide: POTOMAC early high-risk disease events, papillary-only and T1 subgroups · 3) Kaplan-Meier survival data: POTOMAC cystectomy-free survival KM curves, papillary-only
#ESMO26 A subgroup analysis of the phase III POTOMAC trial in papillary-only high-risk NMIBC:
📌Papillary-only: DFS HR 0.56; 48-month DFS 84% vs 74%
📌T1 subgroup: DFS HR 0.48; 48-month DFS 85% vs 73%
📌High-risk recurrence: 13% vs 20% in papillary-only disease
📌 Fewer early high-risk events, BCG-unresponsive recurrences and cystectomies
📌The trade-off: Grade 3–4 AEs were 34% vs 16%.
@UroToday @myESMO
[Slide 1]
POTOMAC: Disease-Free Survival in Patients With Papillary Only and With T1 Tumours
D+BCG (I+M) showed a consistent benefit across papillary only and T1 subgroups
Papillary only (64%-65% of ITT population)a,b,1
| D+BCG (I+M) N=217 | BCG (I+M) N=220
Number of events, n (%) | 37 (17) | 65 (30)
Median DFS, months (95% CI) | NR (NR-NR) | NR (74.0-NR)
Median follow-up in censored patients: 60.7 months
Landmark labels: D+BCG 87% / 84% / 84%; BCG 81% / 76% / 74% (at dashed lines 24, 36, 48 months)
HR 0.56 (95% CI, 0.37-0.84)
No. of patients at risk (0-81 months, every 3 months)
D+BCG (I+M) 217 204 190[?] 184 183 178 177 174 168 167 164 160[?] 154 150 148 145 144 133 127 102 98[?] 69 57 38 19 9 1 0
BCG (I+M) 220 207 195 188 180 177 172 167 163 159 155 150 146 145 142 141 140 130 122 99 92 63 53 32 17 7 0 0
T1 subset of papillary only (40%-43% of ITT population)c,d
| D+BCG (I+M) N=137 | BCG (I+M) N=145
Number of events, n (%) | 22 (16) | 45 (31)
Median DFS, months (95% CI) | NR (NR-NR) | NR (69.3-NR)
Median follow-up in censored patients: 60.7 months
Landmark labels: D+BCG 88% / 85% / 85%; BCG 79% / 75% / 73% (at dashed lines 24, 36, 48 months)
HR 0.48 (95% CI, 0.28-0.79)
No. of patients at risk
D+BCG (I+M) 137 130 120 117 117 114 114 112 109 108 106 103 101 99 98[?] 97 96[?] 90 87 70 68 52 45 30 17 6[?] 1 0
BCG (I+M) 145 136 128 125 117 114 111 106 103 102 98 95 92 91 91 90 90 83 78 68 61 43 35 21 11 4 0 0
x-axis: Time from randomisation (months); y-axis: Probability of DFS
Survival table
Endpoint: DFS (papillary-only subgroup; T1 subset reported in notes)
Arm | N | Median | Median CI
D+BCG (I+M), papillary only | 217 | NR | NR-NR
BCG (I+M), papillary only | 220 | NR | 74.0-NR
D+BCG (I+M), T1 subset | 137 | NR | NR-NR
BCG (I+M), T1 subset | 145 | NR | 69.3-NR
HR: 0.56 (papillary only); 0.48 (T1 subset)
HR CI: 0.37-0.84 (papillary only); 0.28-0.79 (T1 subset)
Landmark rates:
24 mo: D+BCG papillary only 87% | BCG papillary only 81% | D+BCG T1 subset 88% | BCG T1 subset 79%
36 mo: D+BCG papillary only 84% | BCG papillary only 76% | D+BCG T1 subset 85% | BCG T1 subset 75%
48 mo: D+BCG papillary only 84% | BCG papillary only 74% | D+BCG T1 subset 85% | BCG T1 subset 73%
[Slide 2]
POTOMAC: Early High-Risk Disease Events in Patients With Papillary Only and With T1 Tumours
The addition of D to BCG (I+M) resulted in fewer early high-risk recurrences, which are associated with worse outcomes(a,b)
Papillary only
D+BCG (I+M) | BCG (I+M)
Patients
Time from randomisation to high-risk event (months) 0 3 6 9 12
T1
D+BCG (I+M) | BCG (I+M)
Early high-risk events:
16 patients in D+BCG (I+M) arm vs 29 patients in BCG (I+M) arm
Early high-risk events:
10 patients in D+BCG (I+M) arm vs 20 patients in BCG (I+M) arm
[Slide 3]
POTOMAC: Cystectomy-Free Survival in Patients With Papillary Only and With T1 Tumours
Cystectomy-free survival showed a favourable trend for D+BCG (I+M) vs BCG (I+M)(a)
Papillary only
| D+BCG (I+M) N=217 | BCG (I+M) N=220
Total events, n (%) | 31 (14) | 52 (24)
Median CFS, months (95% CI) | NR (NR–NR) | NR (78.3–NR)
HR 0.59 (95% CI, 0.38–0.92)
T1
| D+BCG (I+M) N=137 | BCG (I+M) N=145
Total events, n (%) | 18 (13) | 39 (27)
Median CFS, months (95% CI) | NR (NR–NR) | 78.3 (78.3–NR)
HR 0.45 (95% CI, 0.25–0.78)
Probability of cystectomy-free survival
Time from randomisation to cystectomy-free survival (months) 0–84
No. of patients at risk (papillary only)
D+BCG (I+M) 217 214 208 205 203 199 196 193 192 191 189 187 185 184 181 179 179 177 176 153 140 114 86 72 48 24 12 1 0
BCG (I+M) 220 218 215 210 207 204 202 199 196 196 191 190 188 185 181 177 174 171 168 145 135 112 82 64 41 21 8 0 0
No. of patients at risk (T1)
D+BCG (I+M) 137 135 130 129 127 125 124 121 121 121 121 120 119 118 117 116 115 114 114 108 94 74 62 49 35 19 11 1 0
BCG (I+M) 145 144 141 139 136 133 132 130 129 128 126 125 123 120 117 114 113 111 109 97 89 73 54 42 28 14 4 0 0
Survival table
Endpoint: Cystectomy-free survival (papillary-only subgroup; T1 subgroup reported separately)
Arm | N | Median | Median CI
D+BCG (I+M) — papillary only | 217 | NR | NR–NR
BCG (I+M) — papillary only | 220 | NR | 78.3–NR
D+BCG (I+M) — T1 | 137 | NR | NR–NR
BCG (I+M) — T1 | 145 | 78.3 | 78.3–NR
HR: 0.59 (papillary only); 0.45 (T1)
HR CI: 0.38–0.92 (papillary only); 0.25–0.78 (T1)
Rashid K. Sayyid@RKSayyid
1) Slide: Bladder preservation after neoadjuvant/perioperative therapy in MIBC: study flow · 2) Kaplan-Meier survival data: reTURBT bladder-preservation group: EFS and OS KM curves (N=53) · 3) Kaplan-Meier survival data: EFS and OS by pathological response: reTURBT vs radical
Bladder preservation after neoadjuvant/perioperative therapy in 🇮🇹 MIBC pts who declined RC and underwent reTURBT (n=54)
📌Negative imaging, biopsy & cytology
🔹19% recurred; 13% developed distant recurrence
🔹 ypT0Nx at reTURBT → 24-mo EFS 88%; MFS & OS >95%, comparable with ypT0N0 after RC
🔹 Residual disease at reTURBT → substantially worse vs non-pCR after RC: 24-mo EFS 19% vs 68%; OS 50% vs 83%
🔹 20% required delayed RC or chemoRT
🔹 Baseline cT3–4 disease also associated with poorer outcomes
🔑 Pathologic clearance at reTURBT may identify a highly selected group for bladder preservation; residual disease was associated with markedly inferior outcomes vs RC.
@urotoday #ESMO26
[Slide 1]
ADC Development Landscape
ADC development has accelerated since 2020
First-in-human studies [stacked bar chart 2010-2024; Number of FIH studies]
Legend: ADC (monospecific); ADC (bispecific); ADC (unconventional)
Multiple antigens are being explored as ADC targets
Monospecifics [bar chart; Number of ADC; Early stage / Late stage]
Targets: HER2, B7-H3, TROP-2, Claudin 18.2, Cadherin-17, FR α, Nectin-4, HER3, cMET, DLL3, ROR1, Tissue factor, B7-H4, Cadherin-6, FGFR2b, PTK7, EGFR, GPC3, 5T4, CD37, CEA, Claudin-6, Integrin β6, PSMA
ADC development is advancing in various cancer types, but progress in renal cell carcinoma remains limited
[Horizontal bar chart, Number of ADCs; Approved / Late stage (including regulatory review)]
Tumour types: Prostate, Endometrial cancer, SCLC, Pancreatic cancer, Colorectal, Esophageal squamous cell carcinoma, Blastic plasmacytoid dendritic cell neoplasm, HER2-positive solid tumors, Nasopharyngeal carcinoma, Cervical cancer, Urothelial cancer, Gastric cancer, Breast cancer, Ovarian, peritoneal, or fallopian tube cancer, NSCLC, B cell NHL, Acute myeloid leukemia, Cutaneous T cell lymphoma, Anaplastic large cell lymphoma, Hodgkin lymphoma, Acute lymphoblastic leukemia, Multiple myeloma
Conilh L. et al. Cell 189:2791,2026
[Slide 2]
ADC Development in RCC: Limited Success So Far
ADC | Target | Payload | Trial | Key results | Clinical trial Status
SGN-75(1) | CD70 | MMAF | Phase I | Efficacy: 1 CR, 2 PRs; Safety: Ocular toxicity, thrombocytopenia | Inactive
AMG 172(2) | CD70 | DM1 | Phase I | Efficacy: ORR 5.4%; Safety: Thrombocytopenia; hepatotoxicity | Inactive
AGS-16M8F / AGS-16C3F(3) | ENPP3 | MMAF | Phase I / II | Efficacy: ORR 7.5%; mPFS 2.9 vs 5.7 mo (axitinib); Safety: Ocular toxicity | Inactive
CDX-014(4) | TIM-1 | MMAE | Phase I | Efficacy: ORR 6%; Safety: Treatment-related death (multi-organ failure) | Inactive
HKT288(5) | CDH6 | DM4 | Phase I | Efficacy: No objective responses; Safety: Neurological toxicity | Inactive
SGN-CD70A(6) | CD70 | PBD dimer | Phase I | Efficacy: ORR 5.6%; Safety: Thrombocytopenia (DLT) | Inactive
MDX-1203(7) | CD70 | Duocarmycin | Phase I | Efficacy: ORR not reported; Safety: Delayed edema / effusions | Inactive
DS-6000a(8) | CDH6 | DXd | Phase I / II | Efficacy: Early RCC activity (1 confirmed PR); Safety: Thrombocytopenia (early Phase I) | Ongoing
Inactive: No ongoing clinical development identified as of October 2026.
1 Tannir et al. Invest New Drugs. 32(6);1246, 2014.
2 Massard et al. Cancer Chemother Pharmacol. 83:1057, 2019.
3 Thompson et al. Clin Cancer Res.24(18);4399, 2018 Kollmannsberger et al. Oncologist. 26(3):182, 2021.
4 McGregor et al. J Immunother Cancer. 38(6):1807,2020.
5 Schöffski et al. Oncol Res Treat 44(10):547,2021.
6 Pal et al. Cancer. 125:1124,2019.
7 Owonikoko et al. Cancer Chemother Pharmacol. 77(1):155,2016
8 Hamilton et al. J Clin Oncol. 40(16) suppl 3002(2022); NCT04707248; NCT06660654.
[Slide 3]
BARRIER 1: Delivery
Can the ADC reach the tumor cell?
[Schematic: Pharmacokinetics; Tumor penetration (highlighted); Target recognition; Intracellular trafficking; Payload; TME modulation]
Mosele et al. Nat Med (32)2774-2785, 2026
Potential barriers in ccRCC
1. Hypervascularity ü uniform ADC delivery
[Images A-F: MRI, perfusion map (scale 0-300), gross specimen, IHC]
Yuan Q. et al. Clin Genitourin Cancer 14(6); e585-e594, 2016
• Intratumoral perfusion is spatially heterogeneous even in hypervascular ccRCC.
• Heterogenous perfusion may result in spatially uneven ADC delivery to tumor cells.
[Slide 4]
ADC targets are abundant in ccRCC — but is high expression enough?
Expression of ADC-related target genes
BeforeIO Tokyo ccRCC samples only
[Violin plot, log2(TPM + 1): CD70, ENPP3, B7-H3, CDH6, CAIX, PSMA, TROP2, Nectin-4]
Bulk RNAseq in 24 ccRCC (unpublished data)
IHC expression of ADC target antigens in renal cancer
Legend: High; Medium; Low; Not detected
CAIX | CAB017107 | 5 (High) | 6 (Medium) | n=12
CDH6 | HPA007047 | 2 (High) | 10 (Medium) | n=12
B7-H3 | CAB017826 | [High, unlabelled] | 4 (Medium) | 6 (Low) | n=11
TROP2 | HPA043104 | 11 (Not detected) | n=11
Nectin-4 | HPA010775 | 4 (Low) | 8 (Not detected) | n=12
ENPP3 | HPA043772 | [Medium, unlabelled] | 6 (Low) | 5 (Not detected) | n=12
CD70 | IHC pending | No IHC data
HPA renal cancer IHC | One illustrative antibody per target; not an inter-protein abundance ranking. Antibody-dependent staining; histology not restricted to ccRCC. CD70: IHC pending.
https://www.proteinatlas.org/
Alan Tan@alantanmd
1) Slide: PROTEUS discussion: no PSMA PET at diagnosis (van As, ESMO 2026) · 2) Slide: PROTEUS discussion: progression or delayed detection schematic (van As, ESMO 2026) · 3) Kaplan-Meier survival data: PROTEUS time to first subsequent therapy KM (van As discussion, ESMO 2026)
#ESMO26 PROTEUS discussion by Nicholas van As
• No baseline PSMA PET; enrolled conventionally staged M0
• MFS events: true progression or delayed detection? Most were PSMA PET-detected (8.8% vs 16.3%)
• TTST HR 0.29, but ~20-mo lead-time bias
#ProstateCancer https://t.co/FfugtpcYwU
[Slide 1]
No PSMA PET at diagnosis
EAU and ESMO recommendations for initial staging of prostate cancer
INITIAL STAGING BY RISK CATEGORY
Low / favourable intermediate: No routine metastatic imaging
Unfavourable intermediate: Consider PSMA PET/CT
High risk / locally advanced: PSMA PET/CT if available
WHY PSMA PET?
proPSMA: staging accuracy 92% PSMA PET vs 65% CT + bone scan
More sensitive detection of nodal and distant disease before radical treatment
PROTEUS enrolled conventionally staged M0 patients without baseline PSMA PET.
Nicholas van As
[Slide 2]
Progression or delayed detection?
Baseline conventional imaging, but PSMA PET used to identify subsequent events
BASELINE: CONVENTIONAL IMAGING | FOLLOW-UP: PSMA PET
CT + bone scan M0 → Occult PSMA-avid micrometastasis → PSMA PET positive "MFS event"
Two biologically different possibilities can produce the same observed event:
A. Truly new metastatic progression
B. Pre-existing disease first detected later
Without baseline PSMA PET, these cannot reliably be distinguished.
~70% of RP patients with PSMA PET-detected relapse had persistent PSA.
Nicholas van As
[Slide 4]
Is avoiding subsequent treatment a patient benefit?
100% of these patients have already received a second + third treatment
Time to First Subsequent Therapy (%)
Median 46.0 months APA + ADT
Median 12.3 months RP + PLND alone
64.6% (95% CI, 54.1-73.3)
32.0% (95% CI, 26.7-37.5)
HR, 0.29
95% CI, 0.20-0.43
nominal p<0.001^b
Months from Randomization: 0 6 12 18 24 30 36 42
No. at risk
APA + ADT 102 97 91 87 81 73 42 12
RP + PLND [illegible - row cropped]
• Postoperative RT is initiated by BCF
• 20% vs 43% at 3 years
• ....but there is an approximately 20 month lead time bias
Survival table
Endpoint: Time to first subsequent therapy
APA + ADT | 102 | 46.0 months
RP + PLND alone | 12.3 months
HR: 0.29
HR CI: 0.20-0.43
P: nominal p<0.001
Landmark rates:
36 mo: APA + ADT 64.6% (CI 54.1-73.3) | RP + PLND alone 32.0% (CI 26.7-37.5)
Alan Tan@alantanmd
1) Slide: PROTEUS discussant slide: safety of 1 year perioperative apalutamide + ADT vs RP + PLND alone · 2) Slide: PROTEUS discussant slide: what happens after control-arm failure? (Nicholas van As) · 3) Slide: PROTEUS discussant slide: a positive result, but significant limitations (Nicholas van As) · 4) Slide: PROTEUS discussant conclusion: should practice change now? (Nicholas van As)
One year of APA+ADT comes with toxicity, and outcomes after control-arm salvage aren't shown. His view: follow-up too short; would not yet support perioperative APA+ADT with RP in high-risk disease, needing mature survival and post-salvage data first. https://t.co/rmhKREVtW2
[Slide 1]
Is avoiding subsequent treatment a patient benefit?
One year of ADT + Apalutamide comes at a price
Safety population, n (%) | Perioperative APA + ADT (n=101): All grades | Grade ≥3 | RP + PLND alone (n=286): All grades | Grade ≥3
Hot flush | 65 (64) | 0 | 2 (0.70) | 0
Fatigue | 22 (22) | 0 | 8 (2.8) | 0
Rash | 16 (16) | 3 (3.0) | 2 (0.70) | 0
Arthralgia | 16 (16) [uncertain - may read 15 (15)] | 1 (1.0) | 10 (3.5) | 0
Pruritus | 13 (13) | 0 | 1 (0.35) | 0
Hypertension | 10 (9.9) | 5 (5.0) | 13 (4.5) | 7 (2.4)
COVID-19 | 10 (9.9) | 0 | 4 (1.4) | 0
Asthenia | 10 (9.9) | 0 | 2 (0.70) | 0
[Slide 2]
What happens AFTER control-arm failure?
PROTEUS EFS records the first event — not the outcome after effective salvage treatment
PSA persistence / recurrence or PET-detected relapse → SALVAGE / SUBSEQUENT TREATMENT RT ± ADT | ADT + ARPI Other MDT-directed care → LONG-TERM OUTCOME NOT SHOWN
KEY QUESTION: How many control patients were successfully salvaged — and what were their subsequent outcomes?
Nicholas van As
[Slide 3]
PROTEUS: a positive result, but significant limitations
EFS and MFS at 3 years median follow-up is too short
INITIAL STAGING: No baseline PSMA PET in a very-high-risk population
PRIMARY ENDPOINT: EFS includes biochemical failure during prolonged androgen suppression
MFS: PSMA PET-detected events complicate interpretation without baseline PET
TOXICITY: Significant increase in toxicity
COMPARATOR: RP alone versus multimodality care, or ADT +RT
Nicholas van As
[Slide 4]
Should practice change now?
I would not currently support perioperative apalutamide + ADT with radical prostatectomy in high-risk prostate cancer.
Longer follow-up, mature survival data and outcomes after salvage treatment are needed before changing practice.
Nicholas van As
Tom Powles@tompowles1
Slide: Efficacy summary by tumor type (HNSCC, melanoma, HCC, CC, PROC) from phase 1b combination study - ESMO 2026
Phase 1b combination data for elfetabart drozuntecan (B7H3/Topo-1 ADC) combined with pumitamig (VEGF/PD1 bispecific) shows striking response relates with ~40% G3/4 AEs. Perhaps the best new combination data #ESMO26 . EV + VEGF/PD1 combos are under investigation in bladder cancer too with EV. @OncoAlert
Efficacy summary
Encouraging early responses were observed across all tumor types
Efficacy parameter | HNSCC (N=39) | Melanoma (N=26) | HCC (N=21) | CC (N=22) | PROC (N=31) | Total* (N=139)
Prior treatment, median (range), lines | 2 (1–4) | 2 (1–5) | 2 (1–2) | 2 (1–4) | 2 (1–4) | 2 (1–5)
Follow-up duration, median (range), months | 4.8 (0.5–10.0) | 7.4 (3.6–12.5) | 7.7 (1.4–9.3) | 6.1 (4.0–11.4) | 6.5 (2.6–8.6) | 6.3 (0.5–12.5)
Unconfirmed BOR, n (%)
CR | 0 | 0 | 0 | 1 (4.5) | 2 (6.5) | 3 (2.2)
PR | 15 (38.5) | 8 (30.8) | 9 (42.9) | 10 (45.5) | 23 (74.2) | 65 (46.8)
SD | 19 (48.7) | 13 (50.0) | 10 (47.6) | 9 (40.9) | 3 (9.7) | 54 (38.8)
PD | 4 (10.3) | 5 (19.2) | 1 (4.8) | 2 (9.1) | 3 (9.7) | 15 (10.8)
NE/missing | 1 (2.6) | 0 | 1 (4.8) | 0 | 0 | 2 (1.4)
uORR, % (95% CI) | 38.5 (23.4–55.4) | 30.8 (14.3–51.8) | 42.9 (21.8–66.0) | 50.0 (28.2–71.8) | 80.6 (62.5–92.5) | 48.9 (40.4–57.5)
cORR, % (95% CI) | 23.1 (11.1–39.3) | 26.9 (11.6–47.8) | 38.1 (18.1–61.6) | 40.9 (20.7–63.6) | 71.0 (52.0–85.8) | 39.6 (31.4–48.2)
Pending confirmation, n (%)† | 3 (7.7)‡ | 1 (3.8) | 0 | 1 (4.5) | 2 (6.5) | 7 (5.0)
DCR, % (95% CI) | 87.2 (72.6–95.7) | 80.8 (60.6–93.4) | 90.5 (69.6–98.8) | 90.9 (70.8–98.9) | 90.3 (74.2–98.0) | 87.8 (81.1–92.7)
*Efficacy-evaluable participants: received ≥1 dose of study drug, baseline efficacy assessment, and ≥1 post-baseline assessment or early treatment discontinuation.
†Pending confirmation includes patients with an observed CR/PR whose confirmed BOR was not yet available as of September 4, 2026, excluding those who received new anticancer therapy, died/reached EOS, or had confirmed PD before response confirmation.
‡As of Oct 09, of the 7 responses pending confirmation at the data cutoff, 3 have since been confirmed, while the remaining 4 are awaiting the next tumor assessment.
[abbreviations footnote illegible]
Data cutoff date: September 4, 2026
Tom Powles@tompowles1
Slide: Photo of a presented conference slide
Ivonescimab (VEGF/PD1 bispecific) shows response rates of 65% in IMDC good risk RCC #ESMO26
Single agent VEGF TKI is probably close to this activity, but it’s higher than single agent PD1
It’s likely combinations will be needed to clearly improve on existing 1st line options @OncoAlert @DrChoueiri
Efficacy-ORR
• A total of 23 patients have received at least one tumor assessment
• ORR was 65.2%(15/26), DCR was 95.7%(22/26). Tumor shrinkage were obsevered in 87% (20/23) patients
• irORR was 69.6% (Only one patient had PD at the first assessment, subsequently classified as irPR per iRECIST)
| Ivonescimab (n=23) n (%)
Best Overall Response (BOR) |
CR | 0 (0.0%)
PR | 15 (65.2%)
SD | 7 (30.4%)
PD | 1 (4.3%)
Objective Response Rate (ORR) | 65.2%
Disease Control Rate (DCR) | 95.7%
[Waterfall plot legend: PR, SD, PD; y-axis Best percentage of change from baseline (%)]
Data cutoff date: July 14, 2026
Jun Guo, MD
Yüksel Ürün@DrYukselUrun
Slide: The mCRPC metro map - treatment sequencing options after mHSPC therapy (slide by Deborah Mukherji)
Brilliant map, @dmukherji 🚇
One question: is this a Madrid-only ticket, or can we use it worldwide? 😄
Different routes, same destination: better care for our patients.
@myESMO @OncoAlert @OpenMedicineHQ #ESMO26 https://t.co/5NpOSfXyqz
Metro Madrid
The mCRPC metro map
Same destination. Different journey. The map ahead depends on the route already travelled.
Initial treatment in mHSPC
ADT only
ADT + ARPI
ADT + ARPI + PSMA-RLT
ADT + ARPI + PARPi
ADT + ARPI + AKTi
ADT + ARPI + docetaxel
AR-naïve Taxane-naïve
AR-exposed Taxane-naïve
AR and PSMA-exposed Taxane-naïve
AR and PARP-exposed Taxane-naïve
AR and AKT-exposed Taxane-naïve
AR and taxane-exposed
mCRPC/ AMPR
Next treatment options (mechanisms)
Multiple paths beyond mCRPC – the most appropriate depends on prior treatment, tumour biology, phenotype and patient factors.
Taxane (microtubule inhibition)
PARP (DNA repair)
PSMA-RLT (PSMA targeting)
Radium-223 + enza (bone-targeted α-emitter)
AR pathway (when appropriate)
Immunotherapy / novel targets (selected patients)
Andrea Necchi, MD, FASCO@AndreaNecchi
Slide: Best Poster: MIBC patients declining radical cystectomy - outcomes by cCR
This further #ESMO26 @ESMO_Open simultaneous publication is very important for me. @SanRaffaeleMI @MyUniSR
Outcomes of pts with MIBC who decline RC in perioperative setting:
Take-home message:
1. cCR (Milan criteria) is a reliable biomarker and indicator of outcomes with Systemic Rx and reTURBT
2. Pts who do not get cCR could have a very poor prognosis under bladder-saving approaches > intensification with RC/chemoRT is very much needed
Looking forward to ongoing trials (eg EV209, EV309). Congrats to the entire team, also getting Best Poster! @OncoAlert @myESMO @CMercinelli @Anto_cigliola @BrigidaMaiorano @urotoday Piacentini Nasso Serafin et al.
Outcomes of patients with muscle-invasive bladder cancer who declined radical cystectomy in perioperative therapy trials conducted at San Raffaele Comprehensive Cancer Center - ESMO Open https://t.co/VhOHVA1GWH
[Photo of poster with red 'BEST POSTER' rosette; partial view, left side cropped]
[...]ctomy (RC)
[...]i,1 Giovanni L. Pastorino, [...] Lacava,1 Gaia [...]
[...]don Foundation Trust, London, UK. 5. Depart[ment ...] Oncology 2, Azienda Ospedaliero-[...] [...]ital, Comprehensive Cancer Center, Milan, [...]
Table (partial): Site of relapse | Status
Bladder pTaHG > systemic | Dea[d]
Bladder pT2 | De[ad]
Systemic | [obscured]
Systemic | Alive
Bladder pT2 | Alive
Bladder pT1HG | Alive
Systemic | Alive
Systemic | Alive
Bladder pT2 > systemic | Alive
Bladder pT1HG > systemic | Alive
[...]erapy (chemoradiotherapy in all cases).
[...]residual tumor or intravesical [...]py, recurrence/progression occurred in [...]
Full Paper Here
DOI: 10.1016/j.esmoop.2026.108634
CONCLUSIONS
Patients with ypT0Nx at reTURBT achieved 24-month MFS and OS >95%, comparable to those with ypT0N0 after RC, supporting biopsy-confirmed cCR (Milan criteria) as a [cr]iterion for bladder preservation.
Zach Klaassen@zklaassen_md
Slide: Spectrum of PARP inhibitor sensitivity in mCRPC by HRR gene alteration: rPFS and OS hazard ratios
#ESMO26 Management of mCRPC: Personalized treatment selection and sequencing @dmukherji @urotoday
Spectrum of PARPi sensitivity in mCRPC by HRR gene alteration
Evidence from PROfound, MAGNITUDE, TALAPRO-2, PROpel, and FDA pooled analysis https://t.co/utv8m4w2nT
Stronger and more consistent evidence of benefit → Weaker or uncertain evidence of benefit
BRCA2 | BRCA1 | PALB2 | CDK12 | ATM | CHEK2 | Other HRR genes (FANCA, RAD51C/D, BARD1, BRIP1, etc.) | HRR-negative (non-HRRm)
Prevalence in mCRPC (approx.): ~5–8% | ~1–2% | ~1–2% | ~3–5% | ~3–5% | ~1–2% | ~3–5% | ~70% (no HRR alteration)
rPFS HR (95% CI) PARPi + ARPI vs ARPI: 0.31 (0.23–0.42) | 0.51 (0.23–1.10) | 0.52 (0.23–1.17) | 0.50 (0.32–0.80) | 1.05 (0.74–1.49) | 1.06 (0.67–1.66) | Variable (insufficient data) | PROpel Olaparib + Abiraterone rPFS HR 0.76 (0.60–0.97) OS HR 0.89 (0.70–1.14)
OS HR (95% CI) PARPi + ARPI vs ARPI: 0.66 (0.49–0.89) | 0.74 (0.34–1.61) | 0.78 (0.34–1.80) | 0.63 (0.39–0.99) | 1.18 (0.82–1.71) | 1.53 (0.95–2.46) | Variable (insufficient data) | TALAPRO-2 Talazoparib + Enzalutamide rPFS HR 0.69 (0.49–0.98) OS HR 0.78 (0.58–1.05)
Key interpretation:
BRCA2: • Strongest and most consistent benefit across trials • Highest response rates and longest duration of benefit
BRCA1: • Evidence of benefit but smaller magnitude than BRCA2 • Responses seen across trials
PALB2: • Signals of benefit (rFS and OS) • Data limited and not always statistically significant
CDK12: • Potential benefit with PARPi + ARPI (FDA pooled analysis) • Less clear benefit with PARPi monotherapy • Interpret with caution
ATM: • No significant benefit with PARPi + ARPI • Consider alternative strategies or clinical trial enrolment
CHEK2: • No clear benefit with PARPi + ARPI • Consider alternative strategies or clinical trial enrolment
Other HRR genes: • Heterogeneous results • Limited and inconsistent data • Consider on an individual basis, preferably within clinical trials
HRR-negative: • Modest rPFS benefit with PARPi + ARPI in selected trials • No established OS benefit • Routine use requires careful patient selection and consideration of toxicity and prior therapy
Key trials contributing data:
BRCA2: PROfound MAGNITUDE TALAPRO-2 PROpel
BRCA1: PROfound MAGNITUDE TALAPRO-2 PROpel
PALB2: PROfound TALAPRO-2 PROpel
CDK12: PROpel MAGNITUDE TALAPRO-2
ATM: PROpel MAGNITUDE TALAPRO-2
CHEK2: PROpel MAGNITUDE TALAPRO-2
Other HRR genes: PROfound MAGNITUDE TALAPRO-2 PROpel
HRR-negative: PROpel TALAPRO-2
C. Michael Gibson MD@CMichaelGibson
Kaplan-Meier survival data: VOLGA event-free survival Kaplan-Meier figure
In patients with muscle-invasive bladder cancer, event-free survival at 24 months was 63.5% with perioperative #durvalumab plus neoadjuvant enfortumab vedotin as compared with 45.1% with surgery alone.
#ESMO26
https://t.co/gkrXTIxF1Z https://t.co/xDYZGlXcCh
Slide: European Urology Oncology paper header: bladder-sparing vs early RC in cT1 micropapillary
In 2006 we reported 44 patients with non-muscle-invasive micropapillary bladder cancer treated at MD Anderson. 27 got BCG. At a median 30 months, only 5 of them were disease-free with their bladder in place.
Twenty years on, we went back to the literature to ask whether that picture still holds. New meta-analysis in @EurUrolOncol
🧵1/ @SagarRPatelMD @AmandaMyersMD @UrogerliMD @JoshMeeks @Agarwal_CaB @SWilliams_MD @AndreaNecchi @LAUrology_NL @paolo_gontero @nnavai @JosephBBlack #OncSurgery #ESMO2026
available at www.sciencedirect.com
journal homepage: euoncology.europeanurology.com
eau European Association of Urology
[EUROPEAN UROLOGY ONCOLOGY journal cover thumbnail]
Clinical Outcomes of Bladder-sparing Management Versus Early Radical Cystectomy in cT1 Micropapillary Bladder Cancer: A Systematic Review and Meta-analysis
Sagar R. Patel a, Mikael Rauf a, Yimin Geng b, David Hinojosa-Gonzalez c, Joseph B. Black a, Taeweon Lee a, Amanda A. Myers d, Charles Guo e, Roger Li f, Joshua J. Meeks g, Piyush Agarwal h, Stephen Williams i, Omar Alhalabi j, Andrea Necchi k, Laura S. Mertens l, Paolo Gontero m, Neema Navai a, Ashish M. Kamat a,*
Sara Coca Membribes@scocmem
1) Trial design schema: Poster 4758P: Outcomes of patients who switched from chemotherapy · 2) Slide: Poster 4758P DISCUS trial with three authors (group photo)
Proud to share our exploratory analysis from DISCUS at #ESMO26 @BartsECMC
- 34% of patients never reached avelumab
- 3C vs 6C increased transition (74% vs 57%), with fewer PD/death events
- QoL remained stable on ICI and baseline PS was the only differentiating factor @OncoAlert https://t.co/3g5XtKzg3o
[Slide 1]
[Photo of presenter standing beside poster 4758P]
4758P
[Queen Mary University of London / Barts Cancer Institute logo] bci.qmul.ac.uk
4758P: Outcomes of patients who successfully switched from chemotherapy to avelumab in the randomised DISCUS trial
Sara Membribes, Francesca Jackson-Spence, Syed Hussain, Miguel Angel Climent, Iciar García Carbonero, Louis-Marie Dourthe, Pablo Borrega, Javier Molina-Cerrillo, Javier Puente, Pratik Das, Jahangeer Malik, Daniel Castellano, Rob Jones, Ignacio Duran, Yohann Loriot, Yue Qi Wang, Garima Priyadarshini, Charlotte Ackerman, Thomas Powles, Enrique Grande
On behalf of the DISCUS investigators
[affiliations: illegible]
Background
• Maintenance avelumab after platinum-based chemotherapy is standard of care in advanced urothelial cancer.
• A substantial proportion of patients never start planned maintenance treatment.
• Factors associated with failure to receive avelumab and the impact of the switch on quality of life (QoL) remain poorly characterised in prospective datasets.
Methods
• Exploratory, descriptive analysis from DISCUS (NCT06892860): investigator-initiated, international, randomised phase II trial.
• Randomisation to 3 (3C) or 6 (6C) cycles of gemcitabine plus cisplatin or carboplatin. Patients without progression received avelumab.
• PROs: EORTC QLQ-C30 GHS/QoL at baseline and relevant post-chemotherapy assessment (C4D1 for 3C and C7D1 for 6C). The pre- and post- immunotherapy GHS/QoL was restricted to patients who had avelumab (baseline and C7D1 for 3C and C9D1 for 6C).
[Three cycles] increased transition to avelumab
[bar chart partially obscured: 3C ...(74%) | 19 (15%) | 13 (10%); 6C ... | 40 (33%) | 12 (10%); legend: ...ce avelumab / ...ression / death / ...ity / patient / investigator decision]
Baseline characteristics: ECOG PS distinguished patients who did not proceed to receive avelumab
| Avelumab 162 (66%) | No avelumab 84 (34%) | P
Median age, years | 71.5 | 71.4 |
Age ≥65 years | 120 (74%) | 58 (69%) | 0.40
Male | 118 (73%) | 62 (74%) | 0.87
White | 146 (90%) | 75 (89%) | 0.84
Liver metastases | 29 (18%) | 17 (20%) | 0.66
ECOG PS ≥1 | 35 (22%) | 32 (38%) | 0.006
Gemcitabine-cisplatin | 73 (45%) | 30 (36%) | 0.30
Any dose delay | 94 (58%) | 39 (46%) | 0.08
Any dose reduction | 31 (19%) | 12 (14%) | 0.34
Grade 3/4 AEs, n* | 228 (63%) | 135 (37%) |
Subsequent systemic therapy | 36 (22%) | 23 (27%) |
*Multiple adverse events per patient therefore number of events used as denominator
QoL deterioration during chemotherapy identifies patients who will not reach avelumab
• GHS/QoL declined with 6C of chemotherapy but not with 3C
• Transition to avelumab was associated with stable QoL in both arms
[Bar chart, mean change in GHS/QoL from baseline: 3C + avelumab +2.0; 3C no avelumab -9.8; 6C + avelumab -4.6; 6C no avelumab -10.0; group n values illegible]
Shaded area = clinically meaningful decline (beyond -9 points). Arrow = 95% CI extending beyond the axis [rest illegible]
Patients who did not reach avelumab had poor outcomes: median PFS 3.9 and OS 7.5 months
PFS: HR 0.13 (95% CI: 0.08-0.20); legend: 3/6 cycles chemotherapy + avelumab; 3/6 cycles chemotherapy; x axis Time from Randomisation (months)
OS: HR 0.22 (95% CI: 0.13-0.35); legend: 3/6 cycles chemotherapy + avelumab; 3/6 cycles chemotherapy; x axis Time from randomisation (months)
Conclusions
• 34% of eligible patients never received avelumab, their outcomes were poor and only 27% received subsequent therapy.
• 3C increased transition to avelumab (74% vs 57%), driven by fewer progression/death events (15% vs 33%). Once avelumab started, QoL did not deteriorate further.
• Only baseline ECOG PS differed among patients who did and did not get avelumab.
[Slide 2]
[Photo of three authors standing in front of poster 4758P; same poster as the first image]
4758P
4758P: Outcomes of patients who successfully switched from chemotherapy to avelumab in the randomised DISCUS trial
Baseline characteristics: ECOG PS distinguished patients who did not proceed to receive avelumab
| Avelumab 162 (66%) | No avelumab 84 (34%) | P
Median age, years | 71.5 | 71.4 |
Age ≥65 years | 120 (74%) | 58 (69%) | 0.40
Male | 118 (73%) | 62 (74%) | 0.87
White | 146 (90%) | 75 (89%) | 0.84
Liver metastases | 29 (18%) | 17 (20%) | 0.66
ECOG PS ≥1 | 35 (22%) | 32 (38%) | 0.006
Gemcitabine-cisplatin | 73 (45%) | 30 (36%) | 0.30
Any dose delay | 94 (58%) | 39 (46%) | 0.08
Any dose reduction | 31 (19%) | 12 (14%) | 0.34
Grade 3/4 AEs, n* | 228 (63%) | 135 (37%) |
Subsequent systemic therapy | 36 (22%) | 23 (27%) |
Patients who did not reach avelumab had poor outcomes: median PFS 3.9 and OS 7.5 months
PFS HR 0.13 (95% CI: 0.08-0.20); OS HR 0.22 (95% CI: 0.13-[obscured])
[Background, Methods and Conclusions panels partly obscured by people]
Badges: Charlotte Ackerman; Francesca Jackson-Spence; Sara Coca Membribes
David H Aggen, MD PhD@Dr_Aggen
Slide: GB-4362 free-MMAE-neutralizing antibody with EV+pembrolizumab in advanced UC - trial-in-progress
A major challenge for patients on Enfortumab Vedotin for prolonged periods is mitigating neuropathy. We are actively investigating the use of a novel MMAE binder to prevent neuropathy for patients with metastatic urothelial cancer #ESMO26 @BladderCancerUS @urotoday
ESMO trial in progress poster here
MSK PI Sam Funt
https://t.co/i7qjL8QJ9w: https://t.co/YFkGPFfxUe
MSK Link: https://t.co/PYAk8CLijd
ABSTRACT #1900 / FPN ESMO CONGRESS 2026 • TRIAL IN PROGRESS • NCT07484022
A phase 1 study of GB-4362, a free MMAE-neutralizing antibody, with enfortumab vedotin and pembrolizumab in advanced urothelial cancer
Generate:Biomedicines
S. Funt(1), J. Rosenberg(2), O. Alhalabi(3), V. Szenes(4), A. Tripathi(5), K. Mayawala(4), D. De Alwis(4), L. Goyal(4), S. Straley(4), K. Zhang(6), B. Adesunloye(7), G. O'Sullivan Coyne(8), M. Devitt(9), J. Chahoud(10), H. Hassanein(11), B. Saraiya(12), C. Jiang(13)
Background
Enfortumab vedotin (EV) plus pembrolizumab is a first-line standard for locally advanced or metastatic urothelial cancer.
Systemic release of monomethyl auristatin E (MMAE) from EV contributes to off-target toxicity. Peripheral neuropathy is a key treatment-limiting toxicity of EV, reported in 67%(a) of patients in EV-302, leading to dose interruption (22%), reduction (13%), or discontinuation (15%); symptoms may persist after treatment and limit the duration and intensity of an otherwise effective regimen.
Therapeutic Concept
GB-4362 is designed to selectively bind and neutralize circulating free MMAE without binding intact EV, with the goal of reducing neuropathy and improving the therapeutic window.
Reducing treatment-related toxicities may help patients remain on EV plus pembrolizumab longer and support broader use across community and other care settings.
Phase 1 data may also inform development of GB-4362 with other MMAE-based antibody-drug conjugates, potentially extending the approach to additional cancer types.
GB-4362 has received Fast Track designation from the U.S. FDA for the prevention and/or reduction of EV-induced toxicity in patients with urothelial cancer.
Preclinical Data
In vitro, GB-4362 blocked MMAE, and not ADC cytotoxicity [curve: %viability vs Concentration mAb (nM); GB-4362 + MMAE; GB-4362 + ADC]
In mouse, EV's efficacy was preserved up to 80% MMAE reduction with GB-4362 [Tumor Volume (mm3) vs Time (day); GB-4362 administrations; Vehicle (Negative control); MMAE reduction ≥ ~85% (Postive control); No efficacy impact MMAE reduction ≤ ~80%]
In monkeys, single dose GB-4362 resulted in dose-dependent reduction in free MMAE which was associated with neutropenia improvement
Treatment | Grade 4 Neutropenia (%) | Free MMAE % (AUC0-2wk)
4mg/kg EV | 100% | 100%
4mg/kg EV + 0.5mg/kg GB-4362 | 100% | 74%
4mg/kg EV + 2mg/kg GB-4362 | 50% | 52%
4mg/kg EV + 4mg/kg GB-4362 | 33% | 32%
Grade 4 neutropenia is defined as ANC < 0.5 × 10^3 cells/µL. EV = enfortumab vedotin
Dose-escalation study design
Dose Level 1 GB-4362 → Dose Level 2 GB-4362 → Dose Level 3 (optional) GB-4362
DOSE EXPANSION: Preliminary recommended Phase 2 dose of GB-4362
- EV+Pembrolizumab administered per standard of care
- Dose Escalation (6+3 design): GB-4362 only administered in cycles 2-3.
- GB-4362 administered on same days as EV
- Target ~50% MMAE reduction using intra-patient MMAE data
Key eligibility
- Locally advanced or metastatic urothelial carcinoma with measurable disease
- Planned to receive standard of care EV plus pembrolizumab
- ECOG 0-1 (escalation); ECOG 0-2 (expansion)
- No uncontrolled diabetes
- No active untreated CNS metastases
- No grade >1 sensory or motor peripheral neuropathy
Endpoints
Primary: GB-4362-emergent AEs/SAEs incidence and severity
Secondary: PK and ADA of GB-4362. Reduction in free MMAE exposure
Study Status
Recruiting. Multiple active U.S. sites
No clinical outcome data are presented. Source: ClinicalTrials.gov NCT07484022 (updated 18 Jun 2026)
a. PADCEV® (enfortumab vedotin-ejfv) U.S. Prescribing Information. Astellas Pharma US, Inc.; revised Nov 2025. Table 7
Toni Choueiri, MD@DrChoueiri
1) Slide: Immune activation vs immune navigation framework for RCC (Braun talk) - alternate photo · 2) Slide: Neoantigen vaccine for kidney cancer: trial overview and manufacturing (Braun) - alternate · 3) Kaplan-Meier survival data: Encouraging patient outcomes (but only n = 9): neoantigen · 4) Slide: How to move vaccines to advanced RCC? Combination therapy - cancer-immunity cycle (Braun)
Exciting insights into personalized neoantigen vaccines in #RCC at #ESMO26 by @BraunMDPhD!
Despite modest TMB, RCC remains immunogenic.
Vaccines induce durable T-cell expansion & antitumor activity. Encouraging outcomes (n=9).
Combination may be key in advanced RCC: vaccines expand neoantigen-specific T cells, while IO releases immune brakes to enhance tumor killing.
@myESMO @oncoalert
[Slide 1]
Immune activation
Releasing the brakes - Immune checkpoint inhibitors
Pressing the accelerator - Novel cytokine therapies
RCC tumor
T cell immunity
Immune navigation
Clearing the traffic - Modulating T cell-extrinsic factors
Adding a steering wheel - Antigen-directed therapies
Yochum & Braun, Targeted Oncology, 2025
[Slide 2]
A neoantigen vaccine for kidney cancer
Trial overview
Tumor procurement | Target selection | Personal vaccine manufacture | Vaccine administration
ccRCC Stage III-IV; No evidence of disease (NED) after surgery
WES, RNAseq → Neoantigen prediction (HLAthena) → Identification of up to 20 personal neoantigens
Pools of synthetic long peptides (A, B, C, D)
Vaccine + poly ICLC 1/2 s.c., 1/2 i.d.
s.c. ipilimumab (+/-)
Prime, Boost, Boost; weeks 0, 4, 8, 12, 16, 20, 24; Blood collection
Successful vaccine manufacturing for all patients
No. of coding mutations; No. of peptides per vaccine
Pt. ID: 101 | 102 | 104 | 105 | 106 | 107 | 108 | 109 | 110
RCC driver mutations: PIK3CA, VHL, BAP1, KDM5C, BAP1, KDM5C, PBRM1
SNV mutations; Frameshift indel mutations
[Bra]un et al, Nature, 2025.
[Slide 3]
Encouraging patient outcomes (but only n = 9)
Swimmer plot: Pt. ID 101, 102, 105, 106, 104, 107, 109, 108, 110; Months from surgery (0, 12, 24, 36, 48)
Stage: III; IV NED
Vaccine priming; Vaccine boost; Alive & NED
Death (unrelated; NED at last follow-up) [patient 110]
Disease-free survival vs Months from first vaccination (0, 10, 20, 30, 40)
Number at risk: 9 | 9 | 8 | 5 | 2
[Bra]un et al, Nature, 2025.
Survival table
Endpoint: Disease-free survival from first vaccination
Vaccinated patients | 9
[Slide 4]
How to move vaccines to advanced RCC? Combination therapy
1. Release of cancer cell antigens (cancer cell death)
2. Cancer antigen presentation
3. Priming and activation (APCs and T cells)
4. Trafficking of T cells to tumors (CTLs)
5. Infiltration of immune cells into tumors and stroma
5a. Accumulation of activated T cells in and through stroma
5b. Interaction with immune cells (e.g., TAMs, T-regs, TLS)
5c. Maintained effector state and function
6. Recognition of cancer cells by T cells
7. Killing of cancer cells (Immune and cancer cells)
[...]shizuka, and Braun, ESMO Immuno-Oncology and Technology, 2026.
Zach Klaassen@zklaassen_md
Slide: Mechanisms of ARPI resistance in advanced prostate cancer and strategies to overcome them (Vogl, ESMO 2026)
Mechanisms of ARPI resistance in advanced PCa and examples of how to overcome them -- Ursula Vogl
A laundry list of options and ongoing work being done
#ESMO26 @urotoday https://t.co/yz4YHivRw3
Resistance mechanism | Key alterations | Strategies to overcome resistance
AR reactivation | AR amplification / overexpression; AR-LBD mutations (L702H, T878A); AR-V7 splice variant | AR degraders: BMS-986365(1); PROTAC: luxdegalutamide(2,3), bavdegalutamide(4,5); RIPTAC: HLD-0915(6)
Androgen bypass | Steroids and progestins activate mutant AR; Glucocorticoid receptor upregulation | CYP11A1 inhibition: opevesostat(7,8)
Alternative survival signaling | PTEN loss / PI3K–AKT activation | AKT inhibition: capivasertib(9), ipatasertib(10)
Epigenetic escape | EZH2 upregulation; FOXA1/GATA2 | EZH2 inhibition: mevrometostat(11)
DNA repair deficiency | BRCA2, BRCA1, ATM, other HRR genes; MSI-high / dMMR | PARP inhibitors ± ARPI(12–14); PD-1 inhibitors (MSI-high)(15)
Lineage plasticity (AR-indifferent) | TP53 / RB1 loss; Neuroendocrine transdifferentiation | Platinum-based chemotherapy; EZH2 inhibition
AR-independent targets | Surface antigens: PSMA, STEAP1, hK2, B7-H3 | PSMA radioligand: 177Lu-PSMA-617(16,17); T-cell engagers: xaluritamig(18) (STEAP1), pasritamig (hK2)(19); B7-H3 ADCs: ifinatamab deruxtecan, DB-1311(20,21)
Robinson D et al. Cell 2015; Antonarakis ES et al. N Engl J Med 2014 [rest cropped]
Dr Amol Akhade@SuyogCancer
1) Trial design schema: Which Cancers Should We Target? Peptide vaccine pipeline for RCC · 2) Slide: Which Vaccine Should We Use? Shared vs Personalized Neoantigen Strategies - Toni Choueiri · 3) Slide: Where do vaccines fit in the disease course? Early vs Advanced Setting considerations - Toni · 4) Slide: Neoantigen peptide vaccine phase 1 trial in RCC (Braun DA...Nature 2025) ACIR summary - Toni
mRNA vaccines - what medical oncologist should know?
Nice talk by @DrChoueiri @myESMO #ESMO26 . Personalized
mRNA cancer vaccines used along with existing treatment options like immunotherapy is the next frontier in cancer treatment. @OncoAlert https://t.co/n47EvAyfYC
[Slide 1]
15:15 - 16:00 What oncologists should know about mRNA vaccines
CHAIRS: YELENA JANJIGIAN, JAMES LARKIN
Which Cancers Should We Target?
Bridging from peptide vaccine trials -> mRNA vaccine development
Neoantigen Peptide Vaccine Development Pipeline for RCC
[Hand-drawn ACIR.org summary of phase 1 clinical trial, 9 patients, stage III and IV kidney cancer (RCC); small text, see 2113632411162669127_s4 for full legible version]
Randomized Phase II mRNA INTerpath-004 RCC
Key Eligibility Criteria
- Histologically or cytologically confirmed RCC with clear cell or papillary histology with or without sarcomatoid features
- Intermediate-high-risk, high-risk, or M1 NED
N ≈ 272 R (1:1)
n ≈ 136 -> V940 1 mg IM Q3W for 9 doses + Pembrolizumab 400 mg IV Q6W for 9 cycles
n ≈ 136 -> Placebo Q3W for 9 doses + Pembrolizumab 400 mg IV Q6W for 9 cycles
Stratification Factors
- Histology (clear cell vs papillary)
- Disease risk (intermediate-high vs high vs M1 NED)
End Points
- Primary: DFS by investigator assessment
- Secondary: DMFS by investigator assessment, OS, safety
Choueiri TK, et al. Oncologist, 2024
ACIR.org
Toni K. Choueiri, MD
ALICANTE AUDITORIUM - HALL 6
[Slide 2]
15:15 - 16:00 What oncologists should know about mRNA vaccines
CHAIRS: YELENA JANJIGIAN, JAMES LARKIN
Which Vaccine Should We Use?
Shared vs Personalized Neoantigen Strategies
Shared Neoantigens
Predefined antigens shared across tumors
Produced in bulk and available in advance
Rapidly available and scalable
Potentially Lower Cost
Heavily Restricted to Specific Antigens
Hybrid Solutions
Personalized Neoantigens
Tumor Sequencing-Informed Neoantigen Selection
Individual manufacturing based on neoantigen-defining algorithm
Complex Production
Tailored to cancer features
Manufacturing Delays
Toni K. Choueiri, MD
Adapted from Ott, et al. Nature Biotechnology 2026.
ALICANTE AUDITORIUM - HALL 6
[Slide 3]
15:15 - 16:00 What oncologists should know about mRNA vaccines
CHAIRS: YELENA JANJIGIAN, JAMES LARKIN
Where do vaccines fit in the disease course?
Early vs Advanced Setting considerations
Clinical benefit has been demonstrated most clearly in the adjuvant setting, while efficacy in advanced disease remains less established.
[Illustration of immune cells and tumors of increasing size]
Eliminate MRD and Prevent Recurrence | Control Disease and Prolong Survival
Lower Tumor Burden and Less Heterogeneity | Higher Burden and More Heterogeneity
High Ratio of Vaccine-Induced T-cells to Cancer Cells | TME induces Immune Suppression
Toni K. Choueiri, MD
Adapted from Baharom, et al. Nature Reviews Immunology 2025.
Created with BioRender.com
ALICANTE AUDITORIUM - HALL 6
[Slide 4]
15:15 - 16:00 What oncologists should know about mRNA vaccines
CHAIRS: YELENA JANJIGIAN, JAMES LARKIN
Braun DA...Wu, Ott, Choueiri. Nature 2025
phase 1 clinical trial
9 patients
stage III and IV kidney cancer (RCC)
tumor sample, peripheral blood
median of 45 high-quality somatic coding mutations per sample
median of 15 neoantigen peptides per sample, including
-at least 1 neoORF
-1 or more derived from common RCC or pan-cancer driver mutations in 7/9 pts
adjuvant setting
prime-boost vaccination
4 peptide pools administered half sc and half id
2.5mg sc anti-CTLA-4 close to vaccine site in 5/9 patients
median follow-up of 40 months from surgery
35 months from start of vaccination
clinical result
- well tolerated
- no cancer recurrence in 9/9 patients
ex vivo ELISpot with patient PBMCs
- reactivity against a median of 7 vaccine peptides per patient
- mostly from polyfunctional CD4+ PD-1+ CD45RO+ T cells
- response was mostly strongest after the 2nd booster
44% (50/112) of passenger mutations
86% (6/7) of common RCC mutations
65% (11/17) of other pan-cancer mutations
-> elicited an immune response (all de novo)
skin biopsies of the vaccine site (before and after priming phase)
↑ number of myeloid cells
↓ proportions of Langerhans and dendritic cells
↑ number of lymphoid cells
↑ proportions of cytotoxic CD8+ T cells and proliferating NK cells
↑ expression of effector cytokine and cytotoxicity genes
↑ unique T cell clonotypes
peripheral T cells
- identification of 98 vaccine-expanded T cell clones
- formed rapidly within 3 weeks (during the priming phase)
- present at high levels up to 166-fold
- persisted at high levels for up to 3 years
- levels of putative pre-existing tumor- and viral-specific T cell clones remained the same during treatment
reactivity against autologous tumor cells
- at least 1 peptide pool with reactivity in 7/9 patients
- reactivity against multiple RCC driver mutations
addition of anti-CTLA-4
- made no apparent difference in this study
ACIR.org
ALICANTE AUDITORIUM - HALL 6
Toni Choueiri, MD@DrChoueiri
Slide: Summary: small-cell GU neuroendocrine carcinoma of the bladder (De Santis, ESMO 2026)
Insightful talk on small cell neuroendocrine carcinoma of bladder by #MariaDeSantis.
Platinium remains the backbone. DLL3 is a promising therapeutic target.
#ESMO26 #Day2 @myESMO @OncoAlert https://t.co/gTITpXUHSW
Summary
Small-cell GU neuroendocrine carcinoma - focus on the bladder
▪ Early systemic risk
▪ Expert pathology and systemic staging are essential, even in cT1 bladder disease.
▪ Platinum remains the backbone – analogy with small cell lung cancer (SCLC)
▪ Platinum–etoposide produces 40-60% responses, but durability is limited.
▪ Localised bladder disease needs multimodal therapy
▪ Combine platinum-etoposide with radical cystectomy or definitive chemoradiotherapy.
▪ Immunotherapy in analogy with SCLC is promising option, but requires caution
▪ Bladder-specific survival benefit remains unproven. Curative use remains investigational.
▪ DLL3 is a promising therapeutic target
▪ Early activity supports biomarker-directed trials. GU efficacy and survival benefit need confirmation.
Evidence remains limited: multidisciplinary decisions and clinical-trial enrolment are central
Zach Klaassen@zklaassen_md
Trial design schema: Ongoing phase III trials in mHSPC likely to read out in the next 1-5 years
#ESMO26 Personalized Systemic Therapy for mHSPC
@AOmlin @urotoday
Select ongoing Phase III trials in mHSPC likely to read-out in the next ~1-5 yrs 👇 https://t.co/Ji1uQi9k80
Acronym | Patient Population | Intervention | Primary completion date
EvoPAR-PR01 NCT06120491 | N=1,898, mHSPC | HRR positive cohort: ADT plus ARPI ± saruparib (AZD5305) HRR negative cohort: ADT plus ARPI ± saruparib (AZD5305) | 09/2027
MEVPRO-3 NCT07028853 | N=1,000, mHSPC | enzalutamide ± mevrometostat (EZH2 inhibitor) | 09/2028
ASPIRE NCT06931340 | N=1,260, mHSPC | ADT + apalutamide ± docetaxel | 11/2031
Triple Switch NCT06592924 | N=830, mHSPC, PSA after ADT (6-12m) + ARPI (≥4m), PSA ≥0.2 | Continue ADT + ARPI vs ADT + ARPI + docetaxel | 03/2031
PEACE-6 Poor Responders EU CT 2022-502408-57-00 | N=500, synch. mHSPC ongoing SOC with PSA ≥0.2 ng/mL at 6-8m | Continuing SOC vs SOC + 4x 177Lu-PSMA-617 | 02/2033
PEACE-6 Vulnerable NCT04916613 | N=300, mHSPC, vulnerable/frail | ADT ± darolutamide | 03/2028
Oligo-PRESTO NCT04115007 | N=550, mHSPC, oligometastatic | Standard of care ± SBRT of metastases (max 5, at least one bone or lung ± nodes) | 06/2026
SWOG-S1802 NCT03678025 | N=1,273, mHSPC | Standard systemic therapy ± definitive treatment (OR or RT) of the primary tumour | 04/2033
PLATON NCT03784755 | N=409, low-volume mHSPC | SOC + local treatment of the prostate (low volume metastatic disease burden) vs. SOC + local treatment of all sites (primary and metastases) | 12/2032
DE-Escalate NCT05974774 | N=1,600, mHSPC | mHSPC treated with ADT + ARPI for 6-12 months and presenting with a PSA ≤ 0.2 ng/mL, randomised to continued vs intermittent therapy | 05/2035
LIBERTAS NCT05884398 | N=420, mHSPC | mHSPC treated with ADT + ARPI for 6 months and presenting with a PSA ≤ 0.2 ng/mL, randomised to continued apalutamide (Stop ADT) vs continue ADT + apalutamide | 10/2026
STAMPEDE-2 NCT06320067 | N=3,360, mHSPC | • Standard of care vs. SOC plus SABR (1-5 metastatic lesions: bone and/or non-regional lymph node sites) using conventional imaging • SOC vs SOC plus 177Lu-PSMA-617 | 04/2031
Toni Choueiri, MD@DrChoueiri
Response data: Poster 3602P: Clinical and transcriptomic correlates of primary resistance
Proud of our superstar fellow @elioibrahim8 presenting his work on clinical & transcriptomic correlates of primary resistance to nivo/ipi in metastatic RCC at #ESMO26!
Important work toward understanding why some patients do not respond to immunotherapy!
@myESMO @oncoalert https://t.co/rGNPMdFNJL
3602P - Clinical and transcriptomic correlates of primary resistance to nivolumab plus ipilimumab in metastatic renal cell carcinoma (mRCC)
Elio Ibrahim¹, Wanling Xie¹, Razane El Hajj Chehade¹, Neeraj Agarwal², Benoit Beuselinck³, Suzanna Lee⁴, Jae Lyun Lee⁵, Heber Reyes Garcia⁶, Connor Wells⁶, Jessica Voce⁷, Sylvan Baca¹, Rana R. McKay⁷, Andrew Simmons⁸, David Braun⁹, Daniel Y.C. Heng⁶, Toni K. Choueiri¹.
[affiliations: Dana-Farber Cancer Institute, Boston; Huntsman Cancer Institute, University of Utah; University Hospitals Leuven; Queen Elizabeth II Health Sciences Centre, Dalhousie University; Asan Medical Center, Seoul; Arthur JE Child Comprehensive Cancer Centre, Calgary; University of California San Diego, Moores Cancer Center; Exelixis, Inc., Alameda, CA; Yale Cancer Center — small print partly illegible]
BACKGROUND
• Nivolumab + ipilimumab (NIVO+IPI) is a standard first-line treatment for metastatic renal cell carcinoma (mRCC).
• Despite durable responses in many patients, >20% experience primary progressive disease (PPD) at first restaging.
• This study evaluated clinical factors and transcriptomic correlates associated with PPD.
METHODS
Clinical analysis | IMDC
1 Study population: IMDC real-world patients receiving first-line NIVO+IPI (n = 1,601).
2 Response definition: PPD = best overall response of PD per physician-assessed RECIST 1.1.
3 Statistical analysis: Multivariable logistic regression of baseline factors (evaluable n = 1,339).
Endpoint Definitions
•Time to Next-Line Therapy or Death (TNTD): Time from index date to next-line therapy or death.
•Mortality Without Next-Line Therapy (MWNT): Death before initiation of next-line therapy.
•Overall Survival (OS): Time from index date to death from any cause
Exploratory RNA-seq | COSMIC-313
1 Transcriptomic cohort: COSMIC-313 placebo + NIVO+IPI arm: 38 PPD vs 70 CR/PR (n = 108).
2 Differential expression: DESeq2 with adjustment for liver metastasis status.
3 Pathway enrichment: GSEA using MSigDB Hallmark gene sets.
Two complementary cohorts • Clinical associations and exploratory biology
@elioibrahim8 @DrChoueiri
CLINICAL RESULTS | IMDC
PPD rate: 30.4% (487/1,601 patients)
Baseline factors associated with PPD
Variable | OR (95% CI) | P value
Prior nephrectomy | 0.69 (0.54–0.88) | 0.003
Liver metastases | 1.67 (1.24–2.26) | 0.001
KPS <80% | 1.54 (1.12–2.12) | 0.007
Hemoglobin <LLN | 1.35 (1.04–1.74) | 0.023
Elevated neutrophils | 1.50 (1.09–2.06) | 0.013
Multivariable model: n = 1,339 | KPS, Karnofsky performance status; LLN, lower limit of normal
Outcomes among patients with PPD
Overall survival and subsequent-treatment outcomes
Median (95% CI), months: OS: 13.9 (12.2-16.7); TNTD: 3.6 (3.4-3.9); TEFL: 2.1 (2.1-2.3)
At Risk (0,3,6,9,12,15,18,21,24 months):
OS 487 418 344 259 215 179 142 120 104
TNTD 487 300 117 60 38 30 23 19 15
TEFL 487 130 42 18 14 11 6 6 3
Figure 1. Kaplan-Meier outcome estimates among patients with PPD.
[Figure 2: cumulative incidence — Initiating next line therapy; Death without starting next line]
At risk 487 300 117 60 38 30 23 19 15
Figure 2. Next-line therapy or death before initiating treatment.
TRANSCRIPTOMIC RESULTS | COSMIC-313
Hallmark pathways associated with primary progressive d[isease]
GSEA adjusted for liver metastasis status | All FDR q-values < 0.001
Enriched in PPD: Fatty acid metabolism; Xenobiotic metabolism; Oxidative phosphorylation; Hypoxia; Epithelial-mesenchymal transition; Glycolysis
Depleted in PPD: TNFα signaling via NF-κB (-1.81); IL6-JAK-STAT3 signaling (-1.94); Inflammatory response (-2.01); Interferon alpha response (-2.10); Interferon gamma response (-2.33); Allograft rejection (-2.49)
[enriched NES values small/partly obscured]
Figure 3. Hallmark pathway enrichment (adjusted for liver metastasis status).
Primary PD vs Responders [volcano plot; gene labels small]
Figure 4. Differential expression: primary PD versus resp[onders] [obscured]
CONCLUSION
PPD was associated with adverse clinical features [obscured by presenter] ... enriched tumor transcriptome. Findings are explo[ratory] [obscured]
Toni Choueiri, MD@DrChoueiri
1) Slide: Take Home Messages: sequential systemic therapy after EV-P in advanced urothelial cancer · 2) Slide: Sequencing in advanced urothelial cancer: navigating treatment decisions in 2026
What a start for #ESMO26 #Day2
What comes after EV-Pembro ?
Excellent overview of sequential systemic therapies in advanced #UC by #DrYohannLoriot
@myESMO @OncoAlert https://t.co/mjayR1z884
[Slide 1]
TAKE HOME MESSAGES
EV - P is the preferred first-line benchmark for suitable patients
Level of evidence is low to recommend any specific sequence
Platinum retains activity after EV-P; expected benefit is often short
FGFR3 and HER2 may open important later-line treatment options
Clinical trials ++++
Perioperative exposure is changing every metastatic sequence
[Slide 2]
Sequencing in advanced urothelial cancer:
navigating treatment decisions in 2026
1. The first-line landscape has changed
2. The post EV – pembrolizumab setting is our greatest current unmet need
3. Prior perioperative treatment is becoming a major determinant of metastatic sequencing
David H Aggen, MD PhD@Dr_Aggen
Biomarker data: Does pre-cystectomy ctDNA clearance identify a group of patients for bladder
Important caution for ctDNA-guided bladder preservation in MIBC:
Patients who clear ctDNA have better outcomes, but ~25% who convert from ctDNA+ to ctDNA− still experience progression despite cystectomy.
ctDNA clearance ≠ cure. Prospective validation is essential.
#ESMO26 @OncoAlert
Does pre-cystectomy ctDNA clearance identify a group of patients for bladder preservation?
EFS by ctDNA clearance status
Legend: C1D1 to C4D1 cleared | C1D1 to C4D1 not cleared
[KM curve: Survival probability vs Months 0-80; dashed vertical line near ~25 months with circle on cleared curve]
No. at risk (months 0, 10, 20, 30, 40, 50, 60, 70, 80):
C1D1 to C4D1 cleared: 153, 129, 110, 96, 86, 57, 23, 1, 0
C1D1 to C4D1 not cleared: 46, 21, 14, 9, 9, 4, 4, 1, 0
Survival table
Endpoint: EFS by ctDNA clearance status (C1D1 to C4D1)
C1D1 to C4D1 cleared | 153
C1D1 to C4D1 not cleared | 46
Rahul Winayak@RWinayak
1) Slide: Poster 3620P (Winayak, City of Hope): GPR65, HPK1, ENPP3, CD70 targets in mRCC — with presenter · 2) Kaplan-Meier survival data: Poster 3620P (Winayak, City of Hope): GPR65, HPK1, ENPP3, CD70
Excited to share our #ESMO26 abstract on emerging targets in mRCC. Analysis of 2,134 RCC transcriptomes identified immunogenic (GPR65/HPK1) and angiogenic (ENPP3/CD70) programs linked to improved outcomes with IO vs non-IO therapy, informing future combination strategies. https://t.co/KlshMfrKv8
[Slide 1]
[Photo of presenter standing beside poster 3620P; adjacent poster partly visible]
3620P
Genomic and phenotypic characterization of GPR65, HPK1, ENPP3 and CD70, novel targets of early phase therapeutics for metastatic renal cell carcinoma (mRCC)
Rahul Winayak(1), Nicholas J Salgia(2), Vitor Abreu de Góes(1), Ali Moradi(1), Salvador Jaime-Casas(1), Koral Shah(1), Xiaochen Li(1), Benjamin Mercier(1), Michelle Li(1), Jadon Fann(1), George Zhang(1), Ruchi Agarwal(1), Joann Hsu(1), Hedyeh Ebrahimi(3), Alexander Chehrazi-Raffle(1), Sumanta Kumar Pal(1)
(1)Department of Medical Oncology, City of Hope Comprehensive Cancer Center, Duarte, CA, USA; (2)Department of Immunology, Roswell Park Comprehensive Cancer Center, Buffalo, NY, USA; (3)Beth Israel Deaconess Medical Center, Boston, MA, USA
Background
• Ongoing trials for mRCC are investigating novel inhibitors of GPR65 and HPK1 (MAP4K1), ENPP3xCD3 T cell engagers (TCEs), and CAR-T cells targeting CD70.
Methods
• Normalized RNA-sequencing gene expression data from IMmotion151, JAVELIN Renal 101, and HCRN-GU16-260 were analyzed.
• Gene co-expression was assessed using Pearson correlation coefficients.
• Patients were stratified into high/low expressors by median gene expression within each cohort.
• TME phenotypes were defined using NMF clusters and compared using ANOVA and chi-square tests.(1)
• PFS was analyzed using KM methods.
Results: gene co-expression
GPR65 and HPK1 (MAP4K1) were co-expressed with PDCD1, CTLA4 and CD274; ENPP3 and CD70 with KDR, EPAS1 and VEGFA in IMmotion151.
[Correlation heatmap: CTLA4, TIGIT, LAG3, PDCD1, MAP4K1, PTPN22, GPR65, CD274, MTOR, HAVCR2, CD70, ENPP3, VEGFA, EPAS1, KDR]
Results: GPR65, HPK1 (MAP4K1)
GPR65 and HPK1 (MAP4K1) were more highly expressed in patients bearing an immunogenic profile, defined by NMF cluster 4 in IMmotion151, p<0.05 for both.
[Stacked bar charts: Relative Abundance of NMF clusters, GPR65high/low, MAP4K1high/low]
Increased GPR65 and HPK1 (MAP4K1) expression were associated with prolonged PFS to IO-containing regimens (HCRN-GU16-260, JAVELIN Renal 101, respectively), p<0.05.
[KM panels: PFS - Nivolumab (GPR65 High/Low); Axitinib/Avelumab (MAP4K1 High/Low); number-at-risk rows small]
Results: ENPP3, CD70
ENPP3 and CD70 were more highly expressed in patients bearing an angiogenic profile, defined by either NMF clusters 2-3 in IMmotion151, p<0.05 for both.
[Stacked bar charts: ENPP3high/low, CD70high/low]
Increased ENPP3 and CD70 expression were associated with prolonged PFS to sunitinib (IMmotion151), (p=0.057, p=0.002, respectively).
[KM panels: Sunitinib (ENPP3 High/Low); Sunitinib (CD70 High/Low)]
Conclusions
• Emerging therapeutic targets in mRCC appear to have distinct associations with either angiogenic or immunogenic subtypes of the disease.
• Given ongoing trials with small molecules, TCEs and CAR-T approaches directed at these entities, our data inform combinatorial strategies for their use in mRCC.
Correspondence rwinayak@coh.org X @RWinayak
References 1. Motzer et al., Cancer Cell. 2020 14;38(6):803-817.e4.
Abbreviations TCEs, T cell engagers; CAR-T cell, chimeric antigen receptor-T cell; TME, tumor microenvironment; PFS, progression-free survival; NFM, non-nuclear matrix factorization; IO, immunotherapy
Disclosures The presenting author does not have any financial disclosures.
[Slide 2]
3620P
Genomic and phenotypic characterization of GPR65, HPK1, ENPP3 and CD70, novel targets of early phase therapeutics for metastatic renal cell carcinoma (mRCC)
Rahul Winayak(1), Nicholas J Salgia(2), Vitor Abreu de Góes(1), Ali Moradi(1), Salvador Jaime-Casas(1), Koral Shah(1), Xiaochen Li(1), Benjamin Mercier(1), Michelle Li(1), Jadon Fann(1), George Zhang(1), Ruchi Agarwal(1), Joann Hsu(1), Hedyeh Ebrahimi(3), Alexander Chehrazi-Raffle(1), Sumanta Kumar Pal(1)
(1)Department of Medical Oncology, City of Hope Comprehensive Cancer Center, Duarte, CA, USA; (2)Department of Immunology, Roswell Park Comprehensive Cancer Center, Buffalo, NY, USA; (3)Beth Israel Deaconess Medical Center, Boston, MA, USA
Background
• Ongoing trials for mRCC are investigating novel inhibitors of GPR65 and HPK1 (MAP4K1), ENPP3xCD3 T cell engagers (TCEs), and CAR-T cells targeting CD70.
Methods
• Normalized RNA-sequencing gene expression data from IMmotion151, JAVELIN Renal 101, and HCRN-GU16-260 were analyzed.
• Gene co-expression was assessed using Pearson correlation coefficients.
• Patients were stratified into high/low expressors by median gene expression within each cohort.
• TME phenotypes were defined using NMF clusters and compared using ANOVA and chi-square tests.(1)
• PFS was analyzed using KM methods.
Results: gene co-expression
GPR65 and HPK1 (MAP4K1) were co-expressed with PDCD1, CTLA4 and CD274; ENPP3 and CD70 with KDR, EPAS1 and VEGFA in IMmotion151.
[Correlation heatmap: CTLA4, TIGIT, LAG3, PDCD1, MAP4K1, PTPN22, GPR65, CD274, MTOR, HAVCR2, CD70, ENPP3, VEGFA, EPAS1, KDR]
Results: GPR65, HPK1 (MAP4K1)
GPR65 and HPK1 (MAP4K1) were more highly expressed in patients bearing an immunogenic profile, defined by NMF cluster 4 in IMmotion151, p<0.05 for both.
[Stacked bar charts: Relative Abundance of NMF clusters, GPR65high/low, MAP4K1high/low]
Increased GPR65 and HPK1 (MAP4K1) expression were associated with prolonged PFS to IO-containing regimens (HCRN-GU16-260, JAVELIN Renal 101, respectively), p<0.05.
[KM panels: PFS - Nivolumab (GPR65 High/Low); Axitinib/Avelumab (MAP4K1 High/Low); number-at-risk rows small]
Results: ENPP3, CD70
ENPP3 and CD70 were more highly expressed in patients bearing an angiogenic profile, defined by either NMF clusters 2-3 in IMmotion151, p<0.05 for both.
[Stacked bar charts: ENPP3high/low, CD70high/low]
Increased ENPP3 and CD70 expression were associated with prolonged PFS to sunitinib (IMmotion151), (p=0.057, p=0.002, respectively).
[KM panels: Sunitinib (ENPP3 High/Low); Sunitinib (CD70 High/Low)]
Conclusions
• Emerging therapeutic targets in mRCC appear to have distinct associations with either angiogenic or immunogenic subtypes of the disease.
• Given ongoing trials with small molecules, TCEs and CAR-T approaches directed at these entities, our data inform combinatorial strategies for their use in mRCC.
Correspondence rwinayak@coh.org X @RWinayak
References 1. Motzer et al., Cancer Cell. 2020 14;38(6):803-817.e4.
Abbreviations TCEs, T cell engagers; CAR-T cell, chimeric antigen receptor-T cell; TME, tumor microenvironment; PFS, progression-free survival; NFM, non-nuclear matrix factorization; IO, immunotherapy
Disclosures The presenting author does not have any financial disclosures.
Number at risk (as printed, small):
PFS - Nivolumab: GPR65 High 36 / 22 / 11 / 8 / 1 / 0; GPR65 Low 36 / 11 / 4 / 4 / 2 / 0 (time 0/10/20/30/40/50)
Axitinib/Avelumab: MAP4K1 High 173 / 138 / 64 / 30 / 1 / 0; MAP4K1 Low 179 / 112 / 47 / 17 / 4 / 0 (time 0/5/10/15/20/25)
Sunitinib: ENPP3 High 205 / 148 / 91 / 49 / 13 / 0; ENPP3 Low 211 / 129 / 74 / 45 / 12 / 0
Sunitinib: CD70 High 209 / 148 / 98 / 59 / 15 / 0; CD70 Low 207 / 129 / 67 / 35 / 10 / 0
Toni Choueiri, MD@DrChoueiri
Biomarker data: Poster 3601P: long tail of somatic mutations in clear-cell renal cell carcinoma
Years of work in the making: superstar @BIDMChealth PGY2 @eddy_saad presents our work on the large R2000 cohort, focusing on rare genomic variants in ccRCC
@DanaFarber @BraunMDPhD @VanAllenLab
@esmo #ESMO26 @OncoAlert @DanaFarber_GU https://t.co/DPHWBWlBu7
3601P
Characterizing the long tail of somatic mutations in clear-cell renal cell carcinoma (ccRCC)
Eddy Saad, Kevin Meli, Ro Malik, Jad El Masri, Matias Vergara, Harry Kane, Renée Maria Saliby, Chris Labaki, Ziad Bakouny, Razan Mohanna, Berkay Simsek, Sabina Signoretti, Brendan Reardon, Jihye Park, Toni K. Choueiri, Eliezer M. Van Allen, David A. Braun
BACKGROUND
• Despite major therapeutic advances, precision oncology has had limited impact in the treatment of ccRCC.
• Common genomic drivers are well described, but the biological and clinical significance of rare recurrent somatic alterations remains unclear.
• We hypothesized that a large-scale harmonized multi-cohort analysis could uncover low-frequency yet clinically relevant molecular subsets.
METHODS
RESULTS
• Out of 118 SMGs, 72 occurred in fewer than 2% of tumors (long tail of mutations).
• We identified NF2 loss-of-function (LOF) mutations as a recurrent, low-frequency (2%) alteration across cohorts (a).
• NF2 LOF was associated with upregulation of proliferative pathways and downregulation of IFN-γ signaling (b).
• Clinically, NF2 LOF was associated with more aggressive disease and worse survival (c), independent of stage, sarcomatoid features, age, and treatment type (d).
• Other rare LOF alterations included:
MLH1 (0.8%) associated with increased MSI and TMB, a trend towards better outcomes with immunotherapy (IO) and worse survival with VEGF TKI.
B2M (0.6%) associated with downregulation of IFN-γ signaling.
STK11 (0.4%) associated with downregulation of immune pathways and worse outcomes with IO.
Comprehensive multi-omic profiling of large harmonized datasets can reveal clinically important subsets missed by smaller studies.
Rare genomic alterations can refine prognostic stratification and therapeutic selection in ccRCC.
Email: eddy_saad@dfci.harvard.edu
Julian Chavarriaga@chavarriagaj
1) Slide: poster figure from trial-in-progress presentation · 2) Trial design schema: poster study design figure for trial-in-progress
#ESMO26 Can we preserve the bladder with EV + P in MIBC? @tompowles1 presented the TiP: EV-209, a phase II trial exploring bladder preservation without planned RC or RT:
📌N≈240, global, single-arm study
📌 Patients eligible for but declining radical cystectomy
📌 EV+P for 4 cycles, followed by MRI/CT, cystoscopy with biopsy/TURBT, and urine cytology
📌 Patients achieving cCR continue treatment (up to 9 EV and 17 pembrolizumab cycles)
📌 Co-primary endpoints: cCR rate and 2-year bladder-intact EFS among responders
📌 Exploratory ctDNA/utDNA MRD analyses
@UroToday @myESMO
[Slide 1]
Figure 2: Active (Blue) and Planned (Gray) Sites of Enrollment for EV-209
[World map with site callouts]
Indianapolis, IN, USA - Indiana University Melvin and Bren Simon Comprehensive Cancer Center - Active
Downers Grove, IL, USA - Accelacare of Duly; Chicago, IL, USA - University of Illinois Cancer Center - Active
Farmington Hills, MI, USA - Profound Research LLC - Active
Austin, TX, USA - Urology Austin PLLC - Active; San Antonio, TX, USA - Urology San Antonio - Active
Little Rock, AR, USA - Arkansas Urology Research Center - Active
Myrtle Beach, SC, USA - START Carolinas - Active
New York, NY, USA - Laura and Isaac Perlmutter Cancer Center - NYU Langone Health - Active; Perlmutter Cancer Center - NYU Langone Hospital [illegible]; Mount Sinai Tisch Cancer Center - Planned; Mineola, NY, USA - NYU Langone Hospital - Long Island - Active
Philadelphia, PA, USA - Thomas Jefferson University - Active; Centers for Advanced Urology, LLP d/b/a MidLantic Urology - Active; Willow Grove, PA, USA - Sidney Kimmel Comprehensive Cancer - Asplundh Cancer Pavilion - Active
Sewell, NJ, USA - Sidney Kimmel Comprehensive Cancer Center - Washington Township - Active; Cherry Hill, NJ, USA - Sidney Kimmel Comprehensive Cancer Center - Cherry Hill - Active
London, UK - St Bartholomew's Hospital - Barts Health NHS Trust - Active
Herne, Germany - Marien Hospital Herne - Active
Stuttgart, Germany - Klinikum Stuttgart - Planned
Poznań, Poland - Clinical Research Center, Medic-R - Active
Tarnów, Poland - Szpital Wojewódzki im. św. Łukasza SPZOZ - Active
Rennes, France - Centre Eugene Marquis - Active
Villejuif, France - Institut Gustave Roussy - Planned
Milan, Italy - IRCCS San Raffaele Hospital - Planned
Toulouse, France - Oncopole Claudius Regaud, IUCT-Oncopole - Active
Madrid, Spain - Hospital Universitario La Paz - Active
Ourense, Spain - Complejo Hospitalario Universitario de Ourense - Active
Granada, Spain - Hospital Universitario Virgen de las Nieves - Active
Beijing, China - Chinese Academy of Medical Sciences and Peking Union Medical College - Planned; Cancer Hospital, Chinese Academy of Medical Sciences - Planned
Goyang-si, South Korea - National Cancer Center - Active
Bundang-gu, South Korea - Seoul National University Bundang Hospital - Active
Seoul, South Korea - Seoul National University Hospital - Active; Asan Medical Center (AMC) - Active; Ewha Womans University Mokdong Hospital - Active; Korea University Anam Hospital - Active; Seoul St. Mary's Hospital - Active; Samsung Medical Center - Active
Gwangju, South Korea - Chonnam National University Hwasun Hospital - Active
Daegu, South Korea - Kyungpook National University Chilgok Hospital - Active
Gifu, Japan - Gifu University Hospital - Active
Tsukuba, Japan - University of Tsukuba Hospital - Active
Tokyo, Japan - Institute of Science Tokyo Hospital - Active; Tokyo Metropolitan Komagome Hospital - Active; Cancer Institute Hospital of JFCR - Active
Kawasaki, Japan - St. Marianna University Hospital - Active
Kobe, Japan - Kobe City Medical Center General Hospital - Active
Kyoto, Japan - Kyoto University Hospital - Active
Osaka, Japan - Osaka Metropolitan University Hospital - Active
Ube, Japan - Yamaguchi University Hospital - Active
Southport, Australia - Tasman Oncology Research - Active
Melbourne, Australia - Austin Health - Planned
[Slide 2]
Figure 1: EV-209 Study Design
Patient population (N≈240)
↓
EV 1.25 mg/kg IV Q3W on Days 1 and 8
P 200 mg IV Q3W on Day 1
(4 cycles; 21-day cycles)
↓
Disease assessments
• MRI or CT
• Cytoscopy + biopsy
cCR achieved → EV 1.25 mg/kg IV Q3W on Days 1 and 8 (5 cycles; 21-day cycles)
P 200 mg IV Q3W on Day 1 (≤13 cycles; 21-day cycles) → Post-treatment follow-up • Safety, efficacy, OS (≤5 years)
No cCR achieved ↔ For clinical downstage only (≤T2): EV 1.25 mg/kg IV Q3W on Days 1 and 8; P 200 mg IV Q3W on Day 1 (≤5 cycles; 21-day cycles) → Repeat disease assessment (≤9 cycles; 21-day cycles) → cCR achieved → P 200 mg IV Q3W on Day 1 (≤8 cycles; 21-day cycles) → Post-treatment follow-up
Optional (based on investigator's decision)
No cCR achieved → RC or SoC treatment based on local standard practice → Post-treatment follow-up
Toni Choueiri, MD@DrChoueiri
1) Slide: Title slide: plasma KIM-1 dynamics during 1L IO +/- cabozantinib in advanced RCC · 2) Slide: KIM-1 in advanced RCC summary slide (Wenxin Xu, ESMO 2026)
Superb presentation by our very own @DanaFarber_GU @VincentWenxinXu! COSMIC-313: a ≥30% plasma KIM-1 decline at week 3 on nivo/ipi was associated with median PFS of 41.6 vs 8.3 months without that decline. An early blood-based window into treatment response! #ESMO26 @oncoalert @myESMO @DanaFarber
[Slide 1]
MADRID 2026 ESMO congress
Plasma Kidney Injury Molecule-1 Dynamics During First-Line Immunotherapy With or Without Cabozantinib in Advanced Renal Cell Carcinoma
Wenxin Xu,1,a Habib Hamidi,2,a Robert J. Motzer,3 Thomas Powles,4 Laurence Albiges,5 Marc Machaalani,6 Christian Scheffold,7 Saurabh Gupta,8 Venu Valmeekam,2 Toni K. Choueiri,1 Bradley A. McGregor,6 Andrew Simmons2
1Department of Medical Oncology, Dana-Farber Cancer Institute, Brigham and Women's Hospital and Harvard Medical School, Boston, MA, USA; 2Translational Medicine, Exelixis, Inc., Alameda, CA, USA; 3Department of Medical Oncology, Memorial Sloan Kettering Cancer Center, New York, NY, USA; 4Department of Medical Oncology, Barts Cancer Institute, Cancer Research UK Experimental Cancer Medicine Centre, Queen Mary University of London, Royal Free National Health Service Trust, London, UK; 5Department of Cancer Medicine, Institut Gustave Roussy, Université Paris Saclay, Villejuif, France; 6Department of Medical Oncology, Dana-Farber Cancer Institute, Boston, MA, USA; 7Clinical Development, Exelixis, Inc., Alameda, CA, USA; 8Translational Development, Solid Tumor Oncology, Translational Medicine, Bristol Myers Squibb, Princeton, NJ, USA
aCo-primary authors
[Slide 2]
Summary
How a Blood Biomarker Predicts Treatment Benefit in Kidney Cancer
Scientific Insight: KIM-1 reflects biologically distinct RCC states
Clinical Relevance: Early KIM-1 change may predict benefit from dual IO therapy
Development Strategy: Biomarker-driven escalation with TKI in patients with IO-resistant biology
Potential Impact: • Biomarker-informed trial design • Precision treatment • Increased probability of response
IO, immuno-oncology; KIM-1, kidney injury molecule-1; RCC, renal cell carcinoma; TKI, tyrosine kinase inhibitor.
Slide: Poster 3624P: PCSK9 inhibitor evolocumab + nivolumab in refractory
Join me at posters #ESMO26 @myESMO - presenting investigator initiated trial #BOOSTRCC PCSK9 inhibitor evolocumab + nivo in IO refractory #kidneycancer. Grant supported & pt who benefited had higher spread HLA expression after tx.
@oncoalert @tonichoueiri @montypal @albigesL https://t.co/UUrR5CIfSw
[Poster board number] 3624P
[ESMO Congress Madrid Spain 23-27 October 2026 logo] FPN: 3624P
PCSK9 inhibitor evolocumab combined with nivolumab in refractory metastatic renal cell carcinoma: Stage I analysis of BOOST-RCC
Tian Zhang1, Rebecca Slack Tidwell2, Qian Qin1, Lauren Wood2, Amy Rowell1, Molly McGuire1, Navneet Kaur1, Caroline S. Greenstone1, Wadih Issa1, Shahed Abdullah1, Zhongya Wang2, Hans Hammers1, James Brugarolas1, Andrew Hahn2, Amishi Shah2, Pavlos Msaouel2, Nizar Tannir2, Andrew Wang1, Eric Jonasch2
1Harold C Simmons Comprehensive Cancer Center, Department of Internal Medicine, UT Southwestern Medical Center, Dallas, TX; 2Department of Genitourinary Oncology, MD Anderson Cancer Center, Houston, TX
Background
• Despite advancements in the treatment of metastatic renal cell carcinoma (mRCC), there are few treatments in the immunotherapy (IO) refractory setting.
• Preclinical studies have shown that PCSK9 inhibition combined with IO stunt tumor growth in multiple solid tumor models by downregulating MHC-1 expression and tumor antigen presentation, independent on its effect on cholesterol (Figure 1).1
• PCSK9 inhibition combined with IO has been shown to improve overall survival in patients with metastatic solid tumors (Figure 2).2
• We conducted an investigator-initiated trial combining PCSK9 inhibitor evolocumab with IO nivolumab in IO-refractory mRCC, BOOST-RCC (NCT06284564).
Figure 1 [PCSK9 pathway diagram]
Figure 1. Depiction of PCSK9 pathway for MHC-I expression1. MHC-1 is degraded in presence of PCSK9. When PCSK9 is absent or inhibited, MHC-1 is recycled, resulting in higher tumor antigen presentation and T-cell activation.
Figure 2 [KM plot: Overall survival, PCSK9 users vs Statin users; Log-rank P=.006; numbers at risk small, illegible]
Figure 2. Overall survival in patients with metastatic cancer receiving IO combined with either PCSK9 inhibitors vs statins.2
Methods
• BOOST-RCC is an investigator-led, phase 2 clinical trial which enrolled patients at MD Anderson and UT Southwestern between June 2024 and February 2025.
• A Simon 2-stage design was used with 10 patients in the first cohort. Stage 1 would be passed if >1/10 patients had an objective response.
• Patients were treated with evolocumab, a PCSK9 inhibitor, and nivolumab every 4 weeks and median follow up was 18 months.
• Circulating tumor cells (CTCs) were captured on a dendrimer-based device3, and HLA detected by cell surface immunofluorescence at baseline and on-treatment timepoints. Plasma PCSK9 and cytokines were measured via Multiplex ELISA. LDL and cholesterol were measured as standard of care testing.
• Paired, two-tailed t-tests with Welch corrections were performed. All timepoints were compared to baseline.
Table 1. Baseline patient characteristics. N=10; Age (median, range) 67 (56.5, 69.5); [remaining rows small/partially obscured — illegible]
Figure 3 [Best percentage change in target lesions, waterfall — values illegible]
Figure 4 [Treatment and follow-up by patient, swimmer plot — illegible]
[Center text obscured by presenter]
Correlative Findings
Figure 6 [HLA ratio plots A-F; illegible]
Figure 7 A) LDL B) Cholesterol [C1, C2, EOT]
Figure 7. Correlative LDL and cholesterol levels on treatment. As expected, PCSK9 inhibition led to decrease in LDL (A) and cholesterol (B) from baseline to on treatment. Asterisks represent significance.
Figure 6. HLA expression detected on CTCs for all 10 patients (A-C) and Patient 9 with stable disease. (D-F). HLA expression was measured as ratio to PanCK, DAPI, and total expression on CTCs.
Figure 8 A) PCSK-9 B) MCP-1/CCL2 C) TNFα D) CCL4 E) IL-10 [C1, C2, C3, EOT, Follow up]
[Figure 8 legend partially obscured] ...Cytokine levels including PCSK9. Observed ...centrations of PCSK9 increase on treatment (A). ...icant cytokine changes include MCP-1/CCL2 ...C), CCL4 (D) and IL-10 (E). Asterisks: statistical...
Conclusions
• In the BOOST-RCC trial, 9 of 10 patients experienced progression of disease.
• One patient (patient 9) with multiple lines of prior treatment had stable disease for 14 months, with a 16% decrease in target lesions and on-target effect of increased HLA expression on CTCs.
• The most common related grade 3 adverse events were fatigue (1) and elevated AST(1). There were no trial limiting toxicities.
• Evolocumab combined with nivolumab had on-target effects with significant decrease in plasma LDL and cholesterol and significant increase of plasma PCSK9 on treatment.
• Given no objective response to PCSK9 and nivolumab in this first stage population, this trial was stopped for further recruitment. This highlights heterogeneity of IO resistance in IO-refractory mRCC.
References [partially obscured; illegible]
Disclosures TZ: [small text, illegible]
Twitter/X: @tiansterzhang | Email: tian.zhang@utsouthwestern.edu
Presented at ESMO Annual Congress 2026 | October 23, 2026 | Madrid, Spain
[Slide 1]
Study Design
• This is an open-label, single arm , phase Ib/II trial to evaluate the efficacy and safety of Ivonescimab monotherapy as first-line treatment for favourable risk advanced renal cell carcinoma (aRCC)
Key eligibility criteria
• Histologically or cytologically confirmed RCC with mainly clear cell carcinoma with advanced disease
• IMDC favourable risk (IMDC score 0)
• No prior systemic therapy
• ECOG PS 0-1
Ivonescimab 20mg/kg Q3W N=3~6
Ivonescimab 30mg/kg Q3W N=3~6
→ Ivonescimab 30mg/kg Q3W (N=30)
No DLT was observed. RP2D of ivonescimab was 30 mg/kg Q3W.
Primary endpoint: ORR
Secondary endpoints: PFS, OS, DCR, DoR, TTR, safety
PFS, progression-free survival; OS, overall survival; ORR, overall response rate; DCR, disease control rate; DoR, duration of response; TTR, time to response; DLT, dose limiting toxicity; RP2D: Recommended Phase 2 Dose; Q3W, Every 3 Weeks;
Jun Guo, MD
[Slide 2]
Efficacy-PFS
• Median follow-up was 13.3 months
• The median PFS was not reached. The 12-month and 24-month PFS rates were 85.5% and 55.4%, respectively
• No deaths have occurred to date
12m-rate 85.5%
24m-rate 55.4%
Follow-up time (months)
AK112
At risk | 23 | 22 | 18 | 14 | 9 | 7 | 5 | 2 | 1 | 0
Censored | 0 | 0 | 3 | 6 | 11 | 11 | 12 | 15 | 16 | 17
Events | 0 | 1 | 2 | 3 | 3 | 5 | 6 | 6 | 6 | 6
Jun Guo, MD
Data cutoff date: July 14, 2026
Survival table
Endpoint: PFS
Ivonescimab (AK112) | 23 | not reached
Landmark rates:
12 months: Ivonescimab (AK112) 85.5%
24 months: Ivonescimab (AK112) 55.4%
[Slide 3]
Conclusions
➢ Ivonescimab monotherapy demonstrated promising antitumor activity in patients as first line treatment with IMDC favorable-risk aRCC, and further follow-up for survival endpoints is ongoing.
• ORR was 65.2%, and DCR was 95.7%.
• The median PFS was not reached.
• The 12-month and 24-month PFS rates were 85.5% and 55.4%, respectively.
➢ Ivonescimab monotherapy showed a manageable safety profile.
• The majority of TRAE were grade 1-2, and grade ≥3 TRAEs only occurred in 7 (26.9%) patients.
➢ Ivonescimab monotherapy could be a potentially safe and effective treatment strategy for patients with favorable-risk aRCC
Jun Guo, MD
Zach Klaassen@zklaassen_md
1) Kaplan-Meier survival data: STAMPEDE Decipher risk group: distant metastasis cumulative · 2) Kaplan-Meier survival data: STAMPEDE Decipher risk group: prostate cancer-specific mortality · 3) Slide: STAMPEDE treatment x Decipher interaction for distant metastasis, All vs N0 (ESMO 2026) · 4) Slide: Decipher prognostic value in real-world NCCN high/very-high risk prostate cancer: DM, MFS, OS
Transcriptome classifier risk strat and intensification with ARPIs for clinically VHR PCa @urotoday #ESMO26
🚨STAMPEDE Abi trial (n=401); RWD cohort of NCCN high/very high risk PCa (n = 27,607)
🚨STAMPEDE - Decipher HR: ⏫DM, ⏬PCSS
🚨Decipher HR: Predictive of Abi benefit in STAMPEDE N0 pts (p-int: 0.01)
🚨Decipher: prognostic in RWD for DM, MFS, OS
Response data: Poster FPN 2265P: ctDNA correlates of resistance to 177Lu-PSMA-617 in mCRPC
Exciting work from our own @DanaFarber_GU stars @PrafulRavi1 and @aloktewar!
Promising ctDNA analysis in #mCRPC treated with ¹⁷⁷Lu-PSMA-617:
• Baseline tumor fraction is prognostic
• Genomic alterations linked to resistance
• Acquired resistance is heterogeneous
Closer toward biomarker-guided radioligand therapy!
@DanaFarber_GU @DanaFarber @myESMO @OncoAlert #ESMO26
Elegant talk by @MattGalsky looking at molecular drivers and subtypes in relation to treatment benefit in #NIAGARA
#ESMO26 #Day2 @myESMO @OncoAlert https://t.co/nlzwm0f57T
[Slide 1]
NIAGARA: Background
- Muscle-invasive bladder cancer (MIBC) is molecularly heterogeneous, with recurrent alterations in cell-cycle regulation, receptor tyrosine kinase signalling, chromatin remodelling, and DNA damage response (DDR) pathways, alongside high genomic instability. In multiple studies, DDR alterations have been associated with improved response to cisplatin-based neoadjuvant chemotherapy (NAC)1-3
- Transcriptomic-based molecular subtypes further shape prognosis and treatment response by reflecting differences in differentiation state, stromal and immune contexture, and underlying biology4
- NIAGARA is a Phase 3, open-label, randomised trial assessing perioperative durvalumab plus NAC and radical cystectomy (RC) vs NAC and RC alone in patients with MIBC5
- Results from the interim analyses demonstrated that the addition of perioperative durvalumab to NAC resulted in statistically significant improvements in event-free survival (hazard ratio [HR] 0.68) and overall survival (HR 0.75), and a 10% improvement in pathological complete response rate vs NAC5
Here, we report exploratory analyses of MIBC molecular drivers and subtypes in relation to treatment benefit from NIAGARA
1. Geynisman DM, et al. J Clin Oncol. 2025;43:1113-1122. 2. Miron et al. Eur Urol Oncol. 2020;3:544-547. 3. Liu D, et al. Jama Oncol. 2016;2:1094-1096. 4. Robertson AG, et al. Cell. 2017;171:540-556.e25. 5. Powles T, et al. N Engl J Med. 2024;391:1773-1786.
[Slide 2]
NIAGARA: Conclusions
- Baseline WES and RNA-seq captured the landscape of key mutational drivers and transcriptome-based subtypes, characteristic of MIBC
- Consistent with cisplatin sensitivity, DDR-related gene alterations (eg, ERCC2) were significantly associated with a higher pCR rate across arms
- Exploratory integrated baseline genomics and transcriptomics from NIAGARA suggest a broad benefit for perioperative durvalumab plus NAC in patients with MIBC
- Shared biology associated with sensitivity to immunotherapy was observed across molecular subtypes of MIBC and was enriched in the basal squamous and luminal infiltrated subtypes, which appeared to derive the most benefit with the addition of perioperative durvalumab to NAC
Exploratory analyses show the addition of perioperative durvalumab to NAC consistently improves EFS across a diverse molecular landscape
Scan the QR code to access:
- Slide presentation
- Plain language summary
We are also presenting data on the UC with DDHS subgroup from NIAGARA - please see poster: 4764P
Outcomes in Patients With Muscle-Invasive Bladder Cancer With Divergent Differentiation or Histologic Subtypes From NIAGARA
DDHS, divergent differentiation or histological subtype; DDR, DNA damage response; EFS, event-free survival; MIBC, muscle-invasive bladder cancer; NAC, neoadjuvant chemotherapy; pCR, pathological complete response; UC, urothelial carcinoma; WES, whole-exome sequencing.
Karine Tawagi MD@DrKarineTawagi
1) Slide: REPRINT - MeetURO 4/25 title slide (Procopio) · 2) Trial design schema: REPRINT study design: pembrolizumab + EV in CDC/RMC, Simon two-stage · 3) Response data: REPRINT results: ORR 22% (2/9), DCR 55%, mPFS 5.2 mo in CDC/RMC · 4) Slide: Photo of presented conference slide
Incredible to see work on the very rare RCC subtypes: collecting duct & renal medullary CA at #ESMO26
#REPRINT trial testing EV + P
🎯 22% ORR & 55% DCR overall ➡️ moving to stage 2!
Also very impt trials from @PavlosMsaouel in RMC on: ubamatamab, Sac-TMT, panitumumab… https://t.co/Gr4f7WjZmb
[Slide 1]
Enfortumab Vedotin plus Pembrolizumab in collecting duct and renal medullary carcinoma (REPRINT – MeetURO 4/25 trial). Preliminary results from Simon's first stage (NCT06302569)
Giuseppe Procopio, MD
Genitourinary Medical Oncology
Prostate Program
Fondazione IRCCS Istituto Nazionale dei Tumori
Milan, Italy
25th Oct 2026
[Slide 2]
REPRINT Study Design
Key Eligibility criteria
• Histologically confirmed diagnosis of CDC and RMC (central pathology review required)
• Metastatic or advanced disease with measurable lesions according to RECIST 1.1
• ECOG PS 0-1
N of Patients = 23
Pembrolizumab 200 mg IV q21 + Enfortumab Vedotin 1,25 mg/kg 1,8q21 → X 3 cycles → Pembrolizumab 200 mg q21 until progression, unacceptable toxicity or 24 months*
*Patients who will experience PD RECIST v1.1 during Pembrolizumab monotherapy could re-start Enfortumab Vedotin
Simon's two stage optimal design
I stage: 2/9 responses required
II stage: 6/14 responses required
Primary endpoint: ORR
Secondary endpoints: PFS, OS and safety profile
[abbreviation footnote, too small to read: illegible]
Giuseppe Procopio
[Slide 3]
REPRINT Results
OBJECTIVE RESPONSE 22% ORR (2/9 pts) 2/2 RCCU-MP vs 0/7 CDC
DISEASE CONTROL 55% DCR (5/9 pts) 2 PR + 3 SD
PROGRESSION-FREE SURVIVAL 5.2 mo Median PFS 95% CI: 3.4–NR
SAFETY PROFILE 0% Grade 3–4 AEs All pts received 3 cycles P+EV
RCCU-MP Cohort (n=2) 100% ORR
• Patient 1: Complete Response (CR) in lung disease; Stable Disease (SD) in nodal sites.
• Patient 2: Partial Response (PR) in lung disease.
Pie: PR 22% | SD 33% | PD 45%
CDC Cohort (n=7) 0% ORR
• No objective responses observed (0/7 pts).
• Disease Control Rate (DCR) achieved in 3/7 pts (SD).
Giuseppe Procopio
[Slide 4]
Conclusion
• Pembrolizumab + Enfortumab Vedotin demonstrated preliminary antitumor activity in RMC and CDC, meeting the prespecified criteria to proceed beyond the first stage of Simon's two-stage design in the REPRINT trial
• Patients with SMARCB1-deficient RMC not associated with sickle hemoglobinopathies derived promising benefit from the study combination
• The study is ongoing and continue to recruit (NCT06302569), with biological samples being collected for traslational analyses
Giuseppe Procopio
[Slide 1]
16:15 - 17:45 Emerging therapeutic strategies in advanced prostate cancer
CHAIRS: ANA APARICIO, AURELIUS OMLIN
KLK2 × CD3 T-cell engager: pasritamig
174 patients (phase 1)
42.4% PSA50 at RP2D
Stein et al. J Clin Oncol 2025 — pasritamig (JNJ-78278343)
First-in-class KLK2 × CD3 bispecific. RP2D: 3.5 mg day 1, 18 mg day 8, 300 mg day 15, then every 6 weeks. Largest T-cell-engager dataset in prostate cancer to date.
[Waterfall plot of PSA change]
Table: All-Treated Population (SC/IV) N=174 | RP2D Safety Population (IV Only) N=45
Participants with ≥1 TRAE, n (%): 144 (82.8) | 27 (60.0)
Serious TRAEs, n (%): 12 (6.9) | 2 (4.4)a
Grade ≥3 TRAEs, n (%): 17 (9.8) | 2 (4.4)
TRAEs leading to treatment discontinuation, n (%): 1 (0.6) | 0
KLK2 is more prostate-restricted than PSMA, which may widen the therapeutic window.
Stein MN et al. J Clin Oncol 2025;43:2515-2526 (pasritamig).
Niven Mehra — Emerging immune-based therapies
BILBAO AUDITORIUM - HALL 3
[Slide 2]
16:15 - 17:45 Emerging therapeutic strategies in advanced prostate cancer
CHAIRS: ANA APARICIO, AURELIUS OMLIN
STEAP1 × CD3 T-cell engager: xaluritamig [antibody schematic: Fab, CD3 scFv, Fc]
Kelly et al. Cancer Discov 2024 — xaluritamig (AMG 509)
STEAP1 × CD3, XmAb 2+1 immune therapy, mCRPC.
[Waterfall plot of PSA change; legend and axis labels illegible]
Safety: CRS in 72% (grade ≥3 in 2%), largely confined to cycle 1 under step-up dosing
Off-tumor on-target MSK events common and well managed by NSAIDs, steroids
Why STEAP1 matters
STEAP1 (six-transmembrane epithelial antigen of the prostate 1) is associated with proliferation and metastatic potential
Broadly expressed, including in AR-indifferent and neuroendocrine disease; retained as the AR axis is exhausted.
[IHC images: PSMA, STEAP1]
STEAP1 staining detected in 87.7% of evaluable matched mCRPC tissues
Patient-level analysis: STEAP1 expression in 95% of patients compared to 68% for PSMA
Kelly WK et al. Cancer Discov 2024;14:76-89 (xaluritamig phase 1).
Niven Mehra — Emerging immune-based therapies
BILBAO AUDITORIUM - HALL 3
[Slide 3]
16:15 - 17:45 Emerging therapeutic strategies in advanced prostate cancer
CHAIRS: ANA APARICIO, AURELIUS OMLIN
CAR-T in prostate cancer: 3 recent phase 1 trials
PSCA-CAR T: Second-generation 4-1BB/CD3ζ CAR, ± lymphodepletion. Dorff, Nat Med 2024 [construct schematic - City of Hope; labels illegible]
BPX-601 GoCAR-T + rimiducid: First-generation CD3ζ CAR + rimiducid-inducible MyD88/CD40 · Stein, Nat Commun 2024 [construct schematic; labels illegible]
P-PSMA-101 · stem-memory CAR: Second-generation (Centyrin binder + 4-1BB), piggyBac, iCasp9 off-switch · Slovin, CCR 2026 [construct schematic; labels illegible]
Recognition has been established; persistence and the therapeutic window are not. In prostate cancer, CAR-T remains at proof-of-concept stage.
Dorff TB et al. Nat Med 2024;30:1636–44 (NCT03873805) · Stein MN et al. Nat Commun 2024 (NCT02744287) · Slovin SF et al. Clin Cancer Res 2026;32:3540–51 (NCT04249947).
Niven Mehra — Emerging immune-based therapies
BILBAO AUDITORIUM - [HALL 3, partly obscured]
Yu-Wei Chen, MD, MS@YuWeiChenMD
Slide: Antonarakis: Conclusions — clonal hematopoiesis vs tumor HRR alterations in liquid biopsy, PARPi
Important data from #ESMO2026 in #mCRPC:
🧬 56% of HRR alterations detected by liquid biopsy were predicted to originate from clonal hematopoiesis (CH).
⚠️ Patients with CH-only HRR alterations did not appear to benefit from PARPi monotherapy.
Distinguishing CH from tumor-derived mutations is critical for treatment selection. #ProstateCancer @EAntonarakis @urotoday @PCF_Science @OncoAlert
CONCLUSIONS
• There is a high prevalence of predicted CH among HRR gene mutations in liquid-biopsy samples (56% overall), including in BRCA1 (32%) and PALB2 (24%).
• Patients with predicted CH-only HRR alterations do not appear to benefit from PARPi monotherapy, highlighting the importance of accounting for HRR mutation origin in therapy selection.
• Some CH-predicted mutations are enriched in samples after PARPi exposure, including TP53, NF1, pTERT and CBL.
Emmanuel S. Antonarakis, MD
Emmanuel Antonarakis
Distinguishing clonal hematopoiesis (CH) from tumor homologous recombination repair (HRR) alterations in liquid biopsy: Implications for PARP inhibitor (PARPi) use in metastatic castration-resistant prostate cancer (mCRPC)
Toni Choueiri, MD@DrChoueiri
Kaplan-Meier survival data: STAMPEDE Decipher score and distant metastasis risk in RWD high/very
Excellent presentation by Sarah Howlett! STAMPEDE biomarker analysis: higher Decipher scores predicted greater abiraterone benefit in preventing distant metastases in very high-risk M0 prostate cancer. A step toward smarter intensification! @myESMO #ESMO26 @oncoalert https://t.co/HPxAYiLldL
Decipher score identifies RWD cases at higher distant metastasis risk
Left panel: RWD:NCCN high risk | Right panel: RWD:NCCN very high risk
Y-axis: Distant metastasis (%) (0-50); X-axis: Years since randomisation (0-8)
Number at risk (% distant metastasis) - RWD:NCCN high risk:
GC > 0.85: 2230 | 982 (9%) | 52 (14%) | 15 (16%)
GC 0.61-0.85: 1565 | 745 (4%) | 43 (5%) | 21 (5%)
GC ≤ 0.60: 1402 | 659 (2%) | 54 (3%) | 23 (5%)
Number at risk (% distant metastasis) - RWD:NCCN very high risk:
GC > 0.85: 517 | 191 (25%) | 10 (29%) | 4 (36%)
GC 0.61-0.85: 157 | 76 (7%) | 6 (10%) | 2 (10%)
GC ≤ 0.60: 85 | 40 (9%) | 2 (12%) | 1 (12%)
Decipher risk group: GC ≤ 0.60 (blue) | GC 0.61 - 0.85 (red) | GC > 0.85 (purple)
Sarah Howlett
Survival table
Endpoint: Distant metastasis cumulative incidence by Decipher (GC) risk group, real-world data
NCCN high risk, GC > 0.85 | 2230
NCCN high risk, GC 0.61-0.85 | 1565
NCCN high risk, GC ≤ 0.60 | 1402
NCCN very high risk, GC > 0.85 | 517
NCCN very high risk, GC 0.61-0.85 | 157
NCCN very high risk, GC ≤ 0.60 | 85
Landmark rates:
at-risk column 2 (year not explicitly printed): NCCN high risk, GC > 0.85 9% | NCCN high risk, GC 0.61-0.85 4% | NCCN high risk, GC ≤ 0.60 2% | NCCN very high risk, GC > 0.85 25% | NCCN very high risk, GC 0.61-0.85 7% | NCCN very high risk, GC ≤ 0.60 9%
at-risk column 3 (year not explicitly printed): NCCN high risk, GC > 0.85 14% | NCCN high risk, GC 0.61-0.85 5% | NCCN high risk, GC ≤ 0.60 3% | NCCN very high risk, GC > 0.85 29% | NCCN very high risk, GC 0.61-0.85 10% | NCCN very high risk, GC ≤ 0.60 12%
at-risk column 4 (year not explicitly printed): NCCN high risk, GC > 0.85 16% | NCCN high risk, GC 0.61-0.85 5% | NCCN high risk, GC ≤ 0.60 5% | NCCN very high risk, GC > 0.85 36% | NCCN very high risk, GC 0.61-0.85 10% | NCCN very high risk, GC ≤ 0.60 12%
Toni Choueiri, MD@DrChoueiri
1) Slide: Title slide: plasma KIM-1 dynamics during 1L IO +/- cabozantinib in advanced RCC · 2) Slide: KIM-1 baseline levels vs IMDC risk, prior nephrectomy and tumor burden · 3) Slide: Early KIM-1 decrease predicts outcome in N+I arm: PFS/OS KM by >30% vs <=30% KIM-1 decrease
Our @DanaFarber_GU own @VincentWenxinXu on KIM-1 as applied to COSMIC-313 1L metastatic ccRCC!
#ESMO26 @OncoAlert https://t.co/JgpBpw1ahO
[Slide 1]
MADRID 2026 ESMO congress
Plasma Kidney Injury Molecule-1 Dynamics During First-Line Immunotherapy With or Without Cabozantinib in Advanced Renal Cell Carcinoma
Wenxin Xu,1,a Habib Hamidi,2,a Robert J. Motzer,3 Thomas Powles,4 Laurence Albiges,5 Marc Machaalani,6 Christian Scheffold,7 Saurabh Gupta,8 Venu Valmeekam,2 Toni K. Choueiri,1 Bradley A. McGregor,6 Andrew Simmons2
aCo-primary authors
[affiliations as on title slide: Dana-Farber Cancer Institute; Exelixis, Inc.; Memorial Sloan Kettering Cancer Center; Barts Cancer Institute; Institut Gustave Roussy; Bristol Myers Squibb]
[Slide 2]
Higher Baseline KIM-1 Levels Are Associated With IMDC Poor-Risk Disease, Absence of Prior Nephrectomy, and Greater Tumor Burden
IMDC Risk: Wilcoxon, P = 1e-10 (Intermediate vs Poor; KIM-1 (pg/mL))
Prior Nephrectomy: Wilcoxon, P < 2.2e-16 (No vs Yes; KIM-1 (pg/mL))
Radiographic Tumor Burden: R = 0.58, P < 2.5e-16 (Week 1 KIM-1 (pg/mL) vs Sum of diameters at week 1)
Box plots depict median values with interquartile ranges.
IMDC, International Metastatic Renal Cell Carcinoma Database Consortium; KIM-1, kidney injury molecule-1.
[Slide 3]
Early KIM-1 Decrease Is Predictive of Clinical Outcome in IO Arm (N+I)
Key Finding:
• A >30% decrease at week 3 strongly predicts PFS, OS, and ORR (59% vs. 31%) with N+I
• Under triplet therapy, this threshold does not stratify outcomes, indicating distinct biology
Distribution by Arm (Density vs Percent Change from W1D1 to W4D4; Treatment: C+N+I, N+I; 30% Decrease line)
Placebo + Nivolumab + Ipilimumab (N+I)
PFS: HR 0.46 (95% CI, 0.33–0.64); N+I >30% Decrease (n=109); N+I ≤30% Decrease (n=212); P < 0.0001
OS: HR 0.55 (95% CI, 0.38–0.78); N+I >30% Decrease (n=109); N+I ≤30% Decrease (n=212); P = 0.00081
Cabozantinib + Nivolumab + Ipilimumab (C+N+I)
PFS: HR 0.83 (95% CI, 0.58–1.19); C+N+I >30% Decrease (n=246); C+N+I ≤30% Decrease (n=68); P = 0.31
OS: HR 1.01 (95% CI, 0.69–1.47); C+N+I >30% Decrease (n=246); C+N+I ≤30% Decrease (n=68); P = 0.96
Median follow up 45.0 months. CI, confidence interval; D, day; HR, hazard ratio; IO, immuno-oncology; KIM-1, kidney injury molecule-1; N+I, nivolumab + ipilimumab; ORR, objective response rate; OS, overall survival; PFS, progression-free survival; W, week.
Survival table
Endpoint: PFS and OS by week-3 KIM-1 decrease (>30% vs <=30%), within each arm
N+I >30% decrease | 109
N+I <=30% decrease | 212
C+N+I >30% decrease | 246
C+N+I <=30% decrease | 68
HR: N+I PFS 0.46; N+I OS 0.55; C+N+I PFS 0.83; C+N+I OS 1.01
HR CI: 0.33–0.64; 0.38–0.78; 0.58–1.19; 0.69–1.47
P: N+I PFS P<0.0001; N+I OS P=0.00081; C+N+I PFS P=0.31; C+N+I OS P=0.96
Toni Choueiri, MD@DrChoueiri
1) Slide: RAMPART PRO title slide - adjuvant durvalumab vs active monitoring in resected RCC · 2) Slide: RAMPART PRO conclusion slide (Sophie Merrick, ESMO 2026)
Excellent presentation by @sophiemerrick1! RAMPART: adjuvant durvalumab worsened overall QoL at week 16 vs active monitoring after RCC surgery, with no difference at month 15. Patient experience matters in adjuvant treatment decisions! #ESMO26 @oncoalert @myESMO https://t.co/xV4EvwQxFg
[Slide 1]
Patient reported outcomes in resected renal cell carcinoma: adjuvant durvalumab versus active monitoring in the RAMPART trial
Sophie Merrick, Elena Frangou, Laura Murphy, Hannah L Rush, Grisma Patel, Hannah Plant, Matthew Nankivell, Paul Nathan, Grant D Stewart, Craig Gedye, Axel Bex, Tim Eisen, Ian D Davis, Balaji Venugopal, Thomas Powles, Mahesh Parmar, Martin Stockler, James Larkin, Angela Meade
Speaker: Sophie Merrick, on behalf of the RAMPART Investigators
25th October 2026
[Slide 2]
Conclusion
• The primary QoL endpoint (OHQL at Month 15) showed no evidence of a difference between arms.
• Detailed domain-specific analyses identified clinically meaningful deterioration in QoL during treatment, with some effects persisting and others emerging later.
• A similar pattern was observed in the previously reported DT vs AM comparison, where the primary OHQL endpoint showed no evidence of a difference despite clinically meaningful QoL impacts across domains at different timepoints.
Sophie Merrick
#RAMPART
Toni Choueiri, MD@DrChoueiri
1) Slide: UCL70802 LACO-Stim armored anti-CD70 CAR-T phase I in mccRCC - title slide (Gan Xinxin) · 2) Slide: UCL70802 phase I conclusions: per-patient characteristics, dose, Cmax, best response, CRS
Exciting presentation by Xinxin Gan! Anti-CD70 CAR-T UCL70802 achieved responses in 3/9 patients with metastatic ccRCC. Grade 3 CRS occurred in 4/9. Early activity worth following as dose escalation continues! #ESMO26 @oncoalert @myESMO https://t.co/9ITKKm4vr5
[Slide 1]
First-in-Human Phase I Study of UCL70802, a LACO-Stim armored Anti-CD70 CAR-T Cell Therapy, in patients with Metastatic clear cell renal cell carcinoma (mccRCC)
• GAN XINXIN
• The First Affiliated Hospital of Naval Medical University
[Slide 2]
CONCLUSIONS
UCL70802 Phase I — Patient Characteristics and Dose-Level Outcomes (mccRCC, n = 11)
Data cut-off: 27 Aug 2026 · 11 participants enrolled and infused · 11 efficacy-evaluable
Patient ID | Age / Sex | Prior lines of therapy | ECOG | Lymphodepletion | Infused dose (x10^6/kg) | Cmax (copies/µg DNA) | Best response | CRS grade
1 | 54 y / M | 1 | 1 | Standard | 0.6 | 12,486 | PD | G1
2 | 70 y / F | 2 | 1 | None | 1.2 | 209 | SD | G1
3 | 54 y / M | 5 | 1 | Standard | 1.2 | 1,368 | SD | G2
4 | 61 y / M | 2 | 1 | Standard | 2.0 | 37,750 | SD | G2
5 | 59 y / M | 3 | 0 | Standard | 2.0 | 61,565 | PR | G1
6 | 62 y / M | 2 | 0 | Standard | 2.0 | 19,565 | PR | G3
7 | 73 y / F | 2 | 1 | Standard | 2.0 | 107,135 | SD | G3
8 | 66 y / M | 1 | 1 | Standard | 3.0 | 115,067 | PR | G3
9 | 58 y / M | 2 | 0 | Standard | 3.0 | 32,655 | SD | G3
10 | 62 y / M | 2 | 0 | Standard | 3.0 | 25,439 | PR | G3
11 | 43 y / F | 2 | 0 | Standard | 3.0 | 109,021 | SD | G2
Standard lymphodepletion: cyclophosphamide 300 mg/m² × 3 days + fludarabine 30 mg/m² × 3 days; Pt 2 received no lymphodepletion.
CONCLUSIONS — UCL70802 demonstrates manageable safety and promising preliminary antitumor activity in previously treated mccRCC. With dual mechanisms — CAR-mediated precise tumor targeting and LACO-Stim–mediated systemic immune activation — it may overcome the resistance bottleneck of conventional CAR-T therapy. Dose escalation is ongoing to further characterize clinical efficacy and safety.
3615RO
Renee Maria Saliby@ReneeSaliby
1) Slide: Strategies for antigen-directed therapies (Braun talk, ESMO 2026) · 2) Slide: Initial conclusions: neoantigen vaccines in RCC, rationale for INTerpath-004
Everyone should listen to a @BraunMDPhD talk at least quarterly (doctor's orders!)
Fantastic talk focused on personalized cancer vaccines in RCC. Looking forward to the results of INTerpath-004!
#ESMO26 @OncoAlert https://t.co/bK2L6lW92Y
[Slide 3]
Strategies for antigen-directed therapies
Surface antigens | HLA-restricted antigens
Personalized: CAR T cell (autologous); scFv; Surface antigen; TIL therapy; TCR; Engineered TCR therapy; Neoantigen vaccine
'Off the shelf': CAR T cell (allogeneic); Bispecific antibodies; Monoclonal antibodies; Antibody–drug conjugates; Antibody–radionuclide conjugate; ImmTAC; Shared antigen vaccine; Identify shared antigens (such as ERVs and tumour-associated antigens)
Tumor cell; Tumour antigen (presented on HLA class I)
[...] al, Nature Reviews Clinical Oncology, 2021.
[Slide 4]
Initial conclusions
• Neoantigen vaccines are feasible to manufacture, even in modest mutation burden tumors like renal cell carcinoma
• Neoantigen vaccines can effectively elicit T cell responses
• Vaccination can induce anti-tumor immunity
• Preliminary signals of clinical activity in the adjuvant setting, but more and larger studies are needed – rationale for INTerpath-004 (NCT06307431)
Sara Coca Membribes@scocmem
1) Kaplan-Meier survival data: EV-103 long-term follow-up: PFS by INV in pooled DE/A/K EV+P · 2) Kaplan-Meier survival data: EV-103 long-term follow-up: DOR by INV in pooled DE/A/K EV+P · 3) Slide: EV-103 (KEYNOTE-869) phase 1b/2 study overview, long-term follow-up (Maroto Rey, ESMO 2026)
#ESMO26 Long-term EV-103 follow-up (up to 7 years) shows remarkable durability with ~30% of responders still in response at 7 years
The next step is identifying long-term responders through biomarkers (Nectin4?) and optimising treatment duration (ctDNA?)
@OncoAlert https://t.co/TLziTpAPdV
[Slide 1]
Median PFS by INV was 10.4 months in the pooled DE/A/K EV+P cohort
Pooled DE/A/K EV+P cohort
Events/n | Median PFS (95% CI), mo
77/121 | 10.4 (8.2, 20.9)
Landmark labels: 39.9% (30.6, 49.1); 29.1% (20.1, 38.6); 24.3% (15.1, 34.7); 20.2% (10.6, 32.1)
No. at risk: 121 102 79 55 49 42 38 35 34 32 28 23 23 22 21 20 19 17 15 11 9 7 7 6 6 5 4 2 1 1 0
EV monotherapy cohort
Events/n | Median PFS (95% CI), mo
50/73 | 6.4 (6.1, 8.4)
Landmark labels: 13.7% (5.6, 25.5); 13.7% (5.6, 25.5); 13.7% (5.6, 25.5)
No. at risk: 73 57 40 20 15 13 9 7 5 5 5 5 5 5 5 5 4 4 1 1 1 1 1 1 1 0
Data cutoff: February 20, 2026. Tumor response data evaluated by BICR have been previously published,1,2 and BICR review was no longer performed after November 2024.
BICR, blinded independent central review; DE, dose escalation; EV, enfortumab vedotin; INV, investigator; P, pembrolizumab; PFS, progression-free survival.
1. Rosenberg JE, et al. ESMO Open. 2026;11:107700. 2. O'Donnell PH, et al. J Clin Oncol. 2023;41:4107-4117.
Presented by: Dr. Jose Pablo Maroto Rey
Survival table
Endpoint: PFS by investigator (INV)
Arm | N | Median | Median CI
Pooled DE/A/K EV+P | 121 | 10.4 mo | 8.2, 20.9
EV monotherapy (Cohort K) | 73 | 6.4 mo | 6.1, 8.4
Landmark rates:
24 mo: Pooled DE/A/K EV+P 39.9% (CI 30.6, 49.1) | EV monotherapy (Cohort K) 13.7% (CI 5.6, 25.5)
48 mo: Pooled DE/A/K EV+P 29.1% (CI 20.1, 38.6) | EV monotherapy (Cohort K) 13.7% (CI 5.6, 25.5)
60 mo: Pooled DE/A/K EV+P 24.3% (CI 15.1, 34.7) | EV monotherapy (Cohort K) 13.7% (CI 5.6, 25.5)
84 mo: Pooled DE/A/K EV+P 20.2% (CI 10.6, 32.1)
[Slide 2]
Median DOR by INV was 29.6 months in the pooled DE/A/K EV+P cohort
Pooled DE/A/K EV+P cohort
ORR by INV, n/N (%) | Events/n | Median DOR (95% CI), mo
81/121 (66.9) | 41/81 | 29.6 (10.3, 71.9)
Landmark labels: 53.7% (41.3, 64.6); 41.1% (28.5, 53.3); 37.0% (23.6, 50.4); 30.8% (16.2, 46.8)
No. at risk: 81 67 59 46 40 37 36 32 29 27 22 21 21 19 19 17 16 15 12 10 8 7 7 6 5 5 2 1 1 0
EV monotherapy cohort
ORR by INV, n/N (%) | Events/n | Median DOR (95% CI), mo
33/73 (45.2) | 18/33 | 10.2 (4.4, 19.2)
Landmark labels: 29.4% (12.3, 48.8); 29.4% (12.3, 48.8)
No. at risk: 33 29 16 13 10 8 6 5 5 5 5 5 5 5 5 4 4 2 0
Data cutoff: February 20, 2026. Tumor response data evaluated by BICR have been previously published,1,2 and BICR review was no longer performed after November 2024.
BICR, blinded independent central review; DE, dose escalation; DOR, duration of response; EV, enfortumab vedotin; INV, investigator; ORR, overall response rate; P, pembrolizumab.
1. Rosenberg JE, et al. ESMO Open. 2026;11:107700. 2. O'Donnell PH, et al. J Clin Oncol. 2023;41:4107-4117.
Presented by: Dr. Jose Pablo Maroto Rey
Survival table
Endpoint: Duration of response by investigator (INV)
Arm | N | Median | Median CI
Pooled DE/A/K EV+P | 81 | 29.6 mo | 10.3, 71.9
EV monotherapy (Cohort K) | 33 | 10.2 mo | 4.4, 19.2
Landmark rates:
24 mo: Pooled DE/A/K EV+P 53.7% (CI 41.3, 64.6) | EV monotherapy (Cohort K) 29.4% (CI 12.3, 48.8)
48 mo: Pooled DE/A/K EV+P 41.1% (CI 28.5, 53.3) | EV monotherapy (Cohort K) 29.4% (CI 12.3, 48.8)
60 mo: Pooled DE/A/K EV+P 37.0% (CI 23.6, 50.4)
84 mo: Pooled DE/A/K EV+P 30.8% (CI 16.2, 46.8)
[Slide 3]
Phase 1b/2 EV-103 (KEYNOTE-869)a Study Overview
• EV-103 first demonstrated durable clinical benefit with 1L EV+P in cisplatin-ineligible la/mUC, supporting the initial indication in this population1,2
• EV-302 (KEYNOTE-A39)b subsequently confirmed these findings and established EV+P as a standard of care in la/mUC3-5
• This long-term follow-up evaluated clinical benefit durability and long-term safety of EV+P
• With the longest follow-up of EV+P in la/mUC to date, these results may help guide real-world management and optimize patient benefit
EV-103 dose escalation and expansion cohorts A and K (1L cisplatin-ineligible la/mUC)2,6
Dose Escalation (DE) | EV+P (n=5)c
Recommended EV dose →
Cohort A (expansion cohort) | EV+P (n=40)
Cohort Kd (randomized cohort) 1:1 randomizatione | EV+P (n=76) | EV monotherapy (n=73)
This analysis | Pooled EV+P DE/A/K cohort (N=121) | EV monotherapy Cohort K (n=73)
• Baseline characteristics were previously reported and consistent with the population1,7
• At data cutoff (February 20, 2026), all patients were off study treatment
• Median follow-upf: 64.2 months (pooled EV+P) and 58.6 months (EV monotherapy)
aNCT03288545. bNCT04223856. cParticipants who received EV 1.25 mg/kg. dStudy was not designed to compare EV+P vs EV monotherapy. eOf 151 randomized in EV-103 Cohort K, 149 received ≥1 dose of study treatment. fMedian follow-up for DE/Cohort A (n=45) and EV+P arm in Cohort K (n=76) was 89.0 months and 58.8 months, respectively.
1L, first line; DE, dose escalation; EV, enfortumab vedotin; la/mUC, locally advanced/metastatic urothelial carcinoma; P, pembrolizumab.
1. Rosenberg JE, et al. ESMO Open. 2026;11:107700. 2. Friedlander TW, et al. ESMO 2025. Abstract 3074P (Poster). 3. Powles T, et al. N Engl J Med. 2024;390:875-888. 4. Powles T, et al. Ann Oncol. 2025;36:1212-1219. 5. Powles T, et al. Ann Oncol. 2024;35:485-490. 6. Rosenberg JE, et al. ASCO 2020. Abstract 5044 (Poster). 7. O'Donnell PH, et al. J Clin Oncol. 2023;41:4107-4117.
Presented by: Dr. Jose Pablo Maroto Rey
Tom Powles@tompowles1
Slide: npj Precision Oncology article header: IRIS-RCC individual sample predictive model for metastatic renal cell
Biomarker analysis exploring within-patient gene-expression ratios and deterministic single-sample predictions. This is an alternative to the high vs low classic approach @brian_rini #ESMO26 https://t.co/C81tskGRL0 https://t.co/33yfmPWwtL
npj | precision oncology
Brief communication
Published in partnership with The Hormel Institute, University of Minnesota
Article in Press
https://doi.org/10.1038/s41698-026-01745-y
An individual sample predictive model to classify patients with metastatic renal cell carcinoma
Anupama Reddy1, W. Jared Brewer1, Scott Haake2 & Brian Rini2
Using RNAseq data from the IMmotion 151 clinical trial (IM151), 7 RCC biologic clusters have been defined. Several groups have attempted to predict clusters on RCC datasets without observing the association with therapy response from IM151. We developed IRIS-RCC (Individual RNA-seq Intrinsic Subtyping for RCC; available at https://irisrcc.vindhyadatascience.com/), to predict molecular clusters using an individual-sample model. IRIS-RCC normalizes gene expression within a given sample using ratiometric gene expression values.
Toni Choueiri, MD@DrChoueiri
Biomarker data: REPRINT results: biomarker features of the 2 responders (renal medullary carcinoma)
Insightful presentation by @g_procopio_! REPRINT: EV + pembrolizumab produced responses in 2/9 evaluable patients, both with a renal medullary carcinoma subtype; none in collecting duct carcinoma. Early data in rare kidney cancers! #ESMO26 @oncoalert @myESMO https://t.co/0psc83FTDD
REPRINT Results
Biomarker / Feature | Responder #1 | Responder #2
Histological Subtype | RCCU-MP | RCCU-MP
SMARCB1 Status | Deficient | Deficient
Membranous NECTIN-4 | Negative | Negative
PD-L1 CPS | 10% | 20%
Tumor Mutational Burden | 1.6 mut/Mbp | 3.8 mut/Mbp
INI1 (SMARCB1) loss in tumor cells with preserved expression in control lymphocytes, a defining diagnostic feature of renal medullary carcinoma
Giuseppe Procopio
Toni Choueiri, MD@DrChoueiri
Slide: EV-103 cohorts DE, A and K long-term follow-up conclusions (Maroto Rey, ESMO 2026)
And now @Maroto5Pablo reporting long term follow-up from phase Ib/II #EV-103 study.
Consistent with prior reports:
EV+P demonstrated sustained responses and survival, with a manageable safety profile.
#ESMO26 #Day2 @myESMO @OncoAlert https://t.co/OwVOGf2vtm
Conclusions: EV-103 cohorts DE, A, and K
• This analysis reports the longest follow-up to date from the phase 1b/2 EV-103 study (64.2 mo for the pooled EV+P cohort), demonstrating sustained responses and survival with 1L EV+P in patients with la/mUC who are cisplatin ineligible
• Median OS was 27.7 months in the pooled EV+P cohort and 22.8 months in the EV monotherapy cohort, and an estimated 33% of patients in the pooled EV+P cohort and 23.9% in the EV monotherapy cohort were alive at 5 years
– These data are notable given the historically poor outcomes in advanced UC (eg, 9.6% 5-y relative survival for metastatic bladder cancer, SEER; 8.4% of cisplatin-ineligible patients alive at 4.5-y median follow-up, EORTC 30986)(1,2)
• Consistent with previous reports,(3-5) the safety profile was manageable and most treatment-related AEs of special interest for EV improved or resolved over time and no new safety signals were observed
• These data are consistent with EV-302, reinforcing the long-term benefit-risk profile, sustained survival benefits, and 1L standard-of-care role of EV+P in la/mUC
1L, first line; AE, adverse event; DE, dose escalation; EV, enfortumab vedotin; la/mUC, locally advanced/metastatic urothelial carcinoma; P, pembrolizumab.
[References small print, partly legible: 1. National Cancer Institute. Cancer Stat Facts: Bladder Cancer ... Accessed August 2026. 2. De Santis M, et al. J Clin Oncol. 2012;30:191-199. 3. Rosenberg JE, et al. ESMO Open. 2026[?] ... 4. Friedlander TW, et al. ESMO 2025. Abstract 3074P (Poster). 5. O'Donnell PH, et al. J Clin Oncol. 2023;41:4107-4117.]
Presented by: Dr. Jose Pablo Maroto Rey
Toni Choueiri, MD@DrChoueiri
1) Trial design schema: CATALINA-1 Study Design — Phase 1 ixotatug vedotin (Ixo-V) monotherapy · 2) Slide: CLDN6 as a Novel Therapeutic Target in GCT (background, Ixo-V presentation) · 3) Slide: CATALINA-1 GCT cohort: Baseline Demographics by Ixo-V dose level (N=11) · 4) Response data: CATALINA-1: Response Rates in Patients with GCT — Ixo-V (N=11)
Promising new target in germ cell tumours at #ESMO26!
@DrDarrenFeldman presents ixotatug vedotin (TORL-1-23), a CLDN6-targeted ADC, in heavily pretreated patients with limited options.
Early results (n=11):
• ORR: 45.5%
• DCR: 72.7%
• mPFS: 5.8 months
Neuropathy was a key toxicity, with 1 treatment-related discontinuation.
Encouraging activity in a setting with few new therapies!
@myESMO @oncoalert
[Slide 1]
CATALINA-1 Study Design
Phase 1 Dose Escalation and Expansion with Ixo-V Monotherapy in Solid Tumors
GCT patient population
- Confirmed advanced or metastatic solid tumor malignancy
- No available standard of care therapy
- Not amenable to surgery
- Prior HDCT and ASCT allowed
- For dose expansion: CLDN6 positivitya by IHC was required
Key endpoints
Primary:
- AEs by CTCAE 5.0
Secondary:
- Best objective response by investigator per RECIST v1.1
Escalation
First-in-human starting dose (0.2 mg/kg Q3W) -> Accelerated dose titration (1 patient per cohort) -> Grade ≥2 related AE -> Standard "3 + 3" dose escalation -> Recommended phase 2 dose
Expansion
- CLDN6-positive platinum-resistant ovarian cancer expansion
- CLDN6-positive refractory NSCLC expansion
- Other CLDN6-positive refractory cancers expansion (including GCT) [highlighted]
- CLDN6-low/negative expansion
- CLDN6-low/positive ovarian cancer Ixo-V + combinations (including bevacizumab)
- CLDN6-positive NSCLC Ixo-V + pembrolizumab
AEs, adverse events; ASCT, autologous stem cell transplantation; CLDN6, claudin 6; CTCAE, Common Terminology Criteria for Adverse Events; GCT, germ cell tumors; HDCT, high-dose chemotherapy; IHC, immunohistochemistry; Ixo-V, ixotatug vedotin; NSCLC, non-small cell lung cancer; Q3W, every 3 weeks; RECIST, Response Evaluation Criteria in Solid Tumors.
aCLDN6 positivity was defined as >30% tumor cell membrane staining of any intensity by IHC.
TORL BioTherapeutics Data on File, 2026.
[Slide 2]
CLDN6 as a Novel Therapeutic Target in GCT
- CLDN6 is a cell surface protein and a member of the claudin family of tight junction molecules1
- CLDN6 is highly expressed in multiple human cancers, including GCT, with little or no expression in healthy adult tissues2-4
- GCT are the most common solid malignancy in adolescent and young adult men and are typically diagnosed in the third and fourth decades of life5-7
- Although most patients with newly-diagnosed GCT are successfully treated with platinum-based chemotherapy, 20-30% relapse5,8,9
- Long-term survival is achieved in <10% of patients who progress post-HDCT/ASCT5,10
- Chemotherapy regimens produce ORRs of ~6-51%9
- Clinically effective salvage therapies are limited5,9
[Figure: CLDN6 mRNA Expression Across Tumor Types2 — Log(FKPM)-RNA-seq by tumor type (AML n=173 ... Testicular cancer n=156, boxed); tumor-type labels small]
Reprinted from Clinical Cancer Research, 2023;29(11):2131-2143, McDermott MSJ, et al., with permission from AACR.
There is high unmet clinical need for novel therapeutic options in recurrent GCT.
AML, acute myeloid leukemia; CLDN6, claudin 6; GCT, germ cell tumors; HDCT/ASCT, high-dose chemotherapy with autologous stem cell transplant; ORRs, objective response rates.
1. Qu H, et al. Int J Mol Sci. 2021;22(24):13416. 2. McDermott MSJ, et al. Clin Cancer Res. 2023;29(11):2131-2143. 3. Silverstein J, et al. Presented at: SGO Annual Meeting on Women's Cancer; April 10-13, 2026; San Juan, PR. 4. Yang Z, et al. Pharmacol Res. 2026;230:108276 5. Feldman DR, et al. Cancer Med. 2026;15:e72017. 6. Cancer stat facts: testicular cancer. Accessed October 5, 2026. https://seer.cancer.gov/statfacts/html/testis.html. 7. JAMA patient page: what are testicular germ cell tumors? Accessed October 7, 2026. https://jamanetwork.com/journals/jama/fullarticle/2834695. 8. McHugh DJ, Feldman DR. Adv Urol. 2018; 7272541. 9. Oltrecolli M, et al. Ther Adv Med Oncol. 2026; 18:1-15. 10. Feldman DR, et al. Cancer. 2012;118:981-986.
[Slide 3]
Baseline Demographics
| | Ixo-V <2.4 mg/kg (n=3) | 2.4 mg/kg (n=3) | 3 mg/kga (n=4) | 3.4 mg/kgb (n=1) | Total N=11 |
| Median age, years (range) | 30.0 (27.0, 44.0) | 45.0 (31.0, 76.0) | 39.0 (26.0, 46.0) | 23.0 (23.0, 23.0) | 37.0 (23.0, 76.0) |
| Sex, n (%) Male | 3 (100.0) | 3 (100.0) | 3 (75.0) | 1 (100.0) | 10 (90.9) |
| Female | 0 | 0 | 1 (25.0) | 0 | 1 (9.1) |
| ECOG PS at baseline, n (%) 0 | 2 (66.7) | 1 (33.3) | 3 (75.0) | 1 (100.0) | 7 (63.6) |
| 1 | 1 (33.3) | 2 (66.7) | 1 (25.0) | 0 | 4 (36.4) |
| Number of prior lines of therapy, n (%) 1-2 | 0 | 1 (33.3) | 1 (25.0) | 0 | 2 (18.2) |
| ≥3 | 3 (100.0) | 2 (66.7) | 3 (75.0) | 1 (100.0) | 9 (81.8) |
| Median prior lines of therapy, n (range) | 4.0 (3.0, 5.0) | 4.0 (1.0, 4.0) | 3.0 (2.0, 4.0) | 3.0 (3.0, 3.0) | 3.0 (1.0, 5.0) |
| Type of prior therapy, n (%) Platinum compounds | 3 (100.0) | 3 (100.0) | 4 (100.0) | 1 (100.0) | 11 (100.0) |
| Taxanes | 3 (100.0) | 2 (66.7) | 3 (75.0) | 0 | 8 (72.7) |
| HDCT/ASCT | 3 (100.0) | 0 | 2 (50.0) | 1 (100.0) | 6 (54.5) |
- Among enrolled patients, GCT primary tumor sites were testicular (n=9), ovarian (n=1), and mediastinal (n=1)
- 10 of 11 patients had nonseminoma and 1 had seminoma
- CLDN6 expression was positive (>30%) in 10 of 10 patients (100%) tested by IHCc
CLDN6, claudin 6; ECOG PS, Eastern Cooperative Oncology Group performance status; G-CSF, granulocyte colony stimulating factor; GCT, germ cell tumors; HDCT/ASCT, high-dose chemotherapy with autologous stem cell transplant; IHC, immunohistochemistry; Ixo-V, ixotatug vedotin.
a2 of the 4 patients treated with Ixo-V at this dose level received prophylactic G-CSF. bThis patient received prophylactic G-CSF. cOut of the 11 total patients, 1 patient specimen was missing.
[Slide 4]
Response Rates in Patients with GCTa,b
[Waterfall plot: Best change from baseline in sum of diameter, % by Patient ID (OC04, T01, T06, T04, T03, T07, T08, T02, T05, S07); dose legend 0.4 / 1.0 / 2.0 / 2.4 / 3.0 / 3.4 mg/kg; markers: Ovarian tumor, Mediastinal tumor, Received prior HDCT/ASCT, * Tx ongoing]
| Parametera | All dose levels (N=11) |
| BOR, n (%) PR | 5 (45.5) |
| SD | 3 (27.3) |
| PD | 2 (18.2) |
| NE | 1 (9.1) |
| ORR, % (95% CI) | 45.5 (16.7-76.6) |
| DCR, % (95% CI) | 72.7 (39.0-94.0) |
| mPFS, months (95% CI) | 5.8 (1.4-13.8) |
aDOR was immature at data cutoff date.
- Responses were observed at Ixo-V dose levels ranging from 1 mg/kg to 3.4 mg/kg, with a median follow-up of 13.8 months
- Three of 6 (50.0%) patients who received prior HDCT/ASCT had confirmed responses to Ixo-V
- One patient with testicular GCT has maintained a response for 47.4 months with treatment ongoing at time of data cutoff
Ixo-V monotherapy exhibits preliminary antitumor clinical activity at doses ≥1 mg/kg in heavily pretreated patients with recurrent GCT, including those with disease refractory to ASCT
BOR, best overall response; DCR, disease control rate; DOR, duration of response; GCT, germ cell tumors; HDCT/ASCT, high-dose chemotherapy with autologous stem cell transplant; Ixo-V, ixotatug vedotin; mPFS, median progression-free survival; NE, not evaluable; ORR, objective response rate; PD, progressive disease; PR, partial response; SD, stable disease; Tx, treatment.
aData cutoff was March 16, 2026. bPrimary sites for the 11 GCT patients include testicular (n=9), ovarian (n=1), and mediastinal (n=1).
Great presentation by @maughanonc! SWOG S2200: cabozantinib + atezolizumab showed a PFS signal vs cabozantinib in metastatic papillary RCC (HR 0.46). Only 33 eligible patients after early closure for slow accrual. Small but important! #ESMO26 @oncoalert @myESMO https://t.co/vRNJr8xnbW
[Slide 1]
Background
Papillary renal cell carcinoma (PRCC) is a rare type of kidney cancer, representing approximately 10-15% of all renal cell carcinomas1
S1500 (PAPMET) established cabozantinib as an effective first-line treatment compared to other TKIs based on improved PFS (5.6 months vs 9.0 months for sunitinib and cabozantinib respectively), though no difference in OS was observed across the study arms2,3
More recent single-arm trials have shown high ORR and long PFS with combination TKI/IO therapy.
• Keynote-B61 tested lenvatinib/pembrolizumab with an ORR of 45% and median PFS of 17.5 months4 in the PRCC cohort
1. Saigia NJ et al. Am Soc Clin Oncol Educ Book. 2024 Jun;44(3):e438642
2. Pal SK, et al. Lancet. 2021 Feb 20;397(10275):695-703
3. Barata P, et al. J Clin Oncol. 2024 Nov 20;42(33):3911-3916.
Leading cancer research. Together. SWOG
[Slide 2]
Conclusions
S2200 (PAPMET2) closed prematurely due to slow accrual likely reflecting an evolving standard of care with greater adoption of combination therapy for PRCC based on single-arm studies
The observed prolonged PFS with cabozantinib/atezolizumab compared to cabozantinib supports the hypothesis that combination therapy is an appropriate first-line treatment for PRCC
Rare cancer trials can be challenging to conduct due to multiple factors including high costs at individual sites as well as low patient volumes. Additional structural changes are warranted to better support rare cancer trials in the future.
Results from STELLAR-304 (NCT05678673), SAMETA (NCT05043090) and AXIPAP (NCT02489695) testing monotherapy versus combination therapies are still pending
Leading cancer research. Together. SWOG
Toni Choueiri, MD@DrChoueiri
1) Slide: POTOMAC: early high-risk disease events in papillary-only and T1 tumours (swimmer plots) · 2) Slide: POTOMAC conclusions (papillary-only analysis)
#MariaDeSantis reporting outcomes of pts with papillary only tumors from #POTOMAC #NMIBC
Addition of Durva to BCG (I+M):
• Fewer early high-risk disease recurrences
• Fewer BCG unresponsive recurrences
• Fewer cystectomies
#ESMO26 #Day2 @myESMO @OncoAlert https://t.co/ora8w2QGf8
[Slide 2]
POTOMAC: Early High-Risk Disease Events in Patients With Papillary Only and With T1 Tumours
The addition of D to BCG (I+M) resulted in fewer early high-risk recurrences, which are associated with worse outcomes a,b
Papillary only: D+BCG (I+M) | BCG (I+M) [swimmer plots; y-axis Patients; x-axis Time from randomisation to high-risk event (months) 0-12]
Early high-risk events: 16 patients in D+BCG (I+M) arm vs 29 patients in BCG (I+M) arm
T1: D+BCG (I+M) | BCG (I+M)
Early high-risk events: 10 patients in D+BCG (I+M) arm vs 20 patients in BCG (I+M) arm
aPost-hoc exploratory analysis. bIncludes patients who experience high-risk events as per DFS, except death. Early high-risk recurrences: within 12 months from randomisation. T1 disease: papillary disease stage T1, without CIS. Data cutoff 03 April 2025. BCG, bacillus Calmette-Guérin; CIS, carcinoma in situ; D, durvalumab; DFS, disease-free survival; I, induction; M, maintenance.
[Slide 3]
POTOMAC: Conclusions
• Durvalumab plus BCG (I+M) reduced the risk of high-risk disease recurrence or death by 44% in patients with papillary only tumours compared with BCG (I+M) alone (HR 0.56, 95% CI, 0.37–0.84)1
• In patients with papillary only tumours, the addition of durvalumab to BCG (I+M) therapy led to:
• Fewer early high-risk disease recurrences
• Fewer BCG unresponsive recurrences
• Fewer cystectomies performed, with a favourable trend for cystectomy-free survival
• Similar results were observed in patients with T1 disease
• Safety of durvalumab plus BCG (I+M) in patients with papillary only tumours was consistent with the overall safety population and with the known safety profiles of the individual therapies
• The majority of imAEs were low grade and most resolved or were resolving at the data cutoff; imAEs were consistent with the known safety profile of durvalumab
These data further support 1 year of durvalumab in combination with BCG (I+M) as a new treatment option for BCG-naïve, high-risk NMIBC, including for patients with papillary only tumours
[QR code] Scan the QR code to access: • Slide presentation • Plain language summary
1. De Santis M, et al. Lancet. [illegible small print reference]; BCG, bacillus Calmette-Guérin; CI, confidence interval; I, induction; imAE, immune-mediated adverse event; HR, hazard ratio; M, maintenance; NMIBC, non-muscle invasive bladder cancer.
In Patients Predicted to Be N+I KIM-1 Non-Decreasers, Addition of a TKI Results in Significantly Longer PFS and Higher ORR
Predicting N+I KIM-1 Non-Decreasers (COSMIC-313)
N+I-treated patients / C+N+I-treated patients -> Baseline tumor RNA-seq -> Pre-trained RNA-seq model -> Predicted >30% KIM-1 decrease on N+I (Yes/No)
ANALYSIS POPULATION: Predicted NOT to achieve >30% KIM-1 decrease on N+I
N+I (n=109) vs. C+N+I (n=130)
Definition of non-decreaser: Predicted to NOT have >30% KIM-1 decrease on N+I
Rationale: These patients are unlikely to benefit from N+I alone based on predicted lack of early KIM-1 decrease. Does adding a TKI improve outcomes?
PFS in Predicted Non-Decreasers (COSMIC-313)
Number at risk (0,10,20,30,40,50 months): C+N+I 130 | 61 | 44 | 28 | 15 | 0; N+I 109 | 41 | 22 | 9 | 5 | 0
Cox Proportional Hazard Model (PFS)
Study (All ITT Patients*): HR 0.76 (95% CI 0.59–0.98); P = 0.0318
Predicted Non-Decreasers: HR 0.63 (95% CI 0.46–0.87); P = 0.0052
In patients predicted NOT to achieve a >30% KIM-1 decrease on N+I, adding cabozantinib to N+I reduces risk of progression by 37%
Best Overall Response in Predicted Non-Decreasers (COSMIC-313) N+I | C+N+I
CR: 2.0% | 6.5%
PR: 31.7% | 42.3%
SD: 37.6% | 41.5%
PD: 28.7% | 9.8%
ORR (CR+PR) 34% vs. 49%; P = 0.02
Disease Control Rate (CR+PR+SD) 71% vs. 90%; P = 0.0005
*RNA-seq evaluated.
C, cabozantinib; CI, confidence interval; CR, complete response; HR, hazard ratio; I, ipilimumab; ITT, intention to treat; KIM-1, kidney injury molecule-1; N, nivolumab; ORR, objective response rate; PD, progressive disease; PFS, progression-free survival; PR, partial response; SD, stable disease; TKI, tyrosine kinase inhibitor.
#PAPMET2 trial @maughanonc
although closed early d/t slow enrollment, still very meaningful to show more data to support IO/TKI preferred over TKI in papillary RCC
36 pts enrolled
Higher PFS & ORR with doublet
Results of STELLAR-304, SAMETA & AXIPAP are pending! #ESMO26 https://t.co/turkbi2BCd
1) Slide: CAIX-targeted [68Ga]Ga-DPI-4452 PET/CT in ccRCC title slide (Liangyou Gu) · 2) Slide: CAIX [68Ga]Ga-DPI-4452 PET/CT Cohort A results tables (Liangyou Gu)
Fascinating presentation by Liangyou Gu! CAIX-targeted Ga-DPI-4452 PET/CT identified ccRCC with 100% sensitivity and 85.7% specificity in a 30-patient diagnostic cohort. An exciting direction for kidney cancer imaging! #ESMO26 @oncoalert @myESMO https://t.co/0MbQTPyUA2
[Slide 1]
Diagnostic and Staging Performance of CAIX-Targeted [68Ga]Ga-DPI-4452 PET/CT in Clear Cell Renal Cell Carcinoma: A Prospective Trial
Presenting author
Liangyou Gu, MD
Senior Department of Urology
Chinese PLA General Hospital, Beijing, China
October 25, 2026
[Slide 2]
Results: Cohort A
TABLE1 Patient Characteristics (n = 30)
Characteristic | Value
Age (y) | 57.2 (52.3–61.8)
Sex
Female | 14 (46.7)
Male | 16 (53.3)
Pathology
ccRCC | 23 (76.7)
Unclassified RCC | 2 (6.7)
pRCC | 2 (6.7)
chRCC | 1 (3.3)
AML | 1 (3.3)
UTUC | 1 (3.3)
No. positive lesions*
Primary lesions | 26
Lymph nodes | 6
Adrenal glands | 2
Lungs | 24
Pancreas | 3
Bone | 2
Other | 5
TABLE 2 Diagnostic Efficacy of [68Ga]Ga-DPI-4452 PET/CT
Variable | Primary tumor | Extrarenal metastases | Regional lymph nodes | Distant metastases
Sensitivity (%) | 100 | 97.7 | 100 | 97.3
Total no. lesions | 23 | 43 | 6 | 37
No. lesions identified | 23 | 42 | 6 | 36
95% CI (%) | 85.2–100.0 | 87.7–99.9 | 54.1–100.0 | 85.8–99.9
Specificity | 85.7 | 100 | NA | 100
Total no. lesions | 7 | 1 | NA | 1
No. lesions identified | 6 | 1 | NA | 1
95% CI (%) | 42.1–99.6 | 2.5–100.0 | NA | 2.5–100.0
Accuracy | 96.7 | 97.7 | 100 | 97.4
Total no. lesions | 30 | 44 | 6 | 38
No. lesions identified | 29 | 43 | 6 | 37
95% CI (%) | 82.8–99.9 | 88.0–99.9 | 54.1–100.0 | 86.2–99.9
*Patients could have more than 1 positive lesion.
RCC = renal cell carcinoma; pRCC = papillary renal cell carcinoma; chRCC = chromophobe renal cell carcinoma; AML = angiomyolipoma; UTUC = upper tract urothelial carcinoma.
NA = not applicable
Dr. Liangyou Gu
Karine Tawagi MD@DrKarineTawagi
1) Slide: CAIX [68Ga]Ga-DPI-4452 PET/CT background (Liangyou Gu) · 2) Trial design schema: CAIX [68Ga]Ga-DPI-4452 PET/CT study design, cohorts A and B (Liangyou Gu) · 3) Slide: CAIX [68Ga]Ga-DPI-4452 PET/CT conclusion and future perspectives (Liangyou Gu)
Exciting data at #ESMO26 by Dr. Liangyou Gu on novel imagining for kidney CA 🩻
💫 novel CAIX-targeted [68Ga] PET provides accurate primary ccRCC identification and superior detection of lymph node, lung & bone mets over regular 2-[18F]FDG PET, esp in small-volume lesions https://t.co/aNwQ9eEOyF
[Slide 2]
Background
01 Clinical need
Conventional imaging may not reliably characterize renal masses or detect small-volume metastatic disease.
Unmet need: more specific diagnosis and staging
Wu Q, et al. 2025.
02 Biological target
CAIX is a cell-surface protein expressed in more than 90% of ccRCC, making it an attractive imaging target.
Tumor biology: VHL/HIF pathway activation
Queen, A., et al. 2022.
03 Imaging approach
The peptide [68Ga]Ga-DPI-4452 enables rapid, same-day, whole-body CAIX-targeted PET/CT.
Potential value: primary diagnosis and metastatic detection
Galetic I., et al. 2024
Can [68Ga]Ga-DPI-4452 improve the diagnosis and staging of ccRCC?
Dr. Liangyou Gu
[Slide 3]
Study design
Cohort A - Inclusion
• Age ≥18 years
• CT/MRI/US suggests RCC
• Surgery or biopsy within 4 weeks after PET/CT
• ECOG ≤ 2
Patient screening
Cohort B - Inclusion
• Age ≥18 years
• Suspected or confirmed advanced ccRCC
• Paired DPI-4452 and FDG PET/CT before treatment
• ECOG ≤ 2
Diagnostic validation: Cohort A → [68Ga]Ga-DPI-4452 PET/CT → Surgery or biopsy within 4 weeks →
Cohort A - Endpoint
• Primary ccRCC diagnosis: Histopathology-referenced diagnostic performance
• Metastatic disease: Incremental detection versus conventional imaging
Head-to-head comparison: Cohort B → [68Ga]Ga-DPI-4452 PET/CT / Paired comparison / [18F]FDG PET/CT → Within 14 days →
Cohort B - Endpoint
• Metastatic lesion detection: DPI-4452 versus FDG
• Secondary analyses: Detection by site and size; quantitative uptake
Trial registration: ChiCTR2600121783
Dr. Liangyou Gu
[Slide 4]
Conclusion and Future perspectives
From disease detection to CAIX-guided precision theranostics
What We Showed
CAIX-targeted molecular imaging provides complementary diagnostic and biologic information in ccRCC
• Accurate identification of primary ccRCC
• Superior detection over 2-[18F]FDG for lymph node, lung and bone metastases, particularly small-volume lesions
Potential Clinical Pathway
• Precision Diagnosis and Staging: Noninvasive ccRCC characterization and detection of small-volume disease
• Personalized Patient Management: Guide treatment planning and response monitoring
• CAIX-Targeted Theranostics: Help select patients for radioligand therapy
Next step: Multicentre validation of clinical impact, patient outcomes, and radioligand therapy dosimetry.
Dr. Liangyou Gu
Julian Chavarriaga@chavarriagaj
1) Slide: Deep PSA response (≤0.2 ng/mL) distribution and by treatment in mHSPC multicenter study · 2) Kaplan-Meier survival data: CRPC-free survival and OS by deep vs non-deep PSA response · 3) Biomarker data: Deep vs non-deep PSA responders: RNA-seq volcano plot, hallmark GSEA
#ESMO26 A multicenter study (n=671) exploring the clinical and molecular drivers of PSA ≤0.2 ng/mL was presented:
📌65.2% achieved a deep PSA response
📌Median CRPC-free survival: 88 vs 13.3 months
📌Median OS: 83.5 vs 31.5 months
📌Nonresponders showed enrichment of cell-cycle, chromosomal instability, DNA-repair and neuroendocrine programs
📌Deep responders had greater AR activity and enrichment of SPOP mutations
🚨Failure to achieve deep PSA suppression may reflect aggressive tumor biology, not simply inadequate treatment intensity.
@UroToday @myESMO
Great discussions at #ESMO2026!
A pleasure to participate as an invited discussant in today’s Rapid Oral session on #BladderCancer.
From NMIBC to metastatic disease: ADCs, immunotherapy, biomarkers and patient-reported outcomes. The therapeutic landscape is changing rapidly!
But presenting new evidence is only part of the story. Putting results into context and critically assessing their clinical value is essential to understand what should change in daily practice.
Great to share the session with Britt Suelmann and @ProfSyedHussain.
Thank you @myESMO for the invitation and to all the investigators for their outstanding research! And above all : thank you to our patients for their trust.!
#UroOncology #GUOncology
[Top-left photo, partial forest plot on screen, partially legible]:
Participants with no definitive deterioration were censored at last PRO assessment regardless of PD or recurrence. Participants who did not have postbaseline PRO assessment were censored at ... [cropped]
Database cutoff: October 27, 2025.
HR (95% CI)
Favors EV + Pembro | Favors Cis + Gem
[Bottom-right photo, discussant slide, top cropped]:
... indication [cropped]
BENEFIT-HARM
Uncertain: +20 per 100 with grade 3-4 TRAEs, some permanent
MAGNITUDE
Small: ~7 fewer high-risk recurrences per 100; progression unchanged
CERTAINTY
Low: few events; composites partly driven by deaths; inconsistent across trials
PATIENT VALUES
Preference-sensitive: bladder preservation vs toxicity and time
APPLICABILITY (EU)
Not authorised: EU application withdrawn (June 2026); FDA-approved since May 2026
What would change the assessment
Individual-patient meta-analysis of POTOMAC, CREST and ALBAN with prespecified subgroups · causes of death and competing-risk analysis · mature OS · patient-reported outcomes · a predictive biomarker
Consistent with the overall trial. In my reading, not sufficient to change the current recommendation (EAU 2026: discuss benefits and harms in selected patients).
MJ Ribal · Uro-Oncology Unit · Clinic Comprehensive Cancer Center Barcelona
Daniel Castellano@cdanicas
1) Trial design schema: GUARD-01 (NCT05723991) trial design: neoadjuvant disitamab vedotin · 2) Slide: GUARD-01 expanded cohort (4 added patients) and pCR by cycle number (PP and ITT) · 3) Slide: GUARD-01 survival analysis of final 30 patients: EFS, OS, and EFS by RC vs non-RC · 4) Trial design schema: GUARD-02 (NCT07693959) phase III design: RC48 + gemcitabine vs RC48 +
🎯 Update of the GUARD-01 trial periop MIBC with Disitamab + gem for HER-2 + pts! 62.5% pCR (4 cycles > 3 cycles) Pending to GUARD-02 ph 3 trial including Disitamab + toripalimab cohort!! @OncoAlert @myESMO @urotoday @tompowles1 https://t.co/ZihtPaGA3U
[Slide 1]
The Trial Design of NCT05723991 (GUARD-01)
An Exploration of ADC plus chemotherapy
[Mechanism graphic: Gemcitabine, MMAE, cell-cycle G1/S/G2/M]
Eligibility Criteria
➢Clinical stage T2–4aNxM0
➢HER2 IHC 2+ or 3+
➢Intolerance to or refusal of cisplatin-based chemotherapy
➢ECOG PS 1–2
➢Planned to undergo RC + PLND
C1 C2 C3
Day 1 RC48 2mg/kg IV, Day 2 Gemcitabine 1000mg/m2 IV; 14 days/cycle, 3 or 4 cycles
C1 C2 C3 C4
Imaging assess / pathologic assess
➢RC ➢PLND
➢Refuse to RC
Safety surveillance
Primary endpoint:
➢ Pathological complete response rate
Secondary endpoints:
➢ Pathological downstaging rate
➢ Event-free survival
➢ Safety and tolerability
A Phase II Multicenter Study of Neoadjuvant Disitamab Vedotin Combined with Gemcitabine in MIBC Patients with HER2 2-3+: Interim Prognostic Outcomes
MADRID 2026 ESMO congress
[Slide 2]
4 more patients (Since study completion, enrollment has been expanded) ,who were treated the same as the 26-patients sample were included into pCR, EFS/OS analysis.
Patient | age | gender | ECOG PS | Tissue source | Stage | HER2 IHC | Cycle | Imaging assess | pathologic assess
Case-27 | 74 | male | 2 | TURBT | T3N0M0 | 2 | 4 | CR | N
Case-28 | 64 | male | 1 | BP | T4aN0M0 | 2 | 4 | PR | N
Case-29 | 68 | male | 2 | TURBT | T3N0M0 | 2 | 4 | CR | ypT0N0M0
Case-30 | 59 | female | 1 | TURBT | T3N0M0 | 2 | 4 | CR | ypT0N0M0
| Overall pCR | 3-cycle | 4-cycle
PP | 15/24 | 4/10 | 11/14
ITT | 15/30 | 4/13 | 11/17
Pie charts: Overall: pCR 62.5, no pCR 37.5; 3-cycle: pCR 40, no pCR 60; 4-cycle: pCR 78.6, no pCR 21.4
A Phase II Multicenter Study of Neoadjuvant Disitamab Vedotin Combined with Gemcitabine in MIBC Patients with HER2 2-3+: Interim Prognostic Outcomes
MADRID 2026 ESMO congress
[Slide 3]
Survival analysis of Final 30 patients
Panel 1: Event-free survival rate (%) vs Time from neoadjuvant therapy (months); labels 92.9%, 85.0%, 67.2%
Panel 2: Overall survival rate (%) vs Time from neoadjuvant therapy (months); labels 96.7%, 92.8%, 86.6%
Panel 3: Event-free survival rate (%) by RC+PLND vs Non-RC; labels RC+PLND 100%, 90.6%, 78.1%; Non-RC 62.5%, 62.5%, 31.2%; P=0.026
➢ 30 patients; median follow-up 31.6 months (cutoff Sep 1, 2026). 7 progressed/died; 3 died (2 without RC).
➢ 12/24/36-mo EFS: 92.9% / 85% / 67.2%; OS: 96.7% / 92.8% / 86.6%.
➢ Median EFS: not reached with RC vs 36 months without RC (statistically significant).
A Phase II Multicenter Study of Neoadjuvant Disitamab Vedotin Combined with Gemcitabine in MIBC Patients with HER2 2-3+: Interim Prognostic Outcomes
Survival table
Endpoint: EFS and OS (single-arm, N=30)
All patients (disitamab vedotin + gemcitabine) | 30
RC+PLND (EFS) | not reached
Non-RC (EFS) | 36 months
P: P=0.026 (EFS RC+PLND vs Non-RC)
Landmark rates:
12 mo: All (EFS) 92.9% | All (OS) 96.7%
24 mo: All (EFS) 85% | All (OS) 92.8%
36 mo: All (EFS) 67.2% | All (OS) 86.6%
[Slide 4]
A phase III RCT for RC48+Gemcitabine VS. RC48+Toripalimab (NCT07693959)—Recruiting in China
GUARD-02
High suspicion of MIBC in outpatient setting. → Imaging, perform biopsy or TURBT. → informed → Open-label; Centralized randomization.
samples: tumor tissue, blood. ← Whole Exome Sequencing; ctDNA examination
Neoadjuvant phase
RC48: 2 mg/kg, IV, Day 1; Gemcitabine: 1000 mg/m², IV, Day 2. 14-day cycle for 4-6 cycles.
RC48: 2 mg/kg, IV, Day 1; Toripalimab: 3 mg/kg, IV, Day 2. 14-day cycle for 4-6 cycles.
ctDNA examination; samples: blood. Imaging assessment
Pathological response assessment → RC+PLND*; Refuse RC → TMT N<20
Record tumor recurrence, metastasis, and death events. → pelvic and chest imaging q6 m.; cystoscopy q3 m; pelvic and chest imaging q6 m.
*note:Adjuvant therapy only for poor pathological downstaging.
Inclusion Criteria:
1. T2-T4aNxM0;
2. HER2 1-3+ by immunohistochemistry;
3. Histopathologically confirmed urothelial carcinoma as the predominant component;
4. Medically eligible for and willing to undergo RC with PLND;
5. Intolerance to or refusal of cisplatin-based neoadjuvant chemotherapy.
Exclusion Criteria:
1.Prior systemic chemotherapy, immune checkpoint inhibitors, or antibody-drug conjugate therapy within the past 6 months;
2.Known hypersensitivity to the investigational drugs or their components;
3.Currently lactating or pregnant;
4.Severe and uncontrolled concurrent medical conditions.
I. Stratification Factors: TNM stage, HER2.
II. Randomization: Central system randomization.
III. Independent Data Monitoring Committee.
Primary Endpoint:
Pathological complete response ([illegible red text]).
Secondary Endpoints:
TRAEs ≥ Grade 3 in the neoadjuvant phase ([illegible red text]), event-free survival, overall survival, etc.
A Phase II Multicenter Study of Neoadjuvant Disitamab Vedotin Combined with Gemcitabine in MIBC Patients with HER2 2-3+: Interim Prognostic Outcomes
Daniel Castellano@cdanicas
1) Slide: EV-103 cohorts DE, A and K long-term follow-up title/author slide (Maroto Rey, ESMO 2026) · 2) Kaplan-Meier survival data: EV-103 overall survival, pooled DE/A/K EV+P vs EV monotherapy
@OncoAlert @myESMO @urotoday @tompowles1 @GuardConsortium @PGrivasMDPhD 🎯 #ESMO2026 Long-term follow-up analysis from EV-103 cohorts Dose Escalation, A and K ! @Maroto5Pablo
In 1L unfit mUC with long mOS @OncoAlert @myESMO @urotoday @tompowles1 @GuardConsortium https://t.co/hku7ov0Gjq
[Slide 1]
Enfortumab vedotin with or without pembrolizumab as first-line treatment for cisplatin-ineligible locally advanced or metastatic urothelial carcinoma: Long-term follow-up analysis from EV-103 cohorts Dose Escalation, A and K
Jose Pablo Maroto Rey,1 Peter H. O'Donnell,2 Terence W. Friedlander,3 Matthew I. Milowsky,4 Daniel Petrylak,5 Christopher J. Hoimes,6 Thomas W. Flaig,7 Shilpa Gupta,8 Nataliya Mar,9 Helen H. Moon,10 Rana R. McKay,11 Sandy Srinivas,12 Saby George,13 Mehmet Asim Bilen,14 Delphine Borchiellini,15 Abhishek Bavle,16 Jasmine Lichfield,17 Yalin Zhu,18 Changting Meng,18 Jonathan E. Rosenberg19
1Hospital de la Santa Creu i Sant Pau, Barcelona, Spain; 2University of Chicago, Chicago, IL, USA; 3UCSF Medical Center, San Francisco, CA, USA; 4University of North Carolina Lineberger Comprehensive Cancer Center, Chapel Hill, NC, USA; 5Yale Cancer Center, New Haven, CT, USA; 6Duke Cancer Institute, Durham, NC, USA; 7Division of Medical Oncology, Colorado University School of Medicine, Aurora, CO, USA; 8Cleveland Clinic Taussig Cancer Institute, Cleveland, OH, USA; 9University of California Irvine, Irvine, CA, USA; 10Kaiser Permanente Southern California, Riverside, CA, USA; 11UC San Diego, San Diego, CA, USA; 12Stanford University Medical Center, Stanford, CA, USA; 13Roswell Park Comprehensive Cancer Center, Buffalo, NY, USA; 14Winship Cancer Institute of Emory University, Atlanta, GA, USA; 15Centre Antoine Lacassagne, Université Côte d'Azur, Nice, France; 16Merck & Co., Inc., Rahway, NJ, USA; 17Astellas Pharma Europe Ltd, UK; 18Pfizer Inc., Bothell, WA, USA; 19Memorial Sloan Kettering Cancer Center, New York, NY, USA
[Slide 3]
Median OS was 27.7 months in the pooled DE/A/K EV+P cohort
Pooled DE/A/K EV+P cohort
Events/n 83/121 | Median OS (95% CI), mo 27.7 (20.9, 39.6)
Landmark labels: 24 mo 52.9% (43.6, 61.3); 48 mo 38.8% (30.2, 47.4); 60 mo 33.0% (24.6, 41.6); 84 mo 28.2% (19.6, 37.4)
No. at risk | 0 | 5 | 10 | 15 | 20 | 25 | 30 | 35 | 40 | 45 | 50 | 55 | 60 | 65 | 70 | 75 | 80 | 85 | 90 | 95 | 100
| 121 | 112 | 103 | 87 | 75 | 62 | 59 | 55 | 50 | 47 | 45 | 38 | 26 | 18 | 16 | 14 | 14 | 12 | 3 | 1 | 0
EV monotherapy cohort
Events/n 54/73 | Median OS (95% CI), mo 22.8 (16.3, 28.4)
Landmark labels: 24 mo 46.4% (34.6, 57.3); 48 mo 25.5% (16.0, 36.2); 60 mo 23.9% (14.6, 34.5)
No. at risk: 73 70 61 57 51 48 44 40 33 28 23 22 21 19 18 18 16 12 9 6 4 3 1 0 [small print; unverified]
• 56.2% of patients in the pooled EV+P cohort and 72.6% in the EV monotherapy cohort had subsequent systemic therapya
– PD-(L)1 inhibitor–containing therapy was administered in 23.1% of all patients in the pooled EV+P cohort and 42.5% of all patients in the EV monotherapy cohort
Data cutoff: February 20, 2026. aIncludes systemic therapies received after discontinuation of study treatment that were not for progressive disease, maintenance use, or secondary malignancy.
DE, dose escalation; EV, enfortumab vedotin; OS, overall survival; P, pembrolizumab.
Presented by: Dr. Jose Pablo Maroto Rey
Survival table
Endpoint: Overall survival
Arm | N | Median | Median CI
Pooled DE/A/K EV+P | 121 | 27.7 mo | 20.9, 39.6
EV monotherapy | 73 | 22.8 mo | 16.3, 28.4
Landmark rates:
24 months [?]: Pooled DE/A/K EV+P 52.9% (CI 43.6, 61.3) | EV monotherapy 46.4% (CI 34.6, 57.3)
48 months [?]: Pooled DE/A/K EV+P 38.8% (CI 30.2, 47.4) | EV monotherapy 25.5% (CI 16.0, 36.2)
60 months: Pooled DE/A/K EV+P 33.0% (CI 24.6, 41.6) | EV monotherapy 23.9% (CI 14.6, 34.5)
84 months [?]: Pooled DE/A/K EV+P 28.2% (CI 19.6, 37.4)
Zach Klaassen@zklaassen_md
1) Slide: PFS by disease volume: darolutamide + ADT vs ADT (CHAARTED), mHSPC subgroup analysis · 2) Slide: OS by disease volume: darolutamide + ADT vs ADT (CHAARTED), mHSPC subgroup analysis · 3) Slide: Time to mCRPC by disease volume: darolutamide + ADT vs ADT (CHAARTED), mHSPC subgroup analysis · 4) Slide: rPFS by disease volume: darolutamide + ADT vs ADT (CHAARTED), mHSPC subgroup analysis
Daro + ADT in mHSPC by disease volume: Subgroup analyses from ARASEC #ESMO26 @urotoday
All endpoints favored Daro + ADT vs ADT
📌PFS: HVL HR 0.28, 95% CI 0.19–0.41; LV: HR 0.21, 95% CI 0.10–0.44
📌OS: HV: HR 0.51, 95% CI 0.30–0.88; LV: HR 0.31, 95% CI 0.09–1.10
📌TT mCRPC: HV: HR 0.27, 95% CI 0.18–0.40; LV: HR 0.14, 95% CI 0.06–0.33
📌rPFS: HV: HR 0.24, 95% CI 0.14–0.41; LV: HR 0.44, 95% CI 0.19–0.99
[Slide 1]
PFS
High volume‡
Events, n (%): 37 (38.1) — Time to event, median (95% CI): NR (22.6–NR) [Darolutamide + ADT]
Events, n (%): 76 (83.5) — Time to event, median (95% CI): 9.1 months (6.4–11.6) [ADT (CHAARTED)]
HR 0.28, 95% CI 0.19–0.41
Legend: Darolutamide + ADT; ADT (CHAARTED)
Y-axis: PFS probability; X-axis: Months
Patients at risk, n (months 0,3,6,9,12,15,18,21,24,27,30,33)
Darolutamide + ADT: 97, 94, 89, 80, 70, 61, 54, 51, 48, 30, 19, 10
ADT CHAARTED: 91, 79, 57, 45, 34, 30, 25, 19, 12, 11, 4, 3
Low volume‡
Events, n (%): 9 (14.3) — Time to event, median (95% CI): NR (NR–NR) [Darolutamide + ADT]
Events, n (%): 35 (50.7) — Time to event, median (95% CI): 22.7 months (15.9–NR) [ADT (CHAARTED)]
HR 0.21, 95% CI 0.10–0.44
Legend: Darolutamide + ADT; ADT (CHAARTED)
Patients at risk, n (months 0,3,6,9,12,15,18,21,24,27,30,33)
Darolutamide + ADT: 63, 62, 60, 60, 59, 58, 56, 53, 46, 24, 14, 6
ADT CHAARTED: 69, 66, 60, 56, 49, 43, 41, 32, 29, 19, 10, 5
Survival table
Endpoint: PFS
Arm | N | Median | Median CI
High volume: Darolutamide + ADT | 97 | NR | 22.6–NR
High volume: ADT (CHAARTED) | 91 | 9.1 months | 6.4–11.6
Low volume: Darolutamide + ADT | 63 | NR | NR–NR
Low volume: ADT (CHAARTED) | 69 | 22.7 months | 15.9–NR
HR: High volume 0.28; Low volume 0.21
HR CI: High volume 0.19–0.41; Low volume 0.10–0.44
[Slide 2]
OS
High volume‡
Events, n (%): 19 (19.6) — Time to event, median (95% CI): NR (34.4 months–NR) [Darolutamide + ADT]
Events, n (%): 47 (51.7) — Time to event, median (95% CI): 40.7 months (29.8–NR) [ADT (CHAARTED)]
HR 0.51, 95% CI 0.30–0.88
Legend: Darolutamide + ADT; ADT (CHAARTED)
Y-axis: OS probability; X-axis: Months
Patients at risk, n (months 0,3,6,9,12,15,18,21,24,27,30,33,36,39,42)
Darolutamide + ADT: 97, 95, 92, 90, 84, 81, 75, 70, 66, 49, 30, 15, 8, 2, 1
ADT CHAARTED: 91, 89, 87, 85, 83, 75, 71, 65, 63, 59, 52, 45, 43, 41, 37
Low volume‡
Events, n (%): 3 (4.8) — Time to event, median (95% CI): NR (NR–NR) [Darolutamide + ADT]
Events, n (%): 15 (21.7) — Time to event, median (95% CI): NR (NR–NR) [ADT (CHAARTED)]
HR 0.31, 95% CI 0.09–1.10
Legend: Darolutamide + ADT; ADT (CHAARTED)
Patients at risk, n (months 0,3,6,9,12,15,18,21,24,27,30,33,36,39,42)
Darolutamide + ADT: 63, 62, 60, 60, 59, 59, 57, 56, 54, 36, 22, 12, 3, 0, 0
ADT CHAARTED: 69, 69, 68, 68, 67, 65, 63, 60, 59, 58, 55, 52, 50, 48, 46
Survival table
Endpoint: OS
Arm | N | Median | Median CI
High volume: Darolutamide + ADT | 97 | NR | 34.4 months–NR
High volume: ADT (CHAARTED) | 91 | 40.7 months | 29.8–NR
Low volume: Darolutamide + ADT | 63 | NR | NR–NR
Low volume: ADT (CHAARTED) | 69 | NR | NR–NR
HR: High volume 0.51; Low volume 0.31
HR CI: High volume 0.30–0.88; Low volume 0.09–1.10
[Slide 3]
Time to mCRPC
High volume‡
Events, n (%): 36 (37.1) — Time to event, median (95% CI): NR (24.7 months–NR) [Darolutamide + ADT]
Events, n (%): 75 (82.4) — Time to event, median (95% CI): 9.1 months (6.4–11.7) [ADT (CHAARTED)]
HR 0.27, 95% CI 0.18–0.40
Legend: Darolutamide + ADT; ADT (CHAARTED)
Y-axis: Event-free probability; X-axis: Months
Patients at risk, n (months 0,3,6,9,12,15,18,21,24,27,30,33)
Darolutamide + ADT: 97, 94, 89, 79, 70, 61, 54, 51, 48, 30, 19, 10
ADT CHAARTED: 91, 78, 57, 45, 34, 30, 25, 19, 12, 11, 4, 3
Low volume‡
Events, n (%): 6 (9.5) — Time to event, median (95% CI): NR (NR–NR) [Darolutamide + ADT]
Events, n (%): 35 (50.7) — Time to event, median (95% CI): 22.7 months (15.9–NR) [ADT (CHAARTED)]
HR 0.14, 95% CI 0.06–0.33
Legend: Darolutamide + ADT; ADT (CHAARTED)
Patients at risk, n (months 0,3,6,9,12,15,18,21,24,27,30,33)
Darolutamide + ADT: 63, 61, 60, 59, 59, 58, 56, 52, 46, 24, 14, 6
ADT CHAARTED: 69, 66, 60, 56, 49, 43, 41, 32, 29, 19, 10, 5
Survival table
Endpoint: Time to mCRPC
Arm | N | Median | Median CI
High volume: Darolutamide + ADT | 97 | NR | 24.7 months–NR
High volume: ADT (CHAARTED) | 91 | 9.1 months | 6.4–11.7
Low volume: Darolutamide + ADT | 63 | NR | NR–NR
Low volume: ADT (CHAARTED) | 69 | 22.7 months | 15.9–NR
HR: High volume 0.27; Low volume 0.14
HR CI: High volume 0.18–0.40; Low volume 0.06–0.33
[Slide 4]
rPFS
High volume‡
Events, n (%): 17 (17.5) — Time to event, median (95% CI): NR (NR–NR) [Darolutamide + ADT]
Events, n (%): 57 (62.6) — Time to event, median (95% CI): 18.2 months (12.1–23.2) [ADT (CHAARTED)]
HR 0.24, 95% CI 0.14–0.41
Legend: Darolutamide + ADT; ADT (CHAARTED)
Y-axis: rPFS probability; X-axis: Months
Patients at risk, n (months 0,3,6,9,12,15,18,21,24,27,30,33,36)
Darolutamide + ADT: 97, 94, 88, 84, 75, 64, 59, 54, 36, 20, 14, 6, 1
ADT CHAARTED: 91, 83, 71, 58, 50, 42, 39, 32, 28, 27, 24, 22, 19
Low volume‡
Events, n (%): 8 (12.7) — Time to event, median (95% CI): NR (NR–NR) [Darolutamide + ADT]
Events, n (%): 22 (31.9) — Time to event, median (95% CI): NR (NR–NR) [ADT (CHAARTED)]
HR 0.44, 95% CI 0.19–0.99
Legend: Darolutamide + ADT; ADT (CHAARTED)
Patients at risk, n (months 0,3,6,9,12,15,18,21,24,27,30,33,36)
Darolutamide + ADT: 63, 61, 60, 60, 59, 58, 56, 44, 32, 18, 9, 3, 0
ADT CHAARTED: 69, 68, 65, 63, 60, 56, 53, 49, 47, 44, 42, 40, 38
Survival table
Endpoint: rPFS
Arm | N | Median | Median CI
High volume: Darolutamide + ADT | 97 | NR | NR–NR
High volume: ADT (CHAARTED) | 91 | 18.2 months | 12.1–23.2
Low volume: Darolutamide + ADT | 63 | NR | NR–NR
Low volume: ADT (CHAARTED) | 69 | NR | NR–NR
HR: High volume 0.24; Low volume 0.44
HR CI: High volume 0.14–0.41; Low volume 0.19–0.99
Axel S. Merseburger@amerseburger
Slide: Poster 2274P: Prevalence of pathogenic germline variants across age in metastatic prostate cancer
Happy to see some posters with good visuals and less text 📚I can remember and understand in 5 minutes poster walk 🚶 at @myESMO #ESMO26
Take home: BRAC-1/2 not more prevalent in young men @OncoAlert https://t.co/C3uhYLxy2n
2274P
Prevalence of pathogenic germline variants (PGVs) across age in metastatic prostate cancer (mPC)
S. Brown-Araujo¹, D. Tello¹, A. Jambrina², M. Alonso¹, M. Balongo², I. Gonzalez-Ginel¹,⁴, T. Pineda¹, J. Esteban-Villarrubia²,³, M. Ovejero¹, P. Iglesias¹, P. Diaz², N. Lorente², J.M. Sanchez²,⁵, B. Hidalgo⁵, J. Funes², P. Lopez-Casas¹, A. Rodriguez-Antolin⁴, D. Castellano³, D. Olmos¹,³, E. Castro²,³
¹Genomics and Therapeutics of prostate Cancer, Instituto de Investigación Hospital 12 de Octubre. ²Translational Cancer Genetics group, Instituto de Investigación Hospital 12 de Octubre. ³Oncology department, Hospital Universitario 12 de Octubre. ⁴Urology Department, Hospital Universitario 12 de Octubre. ⁵Hereditary Cancer Laboratory, Clinical Biochemistry Department. Hospital Universitario 12 de Octubre
1. BACKGROUND
• Germline testing is recommended for all mPC patients irrespective of age, family history or tumour characteristics.
• In other malignancies, early-onset and de novo disease are enriched for PGVs, and younger patients are often priorised for testing.
• Whether early-onset prostate cancer (<55y) truly shows increased PGV frequency has not been established.
2. OBJECTIVES
• Evaluate the prevalence of germline PGVs in mPC according to age.
• Assess whether age, de novo or recurring disease are associated with PGV frequency.
3. STUDY COHORT
1,036 mPC patients
Age groups (years): <55 n=99 (9.6%); 55-65 n=326 (31.5%); 65-75 n=402 (38.8%); >75 n=209 (20.2%)
de novo mPC (56.8%); Recurrent mPC (43.1%)
Targeted sequencing of 11 genes recommended by ASCO for germline testing in PC: BRCA1, BRCA2, EPCAM, HOXB13, MLH1, MSH2, MSH6, PMS2, ATM, CHEK2 AND PALB2
4. METHODS
Germline DNA extraction, library preparation & hybridisation capture → Targeted sequencing (Illumina sequencing; ASCO recommended gene panel) → Variant calling & classification (ACMG criteria) → PGV definition: Pathogenic / Likely pathogenic = PGV carrier
5. RESULTS
5.1 Overall PGV Prevalence: 5.31% (n=55)
Gene | % (n)
BRCA2 | 2.70% (28)
CHEK2 | 0.87% (9)
ATM | 0.77% (8)
PALB2 | 0.29% (3)
BRCA1 | 0.29 (3)
MSH2 | 0.19% (2)
PMS2 | ≤0.1% (1)
MSH6 | ≤0.1% (1)
5.2 PGV prevalence by presentation: p > 0.5 (Fisher's test); de novo 5.43%; Recurrent 5.15%
5.3 PGV prevalence by age group: <55 5.05% (n=5); 55-65 7.67% (n=25); 65-75 5.22% (n=21); >75 1.91% (n=4); Overall: 5.31%
• No significant trend across age groups (Cochran-Armitage p=0.24)
• ≤55 vs >55: 5.05% vs 5.5% (Fisher's test p>0.5)
• ≤75 vs >75: lower prevalence in >75 (Fisher's test p = 0.04)
6. KEY FINDINGS
Overall PGV prevalence 5.31%
BRCA2 most frequent 2.70%
Similar de novo vs recurrent 5.48% vs 5.15% (p > 0.5)
No significant age trend p = 0.24 (Cochran-Armitage)
7. CONCLUSIONS
→Age at diagnosis was not significantly as[sociated with PGV] prevalence in mPC. [partly obscured]
→No enrichment in PGVs was observed [in de] novo cases.
→The reduced prevalence in patients [>75 did not translate] into a significant overall trend. [partly obscured]
→Overall PGV prevalence aligns with [obscured]
Age and timing of metastasis [are not] predictors of PGV carrier status [and] support germline testing acros[s ...] [obscured by presenter]
Presenting author: sbrown.imas12@h12o.es
Funding: This work was funded by Fundación CRIS Contra el Cáncer
Disclosures: Authors declare no conflicts of interest
Presented at the European Society for Medical [Oncology] ... 22-27 October
Zach Klaassen@zklaassen_md
1) Trial design schema: EV-309 (TiP) Figure 1: Study design - EV+P vs cCRT for bladder preservation · 2) Trial design schema: EV-309 (TiP) enrollment site map - Active vs Planned countries
TiP EV-309: Open-Label, Randomized, Ph 3 RCT of EV+P for Bladder Preservation in MIBC #ESMO26 @urotoday @MattGalsky
📌n=390; cT2-T4aN0M0 ≥50% UC histology
📌1:1 to 9 cycles of EV+P --> 8 cycles of Pembro vs concurrent chemoRT for 4 or 6.5 weeks
📌Dual primary EPs: BI-EFS by BICR, OS
📌Currently recruiting 🇺🇸🇨🇦🇰🇷
[Slide 1]
Figure 1. Study design
Patient population (N≈390)
- MIBC (cT2-T4aN0M0)
- No prior systemic therapy or radiotherapy
- ECOG PS 0-2
- Eligible for cCRT
- Fit for systemic therapy and ineligible for or elect not to undergo cystectomy
Max TURBT
R 1:1
Arm 1: EV 1.25 mg/kg IV Q3W on Days 1 and 8; Pembrolizumab 200 mg IV Q3W on Day 1 (9 cycles) -> Pembrolizumab 200 mg IV Q3W on Day 1^a (8 cycles)
Arm 2: cCRT^b 4 or 6.5 weeks
-> Long-term follow-up
- Years 1-2, Q12W; Q24W thereafter: tumor response assessment via imaging, cystoscopy ± biopsy, urine cytology, and repeated TURBT as clinically indicated
- Survival follow-up
Randomization stratification factors
- Tumor stage (cT2 vs cT3-T4a)
- Cystectomy eligibility (ineligible vs eligible but elect not to undergo)
- Geographic region (North America vs Europe vs rest of world)
[Slide 2]
[World map showing trial site countries]
Legend: Active (dark blue) - United States, Canada, South Korea
Planned (light blue) - e.g. United Kingdom, France, Spain, Germany, Italy, Türkiye, China, Japan, Taiwan, Brazil, Argentina
Active
Planned
[Slide 1]
ACCOMPLISH Study design
Open-label, multicenter, single-arm, investigator-initiated phase II trial
Key Eligibility Criteria
- Age ≥ 19 years
- Locally advanced or metastatic ACC
- Previously received both cisplatin- and mitotane-based chemotherapy*
- measurable disease according to RECIST v1.1
- ECOG PS 0-1
- No previous immune checkpoint inhibitor and/or VEGF inhibitor
*Patients were required to discontinue mitotane before study treatment
N=30
Study Treatment
Lenvatinib 20 mg once daily orally Plus Pembrolizumab 200 mg iv. Every 3 weeks (maximum 35 cycles)
Until disease progression, unacceptable adverse events, or patient withdrawal
Endpoints
Primary
- ORR according to RECIST v1.1 (by investigator)
Secondary
- PFS (by investigator)
- OS
- Safety profile
NCT05036434. Data cut-off: 6 Mar, 2026
Hypothesis and sample size determination
- Simon's optimal two-stage design
- Null ORR 10%(P0) vs. target ORR 30% (P1), α=0.05 and 80% power
- Stage 1: 10 patients; ≥2 responses required to proceed to stage 2 (19 additional patients)
- Planned enrollment: 30 (29 evaluable, allowing of 5% drop-out)
- Primary endpoint met if ≥6 of 29 evaluable patients achieve an object response.
[Slide 2]
Conclusion
- ACCOMPLISH met its primary endpoint, with a confirmed ORR of 27% (8 of 30 patients; 95% CI 12-46%). Lenvatinib plus pembrolizumab demonstrated meaningful antitumor activity in advanced ACC after mitotane and platinum-based chemotherapy.
- The safety profile was consistent with previous reports of this combination, and no new safety signals were identified.
- These results support lenvatinib plus pembrolizumab as a potential treatment option in this setting.
[Slide 3]
Secondary Endpoints
Adverse Events Overview
Adverse events summary
AE | N (%)
Any AE | 30 (100.0)
Grade ≥3 AE | 23 (76.7)
Serious AE | 11 (36.7)
AEs leading to death (grade 5 AE) | 1 (3.3)*
AE leading to interruption of drugs
Any | 22 (73.3)
Both | 8 (26.7)
Lenvatinib | 22 (73.3)
Pembrolizumab | 9 (30.0)
AE leading to discontinuation of drugs
Any | 0 (0.0)
AEs leading to dose reduction for lenvatinib | 19 (63.3)
*Grade 5 pneumonia (not related to study drugs by investigator's assessment)
Adverse events occurring in ≥15% of patients)
Adverse Event | Any grade | Grade 3-4
Mucositis oral | 17 (56.7) | 1 (3.3)
Proteinuria | 17 (56.7) | 5 (16.7)
Hypertension | 17 (56.7) | 8 (26.7)
Hypothyroidism | 12 (40.0) | 0 (0.0)
Fatigue | 11 (36.7) | 0 (0.0)
Diarrhea | 9 (30.0) | 1 (3.3)
Anorexia | 9 (30.0) | 3 (10.0)
Platelet count decreased | 8 (26.7) | 3 (10.0)
Fever | 7 (23.3) | 0 (0.0)
Nausea | 7 (23.3) | 0 (0.0)
Constipation | 6 (20.0) | 0 (0.0)
Aspartate aminotransferase increased | 6 (20.0) | 2 (6.7)
Abdominal pain | 5 (16.7) | 1 (3.3)
[Slide 4]
Results: Primary Endpoint ORR (Investigator Assessed)
Best Overall Response | n (%)
Complete Response (CR) | 0 (0)
Partial Response (PR) | 8 (27)*
Stable Disease (SD) | 20 (67)
- of which unconfirmed PR | 1 (3)
Progressive Disease (PD) | 2 (7)
Objective Response Rate, % (n/N; 95% CI) | 27% (8/30; 12-46%)
Disease Control Rate, % (n/N) | 93% (28/30)
*Note: The submitted abstract reported 9 responses based on unconfirmed best response. The protocol-specified confirmation requirement (RECIST 1.1) was not applied at the time of abstract preparation; with confirmation applied, 8 responses were confirmed. The updated results are presented with the agreement of the ESMO Scientific Programmes Office.
**Computed using the Clopper-Pearson method
Abbreviations: 95% CI, 95% confidence interval
Waterfall plot [Best Change in Target Lesion from Baseline (%) by Patients; Best Overall Response PR / SD / PD; * Unconfirmed PR]
Syed A Hussain@ProfSyedHussain
1) Slide: ADC/molecular target expression across urothelial carcinoma molecular subtypes · 2) Slide: Hussain discussant slides on 1L advanced urothelial cancer
It was my pleasure & privilege to be part of the ESMO 2026 faculty. Enjoyed role to co-chair the session @MariaJRibal & @BrittSuelmann Great abstracts & presentations. @Mariadesantis @Andreanecchi @MattGalsky @MyEsmo Enjoyed discussing exciting abstracts#NIAGARA #GDFATHER -Neo https://t.co/d5ni3Qgqf1
# 3309eP
Molecular Co-Occurrence and Mutual Exclusivity Patterns in Prostate Cancer: Insights from a Prospective Real-World Genomic Database WAYFIND-R.
Authors: Martin Angel1*; Lucas E. Coradini1; Federico Losco1; Florencia Tsou1; Juan Pablo Sade
1: Medical Oncologist. Instituto Alexander Fleming, Buenos Aires, Argentina mangel@alexanderfleming.org *Principal investigator of WAYFIND-R trial.
INTRODUCTION: Molecular profiling has become an integral component of precision oncology in prostate cancer, particularly in advanced disease, where the identification of actionable alterations may inform the use of targeted therapies and refine prognostic assessment. Genomic alterations involving androgen receptor signaling, tumor suppressor genes, homologous recombination repair, and mismatch repair define biologically relevant subgroups; however, these events do not occur in isolation. Their patterns of co-occurrence may reflect cooperating pathways that contribute to tumor progression, whereas mutual exclusivity may identify distinct molecular lineages, redundant oncogenic mechanisms, or biologically incompatible genomic states. Characterizing these relationships in real-world populations may therefore improve the interpretation of complex molecular reports. The aim of this analysis was to identify patterns of co-occurrence and mutual exclusivity among predefined molecular alteration groups in patients with prostate cancer included in the prospective WAYFIND-R real-world genomic database.
Methods: Data were prospectively collected from the WAYFIND-R database. Patients were stratified into 7 groups according to the predominant molecular profile: G0_SPOP, G1_AR, G2_TumorSuppressorGenes, G3_HRR, G4_MMR, G5_CHIP, and G6_Other.
Results:
97 patients profiled ; 533 of 904 screened genes (59%) harbored a detectable mutation across the cohort; 41% showed no mutation detected in the tested panel.
G2_Tumor Suppressors was the most frequent clinically relevant subgroup (48.4%), followed by G3_HRR (35.0%).
CONCLUSION
TumorSuppressorGenes appear to act as a common molecular denominator, suggesting that tumor suppressor gene alterations may represent a common genomic background upon which additional molecular events accumulate. Robust patterns of mutual exclusivity were not observed across most molecular subgroups, except SPOP ↔ CHIP relationship. The presence of CHIP mutations in nearly 20% of patients represents a clinically relevant finding that should be considered to avoid false-positive interpretation of somatic tumor variants.
We want to thanks all the WAYFIND-R´s patients and their families
CO-OCCURRENCE MATRIX [colored heatmap; cell values illegible]
OVERALL MUTATION DETECTION RATE [bar chart, Mutated patients (n)]: TP53 52; AR 24; PTEN 16; BRCA2 15; DNMT3A 14; ATM 11; TET2 10; ASXL1 9; CHEK2 8; CDK12 8; RB1 8; BRCA1 7
[References footnote illegible]
Dra. María Natalia Gandur Quiroga@nataliagandur
1) Slide: Ana Aparicio — Determinants of ADC Activity (New targets in prostate cancer) · 2) Slide: Ana Aparicio — Target Features · 3) Slide: Ana Aparicio — Inter- and Intratumoral Heterogeneity of Prostate Cancer · 4) Slide: Ana Aparicio — Cell State Dependence of Target Expression
🚨⭐🔵 #ESMO26 | New Targets in Prostate Cancer: ADCs & Emerging Biologies
🎤 Presented by Ana Aparicio 🇺🇸 | MD Anderson Cancer Center
@OncoAlert
🔬 ADCs in mCRPC: Is choosing the right target enough, or does the construct matter just as much?
A fascinating overview of the next generation of antibody-drug conjugates in #ProstateCancer.
🧬 1️⃣ WHAT DETERMINES ADC ACTIVITY?
ADC efficacy depends on much more than antigen expression:
🔹 Target density and inter/intratumoral heterogeneity
🔹 Antigen shedding and internalization
🔹 Intracellular trafficking
🔹 Antibody, linker, payload and drug-to-antibody ratio (DAR)
🔹 Bystander effect
🔹 Tumor microenvironment and resistance mechanisms
📌 Target expression is dynamic—not a fixed biological property.
🎯 2️⃣ PHASE III: B7-H3 ADCs MOVE FORWARD
Two major randomized trials are evaluating B7-H3-directed ADCs against docetaxel in mCRPC:
✅ IDeate-Prostate01
NCT06925737 | N=1,440
• Ifinatamab deruxtecan (I-DXd)
• B7-H3-directed ADC
• Topoisomerase I inhibitor payload
• DAR 4
✅ BNT324-03
NCT07365995 | N=736
• BNT324 (DB-1311)
• B7-H3-directed ADC
• Topoisomerase I inhibitor payload
• DAR 6
🔬 These studies will help determine whether ADCs can improve outcomes over taxane chemotherapy.
💥 3️⃣ ABBV-969: A BISPECIFIC ADC TARGETING PSMA + STEAP1
A particularly innovative approach designed to address heterogeneous target expression.
Phase I | N=49 heavily pretreated patients with mCRPC.
📊 At doses ≥3 mg/kg:
✅ Confirmed PSA50 response: 67%
✅ Confirmed PSA90 response: 28%
✅ Confirmed ORR: 45% among 29 RECIST-evaluable patients
⚠️ Grade ≥3 treatment-emergent AEs: 63%, predominantly anemia.
📌 Encouraging antitumor activity, including in patients previously treated with taxanes and radioligand therapy, but still early-phase evidence.
🧬 4️⃣ EMERGING TARGETS: STEAP2 & CD46
🔹 STEAP2: Potentially favorable and relatively homogeneous expression across prostate cancer progression.
🔹 CD46: Broadly expressed membrane protein with internalization properties that may be exploited therapeutically.
Both represent interesting opportunities for ADC development, although expression and biological rationale alone cannot establish clinical efficacy.
🔬 CONCLUSION
The ADC landscape in prostate cancer is expanding beyond single-target approaches.
Bispecific constructs, novel payloads and strategies addressing tumor heterogeneity may help overcome resistance.
⭐ MY POINT OF VIEW | CLINICAL PEARL
The future of ADC therapy in prostate cancer will not be determined by identifying the most highly expressed antigen alone.
What matters is the interaction between:
🎯 The right target
🧬 The right construct
💊 The right payload
👤 The right patient
💡 A highly expressed target does not guarantee an effective ADC—and heterogeneous expression does not necessarily preclude response.
The challenge is to translate molecular targeting into durable survival benefit with an acceptable therapeutic index.
📌 For now, these agents remain investigational. Randomized efficacy, safety and biomarker data will determine their place in clinical practice.
@urologysummit @gbanna74 @ravikanesvaran @Uromigos @LosUromigos
@neerajaiims @Silke_Gillessen @EfstathiouEleni @AOmlin @declangmurphy @DrJaVallejo @cdanicas @montypal @apolo_andrea
@ecancer @UrologyTimes @urotoday @wearemedsir @OpenMedicineHQ
#ProstateCancer #mCRPC #ADC #PrecisionOncology #GUOncology
[Slide 1]
Determinants of ADC Activity
Pharmacokinetics | Tumor penetration | Target recognition | Intracellular trafficking | Payload | TME modulation | Resistance
Antibody
Linker
Payload
Drug-to-Antibody-Ratio (DAR)
Bystander effect
Mosele et al. Nature Medicine (2026); Lin et al. npj Precis Onc (2025); Tsuchikama et al. Nat Rev Clin Oncol (2024)
Ana Aparicio, MD
[Speaker panel: Ana Aparicio — New targets (ADCs, new biologies)]
[Slide 2]
Target Features
Cell surface density | Intratumoral density | Intertumoral heterogeneity | Normal tissue expression / Antigen shedding
Mosele et al. Nature Medicine (2026); Lin et al. npj Precis Onc (2025); Tsuchikama et al. Nat Rev Clin Oncol (2024)
Ana Aparicio, MD
[Slide 4]
Cell State Dependence of Target Expression
AR Activity/Sensitivity → Lineage Promiscuity
KLK2 PSMA
STEAP1 STEAP2
B7H3 TROP2
HER3 CD46
CEACAM5 PSCA
NE restricted: DLL3 SEZ6
Sayar et al. Mol Cancer Res (2026); Ajkunic et al. npj Precis Onc (2024); Shen et al. Clin Cancer Res (2025); Zaratt et al. J Clin Invest (2025); Makovec et al. Clin Cancer Res (2026); Busanova et al. Nat Rev Urol (2025); Ashraf et al. Prostate Cancer and Prostatic Diseases (2026)
Ana Aparicio, MD
Andrea Necchi, MD, FASCO@AndreaNecchi
Slide: MIBC radiomic signature external validation: AUC for pCR and pMR versus PURE-01 with ROC
Our own Michela Piacentini presented the external validation cohort findings of AI-assisted MRI imaging for the prediction of response to neoadj therapies in MIBC
- deep features model performed less well in this cohort vs #PURE01 published in @EurUrolOncol
- pre-therapy imaging prediction remains challenging
- post therapy performance of radiomic features was better
Bladder MRI-based tools remains an area of investigation in pts with MIBC
Congrats to the contributors!
@SanRaffaeleMI @MyUniSR @MSKCancerCenter @BrigidaMaiorano @Anto_cigliola @CMercinelli @GiorgioBre Larry Schwartz, Amita Dave et al. @myESMO #ESMO26 @urotoday @OncoAlert
4 Results · Radiomic signatures
0.78
external AUC for pCR (95% CI 0.68-0.87)
0.77
external AUC for pMR (95% CI 0.67-0.86)
0.75-0.76
AUC in the RC-only subset (N=59)
C AUC by cohort, features and weights unchanged from PURE-01
pCR (ypT0): PURE-01 (test) 0,86; External, full (N=97) 0,78; External, RC only (N=59) 0,76
pMR (ypT<2): PURE-01 (test) 0,96; External, full (N=97) 0,77; External, RC only (N=59) 0,75
D ROC curves and calibration in the external cohort
Full cohort (N=97) RC-only subset (N=59) chance / perfect calibration
pCR (ypT0) · ROC (left) and calibration by deciles (right)
AUC (95% CI)
Full: 0.78 (0.68, 0.87)
Cystectomy: 0.76 (0.62, 0.89)
pMR (ypT<2) · ROC (left) and calibration by deciles (right)
AUC (95% CI)
Full: 0.77 (0.67, 0.86)
Cystectomy: 0.75 (0.62, 0.88)
Sensitivity / 1 - Specificity / Observed proportion / Predicted probability
Joaquin Mateo@quimmateo
Slide: BioChiP phase II poster - carboplatin in pretreated mCRPC guided by RAD51 HRD (presenter photo)
The #ESMO2026 poster on our academic trial with carboplatin in mCRPC guided by RAD51-IF HRD status is now up in hall 5A. Come by and chat with @pablo_cresta @VHIO work with @Dolmos77 @H12Octubre https://t.co/pQdfRl1Ezi
Best Poster Award – Advanced ProstateCa at #ESMO26!
BioChiP phase II: Carboplatin 21.5% RR in pretreated mCRPC, higher RR in BRCA1/2-altered or RAD51-defined HRD tumours.
Important implications for biomarker-guided use of affordable treatments in resource-limited settings https://t.co/pbWVhXq3N3
[Photo of presenter standing beside poster; 'BEST POSTER' rosette; board sign METASTATIC PROSTATE CANCER; poster number 2240P]
BioChiP: A phase II, open-label, biomarker-guided study of carboplatin efficacy in pretreated metastatic castration resistant prostate cancer
TAKE HOME MESSAGES
- Without biomarker selection, carboplatin showed a combined response rate of 21.5%.
- Higher response rates were associated with a RAD51-defined HRD phenotype and with BRCA1/2 alterations.
Primary endpoint - Response Rate: 21.5% (95% CI 12.3 - 33.5)
BIOCHEMICAL RESPONSE RATE 16.9% (95% CI 8.8 - 28.3)
RADIOGRAPHIC RESPONSE RATE 22.7% (95% CI 11.5 - 37.8)
Key secondary endpoint - RESPONSE RATE BY RAD51
[Small text, tentative: N=65; Not evaluable 38.5% (25/65); HRP 50.8% (33/65); HRD 10.8% (7/65); RAD51 - HRD n/total 4/7, 57.1%, 95% CI 18.4-90.1; RAD51 - HRP/NE n/total 10/58, 17.2%, 95% CI 8.6-29.4]
Sections visible: Background; Design; Key eligibility criteria; Procedures; Biomarker analyses; Endpoints; Statistical analysis; Conclusions; Acknowledgments; Personal information; Genomic landscape of study population; Patients characteristics; Safety; Secondary endpoints (OVERALL POPULATION / BY RAD51 STATUS: rPFS, CLINICAL PFS, OVERALL SURVIVAL); Exploratory endpoints (BY GENOMIC ALTERATION) - body text and curve values illegible
Zach Klaassen@zklaassen_md
1) Trial design schema: ExBAT (LACOG 0620) study design - alternating BAT testosterone · 2) Kaplan-Meier survival data: ExBAT - rPFS by AR amplification status (KM) · 3) Kaplan-Meier survival data: ExBAT - overall survival by AR amplification status (KM) · 4) Slide: ExBAT - genomic profile (oncoprint) and swimmer plot of individual clinical outcomes
Genomic biomarkers of response to ExBAT alternating Daro and Testosterone in mCRPC: ExBAT Trial (LACOG 0620) @urotoday #ESMO26
No AR amp vs AR amp:
📌rPFS: 8.3 vs 2.9 mos; HR 0.39, 95% CI 0.16–0.94
📌OS: HR 0.19, 95% CI 0.07–0.55
📌Support further eval of BAT-based ARPI sequencing, guided by AR status
[Slide 1]
Phase 2, single-arm, multicenter (8 institutions), open-label trial · N = 51 treated patients
Key eligibility criteria
• Histologically confirmed prostate adenocarcinoma
• Metastatic castration-resistant prostate cancer
• Radiographic, PSA, or clinical progression on or after abiraterone
• Chemotherapy-naïve for mCRPC
• ECOG performance status 0–1
• Archival or fresh tumor tissue and blood available for molecular analyses
Serum testosterone (supraphysiologic -- castrate)
AR blockade
Testosterone cypionate (BAT) | Darolutamide | Washout
Day 1 - Weeks 1–4 | Days 29–56 · Weeks 5–8 | 7 days · Week 9
One cycle = 9 weeks (63 days)
Repeat cycle until progression or unacceptable toxicity
Ongoing LHRH agonist/antagonist maintained throughout treatment
PSA and physical examination every 4 weeks CT abdomen/pelvis and bone scan every 12 weeks
Endpoints
Primary
Rate of radiographic progression-free survival (rPFS) at 12 months (PCWG3), compared with a historical control
Secondary
• Median rPFS and time to progression
• PSA50 response rate
• Overall survival
• Quality of life
• Safety and tolerability
[Slide 2]
Radiographic Progression-Free Survival (%)
Median (95% CI) 8.3m (3.9-NE) [Non-Amplified]
Median (95% CI) 2.9m (1.8-NE) [Amplified]
P-value: 0.0284
HR: 0.39
AR | Events/Total | % 12m rPFS (95% CI) | HR (95% CI)
Amplified | 7/8 | 0.0 (NE-NE%) | Reference
Non-Amplified | 23/38 | 42.3 (26.2-57.6%) | 0.39 (0.16-0.94)
Months
At Risk (0, 2, 4, 6, 8, 10, 12, 14)
Amplified | 8 | 6 | 2 | 2 | 2 | 0
Non-Amplified | 38 | 30 | 22 | 18 | 18 | 16 | 15 | 0
Survival table
Endpoint: Radiographic progression-free survival (by AR amplification status)
Arm | N | Median | Median CI
AR Amplified | 8 | 2.9m | 1.8-NE
AR Non-Amplified | 38 | 8.3m | 3.9-NE
HR: 0.39
HR CI: 0.16-0.94
P: 0.0284
Landmark rates:
12 months: AR Amplified 0.0% (CI NE-NE%) | AR Non-Amplified 42.3% (CI 26.2-57.6%)
[Slide 3]
Overall Survival (%)
12m OS (95% CI) 88.9% (73.0-95.7%) [Non-amplified]
12m OS (95% CI) 50% (15.2-77.5%) [Amplified]
P-value: 0.001
HR: 0.19
AR | Events/Total | Median (95% CI) | HR (95% CI)
Amplified | 6/8 | 11.6 (3.7-NE) | Reference
Non-Amplified | 9/38 | NR (21.6-NE) | 0.19 (0.07-0.55)
Months
At Risk (0, 2, 4, 6, 8, 10, 12, 14)
Amplified | 8 | 8 | 7 | 6 | 6 | 5 | 3 | 2
Non-amplified | 38 | 38 | 37 | 36 | 34 | 32 | 31 | 25
Survival table
Endpoint: Overall survival (by AR amplification status)
Arm | N | Median | Median CI
AR Amplified | 8 | 11.6 | 3.7-NE
AR Non-Amplified | 38 | NR | 21.6-NE
HR: 0.19
HR CI: 0.07-0.55
P: 0.001
Landmark rates:
12 months: AR Non-Amplified 88.9% (CI 73.0-95.7%) | AR Amplified 50% (CI 15.2-77.5%)
[Slide 4]
Genomic Profile and Individual Clinical Outcomes
Genes: AR | TP53 | DNMT3A | PPM1D | TET2 | ASXL1 | TMPRSS2 | MUTYH | ATM | CDK12 | BRCA2 | CHEK2 | Other gene** | Sample
Patient (1–48)
Time from enrollment (months) (0, 5, 10, 15, 20, 25)
Genomic alteration key
Mutation (oncogenic/likely oncogenic) | AR mutation + amplification | Not evaluable
AR amplification (CNV) | Not detected
Swimmer plot key
No PSA decline† | Death
Any PSA decline† | Alive / last contact (censored)
No post-baseline PSA assessment | Radiographic/clinical progression (rPFS event)
Andrea Necchi, MD, FASCO@AndreaNecchi
1) Trial design schema: SURE-02 study design: neoadjuvant sacituzumab govitecan plus · 2) Kaplan-Meier survival data: SURE-02 response and survival: cCR rate, 24-month EFS · 3) Slide: Debora Serafin at the SURE-02 poster 4750P at ESMO 2026
Our own Debora Serafini presented the #SURE02 trial update after @TheLancetOncol publication early this year #ESMO26 @myESMO
- 39% cCR
- 24m median follow-up
- 2y EFS in cCR pts 83.3%; 2y OS 94.4%
- 81.6% started adjuvant pembro, 42.9% completed the adjuvant course
Some severe delayed irTRAE may still occur.
Congratulations to the entire team!
@SanRaffaeleMI @MyUniSR @CMercinelli @BrigidaMaiorano @Anto_cigliola @BasileG_ et al.@urotoday @OncoAlert
[Slide 1]
Methods
Study design (single-centre, single-arm phase 2)
MIBC cT2–T3bN0M0* · ECOG PS 0–1
Cisplatin-ineligible or refusing · scheduled for RC
N = 49
Neoadjuvant SG + Pembro × 4 cycles, Q3W
SG 7.5 mg/kg D1 + D8 · Pembro 200 mg D1
Primary G-CSF prophylaxis
Response assessment: CT + pelvic MRI + cystoscopy; multidisciplinary tumour board
Radical cystectomy
n = 16 (33%)
re-TURBT
n = 29 (59%)
No surgery (progression)
n = 4 (8%)
bladder sparing**
Adjuvant / maintenance Pembro
200 mg Q3W × 13 cycles
Off-protocol systemic therapy
*Four cT4a patients enrolled before the protocol amendment are included in the ITT analysis. **re-TURBT offered after tumour board discussion to patients refusing RC (protocol v5, June 2024). Numbers refer to the ITT population (N = 49).
[Slide 2]
Results: Response and survival
39%
cCR (19/49)
95% CI 25–54
24 mo
median follow-up
(reverse KM; 20–29)
63.8%
24-mo EFS, ITT
95% CI 51.3–79.3
75.1%
24-mo OS, ITT
95% CI 63.8–88.4
Bladder sparing: in the re-TURBT group (n = 29), 5 patients underwent a delayed RC and 3 started salvage chemoradiotherapy. Three intravesical relapses occurred among the 19 patients with cCR.
Survival estimates are from the updated analysis (August 2026) and differ slightly from the submitted abstract.
A EFS, ITT population (N = 49)
B OS, ITT population (N = 49)
24-mo EFS 63.8% (95% CI 51.3–79.3)
24-mo OS 75.1% (95% CI 63.8–88.4)
C EFS by clinical response
D OS by clinical response
No cCR / cCR
Number at risk
Time from therapy (months)
24-mo EFS: cCR 83.3% (67.8–100) vs no cCR 51.7% (36.2–74.1); P = 0.019
24-mo OS: cCR 94.4% (84.4–100) vs no cCR 63.3% (48.2–83.2); P = 0.01
Discussion
Survival table
Endpoint: EFS and OS (24-month landmarks), ITT and by clinical response
ITT (EFS) | 49
ITT (OS) | 49
cCR | 19
no cCR | 30
P: EFS by response P = 0.019; OS by response P = 0.01
24-mo EFS ITT 63.8% (95% CI 51.3–79.3)
24-mo OS ITT 75.1% (95% CI 63.8–88.4)
24-mo EFS cCR 83.3% (67.8–100) vs no cCR 51.7% (36.2–74.1)
24-mo OS cCR 94.4% (84.4–100) vs no cCR 63.3% (48.2–83.2)
[Slide 3]
4750P
Urothelial cancer | ESMO Congress 2026, Madrid, 23–27 October
Overall survival (OS) and mature safety results of SURE-02, a phase 2 study of neoadjuvant sacituzumab govitecan (SG) plus pembrolizumab (Pembro), followed by response-adapted bladder sparing and adjuvant Pembro, in patients with muscle-invasive bladder cancer (MIBC)
Debora Serafin, Giuseppe Basile, Chiara Mercinelli, Brigida A. Maiorano, Antonio Cigliola, Michela Piacentini, Gualtiero Guandalini, Giorgio Brembilla, Enrico Tomasi, Gaia Latini, Maurizio Colecchia, Francesco de Cobelli, Marco Moschini, Alberto Briganti, Jeffrey S. Ross, Francesco Montorsi, Andrea Necchi
Abstract 4750P
Methods
Results: Response and survival
Results: Mature safety
81.6%
42.9%
22.4%
65%
Discussion
Conclusions
Renee Maria Saliby@ReneeSaliby
1) Slide: KEYNOTE-564 final protocol-prespecified analysis title slide (Choueiri et al.) · 2) Kaplan-Meier survival data: KEYNOTE-564 final analysis: OS, ITT population (HR 0.70) · 3) Slide: KEYNOTE-564 AE summary, as-treated population: IA4 vs final analysis
Last (clinical outcome) update from KN564!
At 7yr follow-up, no new safety signal. We already know from prior data cutoffs that this is the FIRST therapy showing OS survival in the adjuvant setting. #RCC paving the way - @DrChoueiri
#ESMO26 @OncoAlert https://t.co/n3yyblFrAh
[Slide 1]
Final Protocol-Prespecified Analysis of the Phase 3 KEYNOTE-564 Trial of Adjuvant Pembrolizumab Versus Placebo in Clear Cell Renal Cell Carcinoma
Toni K. Choueiri1; Piotr Tomczak2; Se Hoon Park3; Balaji Venugopal4; Thomas Ferguson5; Naomi B. Haas6; Yen-Hwa Chang7; Stefan N. Symeonides8; Jae Lyun Lee9; Piotr Sawrycki10; Naveed Sarwar11; Mauricio Mahave12; Howard Gurney13; Marine Gross-Goupil14; Guryjot K. Doshi15; John M. Burke16; Rui Kang17; Joseph E. Burgents17; Priyanka Chablani17; Thomas Powles18
1Dana-Farber Cancer Institute, Lank Center for Genitourinary Oncology at Dana-Farber Cancer Institute, Brigham and Women's Hospital, and Harvard Medical School, Boston, MA, USA; 2Poznan University of Medical Sciences, Poznan, Poland; 3Sungkyunkwan University Samsung Medical Center, Seoul, Republic of Korea; 4The Beatson West of Scotland Cancer Centre and University of Glasgow, Glasgow, United Kingdom; 5Fiona Stanley Hospital, Perth, WA, Australia; 6Abramson Cancer Center, Philadelphia, PA, USA; 7Taipei Veterans General Hospital, Taipei, Taiwan; 8Edinburgh Cancer Research Centre and University of Edinburgh, Edinburgh, United Kingdom; 9Asan Medical Center and University of Ulsan College of Medicine, Seoul, Republic of Korea; 10Provincial Hospital in Torun, Torun, Poland; 11Imperial College Healthcare NHS Trust, London, United Kingdom; 12Arturo López Pérez Foundation, Santiago, Chile; 13Macquarie University, Sydney, NSW, Australia; 14Centre Hospitalier Universitaire de Bordeaux - Hôpital Saint-André, Bordeaux, France; 15Texas Oncology, US Oncology Research, Woodlands, TX, USA; 16Rocky Mountain Cancer Centers, Aurora, CO, USA; 17Merck & Co., Inc., Rahway, NJ, USA; 18Barts Health NHS Trust and the Royal Free NHS Foundation Trust, Barts Cancer Institute and Queen Mary University of London, London, United Kingdom
[Slide 2]
OS, ITT Population
| Pembro (N = 496) | Placebo (N = 498)
Events, n (%) | 86 (17.3) | 118 (23.7)
Median (95% CI), months | NR (NR-NR) | NR (NR-NR)
HR 0.70 (95% CI, 0.53-0.92)
Landmark labels on curve (Pembro): 96.3% | 93.9% | 91.2% | 87.7% | 85.9% | 82.3%
Landmark labels on curve (Placebo): 93.9% | 89.5% | 85.8% | 82.2% | 79.3% | 76.6%
No. at risk (0–108 months, every 6):
Pembro: 496 489 485 479 472 468 460 452 445 440 428 422 417 383 227 131 49 1 0
Placebo: 498 492 484 478 464 455 442 429 423 416 404 398 390 358 204 119 45 2 0
...OS end point was met at IA3 and was not formally statistically tested thereafter. Data cutoff date: February 4, 2026.
Survival table
Endpoint: Overall survival, ITT
Arm | N | Median | Median CI
Pembro | 496 | NR | NR-NR
Placebo | 498 | NR | NR-NR
HR: 0.70
HR CI: 0.53-0.92
Landmark rates:
dashed line 1 (unlabelled): Pembro 96.3% | Placebo 93.9%
dashed line 2 (unlabelled): Pembro 93.9% | Placebo 89.5%
dashed line 3 (unlabelled): Pembro 91.2% | Placebo 85.8%
dashed line 4 (unlabelled): Pembro 87.7% | Placebo 82.2%
dashed line 5 (unlabelled): Pembro 85.9% | Placebo 79.3%
dashed line 6 (unlabelled): Pembro 82.3% | Placebo 76.6%
[Slide 3]
AE Summary, As-Treated Population
| IA4 (median 69.5 months follow-up)1 Pembro (n = 488) | IA4 Placebo (n = 496) | FA (median 85.9 months follow-up) Pembro (n = 488) | FA Placebo (n = 496)
Duration of therapy, median (range), months | 11.1 (0.03-14.3) | 11.1 (0.03-15.4) | 11.1 (0.03-14.3) | 11.1 (0.03-15.4)
All-cause AEs | 470 (96.3) | 453 (91.3) | 471 (96.5) | 454 (91.5)
Grade 3-5 | 156 (32.0) | 88 (17.7) | 156 (32.0) | 88 (17.7)
Led to treatment discontinuation | 103 (21.1) | 11 (2.2) | 103 (21.1) | 11 (2.2)
Led to death | 2 (0.4) | 1 (0.2) | 2 (0.4) | 1 (0.2)
All-cause serious AEs | 101 (20.7) | 57 (11.5) | 101 (20.7) | 57 (11.5)
Led to treatment discontinuation | 49 (10.0) | 5 (1.0) | 49 (10.0) | 5 (1.0)
Treatment-related AEs | 386 (79.1) | 263 (53.0) | 386 (79.1) | 263 (53.0)
Grade 3-4 | 91 (18.6) | 6 (1.2) | 91 (18.6) | 6 (1.2)
Led to treatment discontinuation | 89 (18.2) | 4 (0.8) | 89 (18.2) | 4 (0.8)
Led to death | 0 | 0 | 0 | 0
Treatment-related serious AEs | 58 (11.9) | 1 (0.2) | 58 (11.9) | 1 (0.2)
Data are n (%) unless otherwise specified. Data cutoff date: February 4, 2026. 1. Haas NB et al. J Clin Oncol. 2025;43:4514.
#ESMO26 Phase II sac-TMT + pembro in 1L cisplatin-ineligible advanced UC (n=40, 60% UTUC)
Median PFS 11.2 mo, OS NR and G3/4 TRAEs 63%
Promising results although its place in the EVP era remains to be defined. Worth exploring this combination in other settings
@OncoAlert https://t.co/1PVtUJXVq4
[Slide 1]
Baseline Characteristics
| Sac-TMT + pembro (N = 40)
Age, median (range), y | 66.5 (42–81)
Male | 26 (65)
Race: Asian | 37 (93)
Race: White | 3 (8)
ECOG PS 0 | 3 (8)
ECOG PS 1 | 32 (80)
ECOG PS 2a | 5 (13)
Histology: Urothelial or transitional-cell carcinoma | 38 (95)
Histology: Urothelial carcinoma, mixed types | 2 (5)
Location of metastasis: Lymph node only | 7 (18)
Location of metastasis: Liver | 8 (20)
Primary tumor location: Lower tract | 16 (40)
Primary tumor location: Upper tract | 24 (60)
PD-L1 CPS <10 | 32 (80)
PD-L1 CPS ≥10 | 8 (20)
TROP2 H-scoreb <200 | 5 (13)
TROP2 H-scoreb ≥200 | 32 (80)
TROP2 H-score Missingc | 3 (8)
Cisplatin ineligibility criteria: ECOG PS of 2a | 5 (13)
Creatinine clearanced <60 mL/min but >30 mL/min | 33 (83)
Grade ≥2 audiometric hearing loss | 1 (3)
Grade ≥2 peripheral neuropathy | 3 (8)
CPS, combined positive score. Median study follow-up duration (time from first dose to data cutoff), 22.8 (range, 19.8–30.0) months. Data are n (%) unless otherwise specified. aBefore a protocol amendment, participants with ECOG PS of 2 were eligible for enrollment. bAs determined by Roche Tissue Diagnostics IHC assay. cParticipants who did not have TROP2 IHC data available. dCalculated or measured. Data cutoff, Jan 26, 2026.
[Slide 3]
Summary of Treatment-Relateda AEs
| Sac-TMT 4 mg/kg + pembro (n = 26) | Sac-TMT 5 mg/kg + pembro (n = 14) | Sac-TMT + pembro (N = 40)
Treatment duration, median (range), mo — Sac-TMT | 11.8 (0.03–25.1) | 10.0 (0.5–29.1) | 10.9 (0.03–29.1)
Treatment duration — Pembrolizumab | 9.2 (0.03–22.8) | 9.3 (0.03–23.5) | 9.3 (0.03–23.5)
Treatment-related AEs | 25 (96) | 14 (100) | 39 (98)
Grade 3 or 4 | 17 (65) | 8 (57) | 25 (63)
Serious | 3 (12) | 3 (21) | 6 (15)
Led to any treatment discontinuation | 2 (8) | 4 (29) | 6 (15)
Led to sac-TMT discontinuation | 1 (4)b | 2 (14)c | 3 (8)
Led to pembrolizumab discontinuation | 1 (4)d | 2 (14)e | 3 (8)
Led to death | 0 | 0 | 0
Chart: Treatment-Related AEs Occurring in ≥25% of Participants (Participants, %; Grade 1 or 2 / Grade 3 or 4)
Anemia 73 | Stomatitis 73 | Alopecia 43 | Hypoalbuminemia 43 | Decreased appetite 40 | Rash 40 | Neutrophil count decreased 35 | Blood creatinine increased 33 | WBC count decreased 33 | Hyperglycemia 30 | Lymphocyte count decreased 30 | Urinary tract infection 28 | Proteinuria 25
Data in the table are n (%). aDetermined by the investigator to be related to any study treatment; in the 4 and 5 mg/kg groups respectively, 2 (8%) and 3 (21%) participants had ocular surface toxicity (all were grade ≤2), and no participants had interstitial lung disease/pneumonitis. bDue to infusion-related reaction. cDue to infusion-related reaction and platelet count decreased. dDue to glucocorticoid deficiency. eOne participant due to adrenal insufficiency and one participant due to ALT increased and AST increased. Data cutoff, Jan 26, 2026.
Zach Klaassen@zklaassen_md
1) Kaplan-Meier survival data: TRIDA (SOGUG) real-world darolutamide + ADT + docetaxel in mHSPC · 2) Kaplan-Meier survival data: TRIDA (SOGUG) real-world darolutamide + ADT + docetaxel in mHSPC · 3) Slide: TRIDA biochemical (PSA) and global response stacked bars · 4) Safety data: TRIDA adverse events by grade (horizontal bar chart)
Daro + ADT and docetaxel in mHSPC: RW Evidence from the TRIDA Study of SOGUG 🇪🇸 #ESMO26 @urotoday @Ricardo62949193
mFU: 11 mos
📌16.2% progressed to CRPC
📌mOS NR, 18 mo probability of survival: 86.5%
📌48.5% PSA <= 0.2
📌83.3% disease control
📌Similar safety to ARASENS https://t.co/V19fLQC3pD
Great work by our colleague Dr. Aditi Gupta at #ESMO26!
AlphaMissense classified 99% of DDR missense variants in metastatic urothelial cancer (vs 11% by OncoKB), identifying a potentially pathogenic subset among OncoKB-unknown variants associated with improved overall survival (adjusted HR 0.57).
#BladderCancer #GUOnc #ESMO26
Abstract FPN 357P: AlphaMissense (AM) reclassifies DNA damage repair (DDR) variants of unknown significance and identifies a subset associated with survival in metastatic urothelial carcinoma (mUC)
Aditi Gupta, Karissa Whiting, Irina Ostrovnaya, Ritesh R. Kotecha, Gopa Iyer, Jonathan E. Rosenberg
Memorial Sloan Kettering Cancer Center, New York, NY
BACKGROUND
• Alterations in DNA damage repair (DDR) genes are associated with improved survival on platinum-based chemotherapy and higher response rates to PD-1/PD-L1 blockade in metastatic urothelial carcinoma (mUC).
• Most DDR alterations in mUC are missense variants of unknown significance (VUS). Clinical annotation tools such as OncoKB classify only a small fraction of them, so most patients with a DDR missense variant cannot be assigned a functional status.
• In a retrospective analysis of 60 patients with mUC treated with PD-1/PD-L1 blockade, ORR was 80% with deleterious DDR mutations, 54% with DDR VUS and 19% without DDR alterations, suggesting some VUS are functional.
• AlphaMissense (AM) is a deep learning model adapted from AlphaFold. It predicts pathogenicity for nearly all possible human missense variants and classifies 89% as likely benign or likely pathogenic.
• We hypothesized that AM can reclassify OncoKB-Unknown DDR missense variants and identify a pathogenic subset with clinical significance in mUC
METHODS
• Cohort: Patients with mUC sequenced with MSK-IMPACT at or after first metastasis were identified from the MSK-MET 2021 cohort (N=590; mUC n=463, mUTUC n=127)
• Gene panel: Missense variants were restricted to a previously published 34-gene DDR panel (n=511 variants)
• Variant classification: Each variant was scored by OncoKB (OKB; Oncogenic, Neutral, Unknown) and by AM, which assigns a continuous pathogenicity score (0–1) categorized using thresholds calibrated against ClinVar and by AM (Pathogenic >0.564, Ambiguous 0.34–0.564, Benign <0.34)
• Patient classification: Patients were assigned to a class by "worst-case wins" across all of their DDR missense variants
• Cross-classification: OKB-Unknown patients were stratified by AM class to identify the pathogenic variants that OKB could not classify
• Statistical analysis: Overall survival (OS) was measured from the date of sequencing. Cox regression was adjusted for age, sex and tumor mutation burden (TMB)
Figure 1. Classification of missense variants (n=511) by OncoKB versus AM
OncoKB: Oncogenic / Likely Oncogenic 46 (9.0%); Inconclusive 3 (0.6%); Likely Neutral 6 (1.2%); Unknown 456 (89.2%)
AlphaMissense: Likely Pathogenic 139 (27.2%); Ambiguous 40 (7.8%); Likely Benign 327 (64.0%); Unscored 5 (1.0%)
Fig 1. AM classifies 99.0% of missense variants, compared with 10.8% classified by OncoKB.
Table 2 (Cox models vs WT): Comparison | N (events) | UV HR (95% CI) | p | MV HR (95% CI) | p
AM-Pathogenic | 105 (38) | 0.49 (0.35–0.70) | <0.001 | 0.62 (0.42–0.91) | 0.016
AM-Ambiguous | 23 (12) | 0.94 (0.52–1.68) | 0.83 | 1.24 (0.67–2.31) | 0.49
AM-Benign | 113 (51) | 0.71 (0.52–0.96) | 0.027 | 0.76 (0.57–1.07) | 0.12
OKB-Oncogenic | 41 (14) | 0.51 (0.30–0.88) | 0.016 | 0.69 (0.38–1.24) | 0.22
OKB-Unknown | 198 (88) | 0.64 (0.50–0.82) | <0.001 | 0.74 (0.56–0.97) | 0.032
OKB-Unknown / AM-Pathogenic | 66 (26) | 0.51 (0.34–0.78) | 0.001 | 0.57 (0.36–0.91) | 0.019
OKB-Oncogenic / AM-Pathogenic | 38 (12) | 0.45 (0.25–0.80) | 0.007 | 0.58 (0.29–1.18) | 0.13
OKB-Unknown / AM-Ambiguous | 22 (11) | 0.87 (0.47–1.59) | 0.65 | 1.27 (0.64–2.52) | 0.49
OKB-Unknown / AM-Benign | 110 (49) | 0.68 (0.50–0.93) | 0.017 | 0.76 (0.54–1.06) | 0.11
Table 2. UV, univariable; MV, multivariable Cox model adjusted for age, sex, and TMB. HRs are relative to WT unless otherwise specified.
Fig 3. OncoKB-Unknown patients reclassified as AM-Pathogenic had the strongest association with longer OS vs WT (p=0.001). Those reclassified as AM-Benign were also associated with longer OS vs WT (p=0.016).
CONCLUSIONS
• AM classified 99% of DDR missense variants vs 11% by OncoKB, and reclassified most OncoKB-Unknown variants in mUC.
• AM-Pathogenic status was associated with improved OS vs WT (adjusted HR 0.62, p = 0.016).
• AM identified a pathogenic subset that OncoKB could not classify. OncoKB-Unknown patients reclassified as AM-Pathogenic had improved OS (adjusted HR 0.57, p = 0.019), similar to OncoKB-Oncogenic patients.
• AM offers a complementary classification system for identifying patients with pathogenic DDR mutations, which warrants validation in a larger mUC cohort.
This study was sponsored by Memorial Sloan Kettering Cancer Center. Abstract #357P; Presented at the ESMO 2026 Madrid, Spain.
[Left lower poster (Table 1, Figure 2) partially obscured by presenter]
Julian Chavarriaga@chavarriagaj
1) Kaplan-Meier survival data: ENZAMET post-hoc: Fig 1 cumulative incidence of SCNEPC · 2) Kaplan-Meier survival data: ENZAMET post-hoc: Fig 2 OS from diagnosis of SCNEPC · 3) Slide: ENZAMET post-hoc: Fig 3 DECIPHER neuroendocrine classifiers in participants with vs without
#ESMO26 Does earlier ARPI increase the risk of neuroendocrine transformation in prostate cancer?
A post-hoc analysis from ENZAMET (n=1,125; median follow-up 8.4 years).
📌Treatment-emergent SCNEPC: 1.7% overall
📌 Enzalutamide vs conventional NSAA: 2.7% vs 0.7% (IRR 3.3; p=0.04)
📌Median time to SCNEPC: 3.1 years
📌Median OS after transformation: only 9 months
📌Baseline neuroendocrine signatures: 70% vs 43% among patients who did vs did not develop SCNEPC
🏴Despite the higher observed incidence, enzalutamide substantially prolonged CRPC-free survival (5.8 vs 1.8 years).
**Only 19 events: interpret the incidence difference cautiously. Association does not establish causation.
@UroToday @myESMO
UCL Innovative Clinical Trials Unit
Inclusion Criteria (TBC)
• >18y
• WHO PS 0 or 1
• No other malignancy
• No previous IO
• Biopsy proven resectable ccRCC AND intermediate/high risk disease based on imaging and biopsy:
• cT1b/2a G4 cN0
• cT2b any grade cN0
• cT3 any grade (cT3a without VTT should be >4cm) cN0
• cT4 any grade cN0
• cN1 or M1 (fully resectable) any cT
Randomisation
Platform design will allow inter-arm comparisons with randomization for neoadjuvant therapy 4:1 with SoC
RANDOMISE
SoC → Surgery → 12/12 Pembro
3/12 Pembro → Surgery → 9/12 Pembro
3/12 Pembro → Surgery → No Pembro
3/12 NeoAdj B i.e. bispecific → Surgery → 9/12 Pembro
3/12 NeoAdj C i.e. HIF2ai + IO → Surgery → 9/12 Pembro
CT CT CT CT CT
Sample size
45 patients/arm to demonstrate a reduction of the 2-year event rate from 22% to 10% with a power of 80%.
Primary endpoint
2-year Event Free Survival
[EFS=disease progression before surgery, surgical delay or ineligibility, recurrence after surgery or death]
Secondary /exploratory endpoints
Recurrence free survival
Overall survival
Pathologic response rate
Adverse events
Quality of Life
Julian Chavarriaga@chavarriagaj
1) Slide: Why have ADCs struggled in RCC? ADC efficacy chain (Yuji Miura) · 2) Slide: Targeting the stroma: FAP+ CAFs in RCC and FAP-targeting ADC hypothesis (Yuji Miura)
#ESMO26 Excellent presentation by @yujimiura5 on 3 critical barriers to ADC efficacy in RCC:
🔹 Delivery: Heterogeneous perfusion, limited vascular permeability, and the binding-site barrier restrict intratumoral penetration.
🔹 Targeting: Spatial heterogeneity in antigen expression across tumor and stromal compartments limits effective targeting.
🔹 Payload: Most RCC ADC trials have shown ORRs <10%, with toxicity narrowing the therapeutic window.
📌The future of ADCs in RCC may depend less on finding another antigen and more on delivering the right payload to the right compartment.
@UroToday @myESMO
[Slide 2]
Why have ADCs struggled in RCC?
—ADC Efficacy Chain—
Pharmacokinetics | Tumor penetration | Target recognition | Intracellular trafficking | Payload | TME modulation
Mosele et al. Nat Med (32)2774-2785, 2026
Breaking any link in the ADC efficacy chain leads to a loss of ADC efficacy
BARRIER 1 Delivery | BARRIER 2 Targeting | BARRIER 3 Payload
[Slide 3]
Targeting the stroma
FAP+CAFs support RCC progression and poor treatment outcomes.
Why target FAP+ CAFs in RCC?
Tumor EC 1; FAP+ Fibroblast; Pericyte 2
• FAP+ CAFs localized near tumor endothelial cells.
• Patients-derived FAP+ CAFs promote RCC cell growth and invasion
JAVELIN Renal 101: Progression-free survival
Sunitinib: FAP+ Fibroblast High vs Low; p = 0.0051
Avelumab+Axitinib: FAP+ Fibroblast High vs Low; p = 0.0041
• High FAP+ CAF signature score are associated with shorter PFS both in sunitinib and Avelumab plus axitinib arm.
Ma J. et al. Nat Commun 2025;16:9387
Can an ADC exploit this target?
FAP-targeting ADC (e.g., OMTX705); Antibody–drug conjugate (ADC); FAP; FAP+ CAF; Promotes tumor growth and invasion; CAF depletion / modulation; Tumor cells; Potential reduction of stromal support
Therapeutic hypothesis: overcome CAF-associated resistance
What remains to be demonstrated
• Efficacy of FAP-targeting ADCs in RCC
• Improved delivery or treatment sensitivity
Katy Beckermann@katy_beckermann
1) Slide: Consensus framework for pathology workup of mCRPC biopsies - morphology, IHC · 2) Slide: Summary slide on small cell/neuroendocrine prostate cancer: platinum/SCLC regimens, DLL3
Amazing overview from @mishabeltran at #ESMO26 on small cell and treatment emergent neuroendocrine prostate cancer.
🧬 Haffner consensus pathology report: one language for morphology, AR/NKX3.1, SYP/INSM1, Ki-67
🔬 177Lu-PSMA resistance (79 tumors, unpublished): NE 18%, PSMA-negative 41%. NE explains only part of PSMA loss
💊 KEYNOTE-365 cohort I, CPS ≥1 mOS 11.0 vs 4.8 mo. DeLLpro-300, DLL3+ ORR 22.2% vs 0%
TP53/RB1/PTEN loss alone isn't enough. Heterogeneity is a challenge. More frequent imaging, may be psma negative.
#ESMO26 #ProstateCancer #GUonc @myESMO
[Slide 2]
A Consensus Framework For The Pathology Workup Of Metastatic Castration-Resistant Prostate Cancer Biopsies
Goal: A simple standardized diagnostic framework
Morphology Classifier (Choose One) | IHC Classifier* (Include the status of each marker) | Proliferation Classifier (Choose One)
Adenocarcinoma | AR positive (based on AR and NKX3.1 IHC) | High (>60%)
Poorly differentiated carcinoma | AR negative (based on AR and NKX3.1 IHC) | Medium (20-60%)
Small cell carcinoma | NE positive (based on SYP and INSM1 IHC) | Low (<20%)
Other | NE negative (based on SYP and INSM1 IHC) |
*Biomarker positivity is defined as ≥1+ reactivity in ≥ 20% of cells with. AR-positive tumors can show either AR or NKX3.1 reactivity, meeting this threshold. For NE-positive tumors, ≥1+ reactivity in ≥ 20% for either SYP or INSM1 is required.
"Prostatic adenocarcinoma, AR-positive, NE-negative, Ki-67 20%"
"Small cell carcinoma, AR-negative, NE-positive, Ki-67 70%"
Haffner et al., CCR 2025
[Slide 4]
Summary
• NEPC is a heterogenous disease - treatment should be tailored to clinical and pathologic features
• Platinum chemotherapy and SCLC regimens could be considered for small cell/NEPC based on guidelines
• DLL3 is very specific to NE carcinomas - careful patient selection for tarlatamab and other emerging DLL3-therapies critical (not enough to have TP53/RB1/PTEN)
• Other potential targets in clinical trials: cell surface (eg, SEZ6, B7H3), epigenetic (eg, EZH2), rational combination strategies
Sara Coca Membribes@scocmem
1) Kaplan-Meier survival data: POTOMAC DFS in papillary-only and T1 subgroups · 2) Slide: POTOMAC AE summary - papillary-only tumours vs overall safety population
#ESMO26 Data from POTOMAC focusing on papillary-only high-risk NMIBC. Durva + BCG reduced high-risk events (13% vs 20%) and improved cystectomy-free survival (HR 0.59)
The benefit–toxicity remains key given the higher rates of G3/4 AEs (23% vs 3%)
@OncoAlert https://t.co/s5komqPQxE
[Slide 1]
POTOMAC: Disease-Free Survival in Patients With Papillary Only and With T1 Tumours
D+BCG (I+M) showed a consistent benefit across papillary only and T1 subgroups
Papillary only (64%-65% of ITT population)a,b,1
D+BCG (I+M) N=217 | BCG (I+M) N=220
Number of events, n (%): 37 (17) | 65 (30)
Median DFS, months (95% CI): NR (NR-NR) | NR (74.0-NR)
Median follow-up in censored patients: 60.7 months
Landmarks on curve (24/36/48 mo dashed lines): D+BCG 87% / 84% / 84%; BCG 81% / 76% / 74%
HR 0.56 (95% CI, 0.37-0.84)
T1 subset of papillary only (40%-43% of ITT population)c,d
D+BCG (I+M) N=137 | BCG (I+M) N=145
Number of events, n (%): 22 (16) | 45 (31)
Median DFS, months (95% CI): NR (NR-NR) | NR (69.3-NR)
Median follow-up in censored patients: 60.7 months
Landmarks on curve (24/36/48 mo dashed lines): D+BCG 88% / 85% / 85%; BCG 79% / 75% / 73%
HR 0.48 (95% CI, 0.28-0.79)
Probability of DFS / Time from randomisation (months)
No. of patients at risk (papillary only):
D+BCG (I+M): 217 204 196 190 184 183 178 177 176 174 168 167 164 159 154 150 146 144 135 127 102 98 69 57 38 19 9 1 0
BCG (I+M): 220 207 195 188 180 177 172 167 163 159 155 150 146 145 142 141 140 130 122 99 92 63 53 32 17 7 0 0
No. of patients at risk (T1):
D+BCG (I+M): 137 130 120 117 117 114 114 112 109 108 106 103 101 99 96 90 87 70 68 52 45 30 17 8 1 0
BCG (I+M): 145 136 128 125 117 114 111 106 103 102 96 95 92 91 91 90 90 87 68 61 43 35 21 11 4 0 0
aBased on stratified analysis. bPrespecified sensitivity analysis. cBased on unstratified analysis. dPost-hoc exploratory analysis. DFS is defined as the time to the first: 1) recurrence of high-risk disease (recurrence of high-grade Ta, T1, or CIS; presentation with MIBC and/or metastatic disease or persistent CIS at 6 months); 2) death by any cause in the absence of recurrence. T1 disease: papillary disease stage T1, without CIS. Data cutoff 03 April 2025. 1. De Santis M, et al. Lancet. 2025;406:2221-2234. BCG, bacillus Calmette-Guerin; CI, confidence interval; CIS, carcinoma in situ; D, durvalumab; DFS, disease-free survival; HR, hazard ratio; I, induction; ITT, intent-to-treat; M, maintenance; MIBC, muscle-invasive bladder cancer; NR, not reached.
Survival table
Endpoint: DFS (papillary-only and T1 subgroups)
Arm | N | Median | Median CI
Papillary only - D+BCG (I+M) | 217 | NR | NR-NR
Papillary only - BCG (I+M) | 220 | NR | 74.0-NR
T1 - D+BCG (I+M) | 137 | NR | NR-NR
T1 - BCG (I+M) | 145 | NR | 69.3-NR
HR: Papillary only 0.56; T1 0.48
HR CI: Papillary only 0.37-0.84; T1 0.28-0.79
Landmark rates:
24 mo: Papillary only - D+BCG (I+M) 87% | Papillary only - BCG (I+M) 81% | T1 - D+BCG (I+M) 88% | T1 - BCG (I+M) 79%
36 mo: Papillary only - D+BCG (I+M) 84% | Papillary only - BCG (I+M) 76% | T1 - D+BCG (I+M) 85% | T1 - BCG (I+M) 75%
48 mo: Papillary only - D+BCG (I+M) 84% | Papillary only - BCG (I+M) 74% | T1 - D+BCG (I+M) 85% | T1 - BCG (I+M) 73%
[Slide 3]
POTOMAC: AE Summary for Patients With Papillary Only Tumours
The safety profile of D+BCG (I+M) in patients with papillary only tumours was consistent with the overall safety population
Events, n (%) | Papillary only1: D+BCG (I+M) N=215 | BCG (I+M) N=219 | Overall safety population2: D+BCG (I+M) N=336 | BCG (I+M) N=339
AEs of any cause | 208 (97) | 193 (88) | 325 (97) | 307 (91)
Possibly related to any treatment | 189 (88) | 146 (67) | 298 (89) | 245 (72)
Maximum grade 3 or 4 AEs | 73 (34) | 35 (16) | 113 (34) | 56 (17)
Possibly related to any treatment | 49 (23) | 6 (3) | 71 (21) | 13 (4)
Serious AEs | 64 (30) | 38 (17) | 108 (32) | 63 (19)
Possibly related to any treatment | 27 (13) | 6 (3) | 45 (13) | 13 (4)
AEs leading to death | 5 (2) | 4 (2) | 6 (2) | 4 (1)
Possibly related to any treatment | 0 | 0 | 0 | 0
AEs leading to discontinuation of study treatment | 63 (29) | 38 (17) | 105 (31) | 68 (20)
Possibly related to durvalumab | 35 (16) | 1 (0.5)a | 54 (16) | 1 (0.3)a
Possibly related to BCG | 32 (15) | 27 (12) | 55 (16) | 55 (16)
Any-grade imAEs | 58 (27) | 4 (2) | 91 (27) | 4 (1)
Maximum grade 3 or 4 imAEs | 20 (9) | 1 (0.5) | 27 (8) | 1 (0.3)
aPatient assigned to the BCG (I+M) arm due to a data-entry error. The papillary tumours only safety population includes all patients with papillary only tumours who received treatment. Causality per investigator assessment. Data cutoff 03 April 2025. 1. Shore ND, et al. J Urol. 2026;215:e3. 2. De Santis M, et al. Lancet. 2025;406:2221-2234. AE, adverse event; BCG, bacillus Calmette-Guerin; D, durvalumab; I, induction; imAE, immune-mediated adverse event; M, maintenance.
Deborah Mukherji@dmukherji
Slide: STAMPEDE Decipher score predicts distant metastasis benefit of abiraterone in N0 patients
Can Decipher guide ARPI intensification in localized #ProstateCancer
Interesting #ESMO26 STAMPEDE analysis: Decipher predicted differential benefit from abiraterone for distant metastasis @AttardLab @OncoAlert
5-year absolute benefit: 2% in low vs 12% in high Decipher scores. https://t.co/ObIEQ0RFNW
Updated Results from TheraPb: RP2D of 212Pb-ADVC001 in PSMA+ mCRPC @urotoday #ESMO26
📌n=22
📌No TR-SAEs, no Gr 4-5 AEs, no new Gr 3 AEs
📌PSA decline rate: 82%
📌RP2D: 160 MBq and 200 MBq
- PSA50: 80%
- ORR: 100%
📌m-rPFS: 11.2 mos https://t.co/v02Z4TCswt
[Slide 1]
Figure 1: TheraPb Phase 1 study design
Phase 1b - Dose Escalation | Interval 3+3 dose-escalation incorporating dose optimization strategies
N=22 mAPMR: Post ≥1 ARPi; Post taxane or declined; RPT naïve; PSMA+ (>liver)
ADVC001 [radioactive syringe icon]
Cohort 1: 60 MBq Q6W, 4 doses
Cohort 2a: 120 MBq Q4W, 4-6 doses
Cohort 3a: 160 MBq Q4W, 4-6 doses
Cohort 3b: 160 MBq Q2W, 4-6 doses
Cohort 4a: 200 MBq Q4W, 4-6 doses
Cohort 4b: 200 MBq Q2W, 4-6 doses
Cohort 4c: 200 MBq Q1W, 4-6 doses
Key endpoints
Safety and Tolerability: DLTs; AEs, SAEs and rAESIs; PRO-CTCAE
Efficacy: PSA response; ORR, rPFS, OS
PK, Metabolites and Dosimetry: Organ absorbed dose; Clearance, Cmax, metabolites
Exploratory Imaging and Biomarkers: 212Pb-PET; Predictors for toxicity, efficacy
Recommended Phase 2 Dose and Regimen [RP2D icon]
Timeline: Eligibility -> Treatment period 6-24 weeks -> SPECT/CT, Contrast CT, Bone scan, PSMA PET/CT, Safety labs / PK / PSA, TEAEs and TRAEs (from C1D1 to 12 weeks post last dose) -> Follow-up up to 5 yrs from C1D1
Clinical: related SAEs, rAESIs, clinical progression, subsequent anti-cancer tx
Laboratory: safety labs, PSA Q6M
Imaging: contrast CT / bone scan Q3M until progression
[Slide 2]
Figure 2: Phase 1b Swimmer plot
Patients 1-22 (rows); X axis: Months since C1D1 (0-24)
Legend: Study completion; Withdrawal; Death; Follow-up on-going; PR or CR (per RECIST v1.1); PSA50 (first instance); Radiographic or clinical progression; Commencement of new systemic anti-cancer therapy
Cohort colors: Cohort 1 60 MBq Q6W; Cohort 2a 120 MBq Q4W; Cohort 3a 160 MBq Q4W; Cohort 3b 160 MBq Q2W; Cohort 4a 200 MBq Q4W; Cohort 4b 200 MBq Q2W; Cohort 4c 200 MBq Q1W; Follow-up
[Slide 3]
Table 2: Overall safety including long-term follow-up
Incidence of AEs by number of events (pts) | Overall N = 22 | RP2D n = 15
Treatment-emergent AEs (TEAEs) | 210 (22) | 138 (15)
Grade ≥ 3 | 26 (9) | 19 (5)
SAEs | 16 (9) | 10 (5)
Dose-limiting toxicity | 0 | 0
Leading to treatment discontinuation or dose reduction | 0 | 0
Leading to dose delay | 4 (4) | 1 (1)
Treatment-related AEs (TRAEs) | 94 (20) | 64 (15)
Grade ≥ 3 [a] | 2 (2) | 2 (2)
SAEs | 0 | 0
Leading to treatment discontinuation or dose reduction | 0 | 0
Leading to dose delay | 1 (1) | 1 (1)
Late radiation AEs of special interest (rAESIs) | 0 | 0
[Slide 4]
Figure 3a: Best PSA response as percentage change from baseline in all pts (N = 22)
Y axis: Best percentage change from baseline PSA (60 to -100); PSA50 reference line
Legend: 60 MBq (Q6W); 120 MBq (Q4W); 160 MBq (Q4W, Q2W); 200 MBq (Q4W, Q2W, Q1W)
Figure 3b: Best percentage change in target lesion sum of diameters from baseline in RECIST-evaluable pts (n = 6), by BICR
Y axis: Best percentage change in SOD from baseline (20 PD, -30 PR, -100 CR)
Bars: cPR -42%; cPR -67%; cPR -77%; uCR -82%; cCR -100%; uCR [a]
Legend: 200 MBq (Q4W, Q2W, Q1W); 160 MBq (Q4W, Q2W); 120 MBq (Q4W)
Dra. María Natalia Gandur Quiroga@nataliagandur
1) Slide: Personalised neoantigen vaccine: workflow (PGV001) - Niven Mehra · 2) Slide: In situ vaccination with intratumoural immunotherapy: SYNC-T SV-102 Phase 1 · 3) Slide: Oncolytic virotherapy: replicating, tumour-selective - platforms tested · 4) Slide: Patient selection across emerging immunotherapies in prostate cancer - Niven
🚨⭐🔵 #ESMO26 | Emerging Immune-Based Therapies in Prostate Cancer
From Molecular Selection to Next-Generation Immunotherapy in mCRPC
🎤 Presented by Niven Mehra 🇳🇱
@OncoAlert
🔬 Is prostate cancer really an immunologically cold tumor—or have we simply not identified the right patients and therapeutic platforms?
An outstanding overview of the evolving immunotherapy landscape in #ProstateCancer.
🧬 1️⃣ CHECKPOINT INHIBITION: BIOMARKERS MATTER
dMMR/MSI-H (~3% of patients) remains the best-established subgroup for immune checkpoint inhibition in mCRPC.
📊 International multicenter real-world cohort (n=93):
✅ ORR: 46%
✅ PSA50 response: 60%
✅ Median PFS: 7.7 months
✅ Median OS: 27 months
✅ 3-year PFS: 26%
🔬 INSPIRE: nivolumab + ipilimumab
In the dMMR subgroup:
✅ ORR: 75%
✅ PSA50: 86%
✅ Median PFS: 32.7 months
⚠️ Grade ≥3 treatment-related AEs occurred in 48% of the overall INSPIRE population.
📌 CDK12 and BRCA2 alterations alone are not sufficiently validated predictive biomarkers for checkpoint inhibition. TMB-high/MSS disease remains a more uncertain subgroup.
🎯 Clinical implication: Test for dMMR/MSI-H. Missing this biomarker can mean missing a meaningful therapeutic opportunity.
💥 2️⃣ T-CELL ENGAGERS: A NEW FRONTIER
Among emerging immune strategies, T-cell engagers are one of the most clinically advanced approaches.
🔹 Xaluritamig (STEAP1 × CD3)
Demonstrates early antitumor activity in mCRPC, with cytokine release syndrome remaining a major consideration.
🔹 Pasritamig (KLK2 × CD3)
Phase I | N=174
✅ PSA50: 42.4% at the recommended phase II dose (n=33)
✅ Median rPFS: 7.85 months in that cohort
✅ CRS: 8.9%, all grade 1, in the RP2D safety population
🔹 Conditionally activated PSMA engagers
JANX007 and VIR-5500 illustrate how tumor-selective activation and masking technologies may improve the therapeutic window.
🔬 The challenge is no longer simply engaging T cells, but achieving sustained activity while limiting cytokine release, immunogenicity and on-target/off-tumor toxicity.
🧪 3️⃣ CAR-T THERAPY: PROOF OF CONCEPT
Early phase I programs targeting PSCA, PSMA and other prostate-associated antigens demonstrate feasibility.
However, important challenges remain:
• T-cell persistence
• Antigen heterogeneity
• Immunosuppressive tumor microenvironment
• On-target/off-tumor toxicity
• Manufacturing complexity
📌 Promising biology, but not yet an established treatment in prostate cancer.
💉 4️⃣ PERSONALIZED VACCINES & IN-SITU IMMUNOTHERAPY
Personalized neoantigen vaccines aim to generate immune responses against patient-specific tumor mutations.
Manufacturing time, low neoantigen burden and limited immunogenicity remain important barriers.
🔬 SYNC-T SV-102: intratumoral immunotherapy
Early phase I results (n=15):
✅ ORR: 87%
✅ Complete responses: 53%
⚠️ Highly encouraging, but preliminary findings from a very small, selected cohort requiring independent validation.
🦠 5️⃣ ONCOLYTIC VIROTHERAPY
CAN-2409 + radiotherapy represents an important randomized phase III development in localized prostate cancer.
📊 N=745
✅ Disease-free survival HR 0.70
✅ 95% CI 0.52–0.94
✅ p=0.016
An important proof of concept for immune-based therapeutic strategies, although these findings concern localized disease rather than mCRPC.
🧬 6️⃣ PATIENT SELECTION WILL BE EVERYTHING
Future immune strategies may require different selection criteria:
🔹 dMMR/MSI-H → checkpoint inhibitors
🔹 Antigen expression (STEAP1, KLK2, PSMA) → T-cell engagers
🔹 Low disease burden and favorable immune contexture → possible opportunities for vaccines and in-situ immunotherapy
Emerging biomarkers include genomic and transcriptomic profiles, antigen heterogeneity, ctDNA tumor fraction and PSMA-PET tumor volume.
⭐ MY POINT OF VIEW | CLINICAL PEARL
Prostate cancer is not uniformly resistant to immunotherapy. Our challenge is identifying which immune strategy fits each biological context.
Three important lessons:
✅ Molecular testing must be integrated into routine metastatic prostate cancer care.
✅ T-cell engagers may expand immunotherapy beyond the small dMMR/MSI-H population.
✅ CAR-T cells, vaccines and oncolytic approaches are exciting, but clinical adoption must follow robust evidence of meaningful patient benefit.
💡 The next breakthrough in prostate cancer immunotherapy may come not from activating the immune system more aggressively, but from activating it more precisely.
From biomarker selection to engineered immune recognition: precision immunotherapy is beginning to reshape the field.
@urologysummit @gbanna74 @ravikanesvaran @Uromigos @LosUromigos
@neerajaiims @Silke_Gillessen @declangmurphy @EfstathiouEleni @AOmlin @scserendipity1 @cdanicas @montypal @DrJaVallejo @salvolarosa
@ecancer @UrologyTimes @urotoday @wearemedsir @OpenMedicineHQ
#ProstateCancer #mCRPC #GUOncology #Immunotherapy #PrecisionOncology #TCellEngagers
#ESMO26 WUTSUP-02 exploring DV + tislelizumab (PD-1) in high-risk UTUC shows pCR 28% and higher responses in HER2 2+ & 3+
Still need to better understand the role of HER2 as a biomarker here, given the activity seen in HER2-low metastatic disease
@OncoAlert https://t.co/nwpXJ89Qi1
[Slide 1]
WUTSUP-02: Study Design
• This is a prospective, multi-center, phase II study evaluating neoadjuvant DV with perioperative Tislelizumab in high risk, non-metastatic UTUC (ChiCTR2300067836)
Key inclusion criteria:
• Age 18-75
• Histologically confirmed UTUC
• cT2-4N0-2M0 or cTanyN1-2M0
• HER2 1+/2+/3+
• No contraindications to RNU or systemic therapy
Disitamab vedotin 2.0 mg/kg, Q3W + Tislelizumab 200 mg, Q3W (4 cycles)(a) -> RNU(b) -> Tislelizumab 200 mg, Q3W (8 cycles)
Primary endpoints:
• Pathological complete response (pCR)
Secondary endpoints:
• Objective response rate (ORR)
• Overall survival (OS)
• Metastasis-free survival (MFS)
• Treatment-related adverse events (TRAEs)
a. After 2 cycles, interim assessment (contrast-enhanced CT, ureteroscopy, urine cytology/FISH); if progression, switch to RNU.
b. Ipsilateral adrenalectomy and lymph node dissection (as indicated).
Yige Bao
[Slide 2]
WUTSUP-02: Patient Characteristics
• By May 2026, 42 patients were enrolled, with 39 having completed RNU*
• The median age was 65 years, with 88.1% (37/42) high-grade tumors
• HER2 expression was 3+ in 19.1% (8/42), 2+ in 61.8% (26/42), and 1+ in 19.1% (8/42)
*An additional 3 patients achieved a clinical complete response and underwent kidney-sparing management
Patient Characteristics | N=42
Median age (IQR), years | 65.0 (58.0, 71.0)
Male sex, n (%) | 23 (54.8)
ECOG PS, n (%)
0 | 33 (78.6)
1 | 9 (21.4)
Tumor location, n (%)
Ureter | 23 (54.8)
Renal pelvis | 19 (45.2)
Median tumor size (IQR), cm | 2.1 (1.5-2.7)
High grade from biopsy, n (%) | 37 (88.1)
HER2-positive, n (%) | 34 (80.9)
Cisplatin-Ineligible, n (%) | 12 (28.6)
Yige Bao
[Slide 3]
WUTSUP-02: Tumor Response
• Pathological response: the pCR rate was 28.2% (11/39)
• Radiographic response: the ORR was 81.0% (34/42) CR: 8 | PR: 26 | SD: 6 | PD: 2
• Subgroup response: the HER2 2+/3+ showed higher pCR (31.3% vs 14.3%) and ORR (87.5% vs 42.9%, p=0.03) than the HER2 1+
| ITT patients (N=42) | RNU patients (N=39)
pCR rate(a) | 26.2 (12.9-39.5) | 28.2 (14.1-42.3)
ORR | 81.0 (65.9-89.7) | 79.5 (66.8-92.2)
a Excluding ypTis, ypTa
[Waterfall plot: Primary Tumor Diameter Change (%) by patient 1-42, +20% and -30% reference lines]
[Bar charts: pCR and ORR by HER2 2+/3+ vs HER2 1+; in-chart labels too small to read reliably]
Yige Bao
[Slide 4]
WUTSUP-02: Survival and Safety
• With a median follow-up of 24 months (IQR, 16–30), the 2-year OS rate was 87.1%, and 2-year MFS rate was 83.9%
• The most common TRAEs included ALT/AST increased, hypoesthesia, alopecia, pruritus, and hyperglycemia
| Any grade | Grade ≥ 3
Any TRAEs | 38 (90.5%) | 20 (47.6%)
ALT/AST increased | 21 (50.0%) | 2 (4.8%)
Hypoesthesia | 17 (40.5%) | 2 (4.8%)
Alopecia | 17 (40.5%) | 0 (0.0%)
Hyperglycemia | 13 (31.0%) | 2 (4.8%)
Pruritus | 13 (31.0%) | 1 (2.4%)
[KM curve: Overall Survival — Survival Probability vs Time (Months) 0-30]
[KM curve: Metastasis-free Survival — Survival Probability vs Time (Months) 0-30]
Yige Bao
Survival table
Endpoint: Overall survival and metastasis-free survival (single arm)
DV + tislelizumab (single arm) | 42
Landmark rates:
2 years (OS): DV + tislelizumab 87.1%
2 years (MFS): DV + tislelizumab 83.9%
Dra. María Natalia Gandur Quiroga@nataliagandur
1) Slide: EVOLUTION (ANZUP2001): PFS benefit with dual ICI - low-resolution livestream · 2) Slide: Lu-PSMA combinations: key efficacy data · 3) Slide: PAnTHa: 225Ac-PSMA-Trillium in mCRPC (phase 1 dose escalation) · 4) Slide: VIOLET: 161Tb-PSMA-I&T in mCRPC (phase 1/2 interim) - Azad overview slide
🚨⭐🔵 #ESMO26 | Optimising Radioligand Therapy in Advanced Prostate Cancer
🎤 Presented by @AzadOncology 🇦🇺
@OncoAlert
🔬 Beyond ¹⁷⁷Lu-PSMA: combinations, alpha emitters and the emerging promise of Auger electrons.
An excellent overview of how radioligand therapy (RLT) is evolving in #mCRPC.
📊 1️⃣ EVOLUTION: RADIOLIGANDS + DUAL IMMUNOTHERAPY
Phase II EVOLUTION (ANZUP2001):
¹⁷⁷Lu-PSMA-617 + nivolumab/ipilimumab vs ¹⁷⁷Lu-PSMA-617 alone.
✅ PSA-PFS at 12 months: 33% vs 17%
✅ rPFS at 12 months: 47% vs 23%
📈 Median rPFS: 12.0 vs 8.5 months
⚠️ However:
• Grade 3–4 AEs: 75% vs 29%
• Treatment-related myocarditis: 7% in the combination arm
• Trial recruitment stopped early.
⭐ An important reminder: biological synergy must translate into meaningful benefit without unacceptable toxicity.
💊 2️⃣ Lu-PSMA COMBINATIONS: ENCOURAGING SIGNALS
📊 PSA50 | Median rPFS | Median OS
🔹 VISION (¹⁷⁷Lu-PSMA-617 + protocol-permitted standard care): 46% | 8.7 mo | 15.3 mo
🔹 PRINCE (+ pembrolizumab, n=37): 76% | 11.2 mo | 20.8 mo
🔹 LuPARP (+ olaparib, n=29): 69% | 12.8 mo | 33.5 mo
🔹 AlphaBet (+ radium-223, n=33): 55% | 10.0 mo | 13.5 mo
🔹 LuCAB (+ cabazitaxel, n=26): 73% | 10.9 mo | 16.5 mo
⚠️ These are cross-trial descriptive comparisons, not evidence that any combination is superior to VISION. Patient selection, prior therapies and trial designs differ.
☢️ 3️⃣ ALPHA EMITTERS: A NEW LEVEL OF PRECISION
Unlike beta particles, alpha particles have shorter tissue penetration and high linear energy transfer, potentially improving tumor-cell killing.
🔬 PAnTHa: ²²⁵Ac-PSMA-Trillium
Phase I dose escalation | N=50
✅ PSA50: 58% overall
✅ PSA50: 83% at 125 kBq/kg
✅ PSA90: 58% at the expansion dose
✅ ORR: 46%
✅ Disease control: 83%
⚠️ Xerostomia: 76%
⚠️ Grade ≥3 treatment-emergent AEs: 38%
✅ No dose-limiting toxicities observed.
These preliminary results support further investigation, not routine clinical adoption.
⚛️ 4️⃣ AUGER ELECTRONS: TARGETING MICROSCOPIC DISEASE
An exciting emerging concept.
Auger electrons deposit energy over extremely short distances, potentially targeting microscopic tumor deposits and individual cells.
🔬 Terbium-161 (¹⁶¹Tb) emits beta particles and Auger/conversion electrons.
Could this improve radioligand effectiveness against micrometastatic disease?
The biological rationale is compelling, but clinical benefit remains to be demonstrated.
⭐ MY POINT OF VIEW | CLINICAL PEARL
The future of radioligand therapy will not be defined by the strongest radiation emitter, but by the right radiation strategy for the right patient.
Three essential questions remain:
🔹 Which combinations truly improve survival?
🔹 Can we intensify antitumor activity without unacceptable toxicity?
🔹 How should PSMA expression, tumor heterogeneity and disease burden guide isotope selection?
💡 Precision radioligand therapy means more than targeting PSMA: it means optimizing the payload, the partner, the timing and the patient.
From beta to alpha and Auger emitters, we are entering an exciting new era in #ProstateCancer.
@urologysummit @gbanna74 @ravikanesvaran @Uromigos @LosUromigos
@neerajaiims @Silke_Gillessen @EfstathiouEleni @AOmlin @declangmurphy @montypal @DrScottTagawa @ChrisSweens1 @brian_rini
@ecancer @UrologyTimes @urotoday @wearemedsir @OpenMedicineHQ
#GUOncology #mCRPC #PSMA #RadioligandTherapy #NuclearMedicine #PrecisionOncology
[Slide 3]
PAnTHa: 225Ac-PSMA-Trillium in mCRPC
Phase 1 dose escalation (n=50), after ≥1 ARPI and 1-2 taxanes if eligible. No prior radiopharmaceutical
PSMA PET: uptake greater than liver in ≥1 lesion. Treatment every 6 weeks for up to 4 doses.
Dose range 75-150 kBq/kg. Recommended dose for expansion (RDE): 125 kBq/kg.
PSA responses by dose population: PSA50 Overall 58%, RDE 125 kBq/kg 83%; PSA90 Overall 36%, RDE 58%
Overall n=50. RDE outcomes are a dose-cohort subgroup.
Objective response 46% - Measurable disease, n=24
Disease control 83% - Measurable disease, n=24
Common treatment-emergent adverse events: Dry mouth 76%; Fatigue 48%; Nausea 44%
Dry mouth: grade 1 in 52%, grade 2 in 24%, no grade ≥3.
Grade ≥3 TEAEs: 38%, including lymphopenia in 20%.
Serious TEAEs: 16%. TEAE-related discontinuation: 4%.
No dose limiting toxicities or treatment-related deaths.
PSA-PFS, rPFS and OS not reported. Preliminary dose escalation results, cutoff 18 September 2025.
[reference footnote illegible]
[Slide 4]
VIOLET: 161Tb-PSMA-I&T in mCRPC
Single-arm phase 1/2 interim analysis (n=30), after ARPI and taxane unless unsuitable.
PSMA PET: SUVmax >20 in ≥1 lesion and ≥10 in measurable soft tissue, with no FDG-discordant disease.
Up to 6 cycles every 6 weeks. Recommended starting dose 7.4 GBq, reducing by 0.4 GBq per cycle.
PSA responses
70%
40%
PSA50
21/30 PSA50 (95% CI 51-85)
PSA90
12/30 PSA90 (23-59)
Median PSA-PFS
9.0 months
95% CI 7-15.1
Median rPFS
11.1 months
95% CI 8.6-11.7
Median follow up 11.5 months
Few severe treatment-related adverse events
Grade 3 TRAEs: 7% (2/30)
Pain and lymphopenia (one patient each)
No grade 4 TRAEs
No dose-limiting toxicity
No treatment-related deaths, dose reductions or discontinuations
Dry mouth 70%
Anemia 67%
Lymphopenia 63%
Fatigue 40%
Any grade. Dry mouth was grade 1 in all cases
Buteau et al. Lancet Oncol 2026 [illegible] [illegible]
Katy Beckermann@katy_beckermann
1) Slide: opening session (Karim Fizazi): 1. Impact of GLP1 agonists on cancer incidence · 2) Slide: opening session: 3. Most Favoured Nation (MFN) pricing · 3) Slide: opening session: 6. AI for clinical decision-making · 4) Slide: opening session: 10. Oncology workforce crisis
Karim Fizazi in the #ESMO26 opening session recapped the year in oncology with a big picture overview beyond drug data.
📉 GLP-1 receptor agonists tied to lower cancer incidence in diabetic and obese patients
💬 AI agents near expert level on selected oncology decisions, Ferber Nature 2026, with human oversight still required
📋 MFN pricing may shift global launch strategies and access worldwide
👥 Estimated 100 million healthcare worker shortfall by 2050
Staffing and AI validation are the two that are already touching trial operations.
#ESMO26 #AIinMedicine #GUonc
[Slide 1]
1. Impact of GLP1 Agonists on Cancer Incidence
KEY ISSUE
Growing global obesity burden
13 human malignancies associated with obesity and identified as obesity-associated cancers (OACs).
KEY INSIGHT
GLP-1 receptor agonists are associated with decreased cancer incidence in diabetic and obese patients.
ESMO COMMITMENT
ESMO advocates for increased investment in cancer prevention research to reduce the risk of OACs.
GLP-1 receptor agonist use and cancer risk in obese nondiabetic adults
Hsu A. et al., Annals of Oncology (2026)
[Slide 2]
3. "Most Favoured Nation (MFN)"
KEY ISSUE
High U.S. drug prices compared with other high-income countries.
MFN pricing policies aim to align U.S. medicine prices with the lowest prices paid in comparable markets.
KEY INSIGHT
MFN pricing may also lead manufacturers to alter global pricing and launch strategies, with potential consequences for patient access to medicines worldwide.
ESMO COMMITMENT
ESMO advocates for fair, sustainable pricing and reimbursement of cancer medicines, promoting value-based access and affordability while safeguarding timely patient access to innovative cancer treatments worldwide.
Most-Favoured-Nation pricing for prescription drugs in US Medicare: a cohort study
Thomas J Hwang et al., The Lancet (2026)
[Slide 3]
6. AI for Clinical Decision-Making
KEY ISSUE
AI-driven clinical decision-making in oncology.
Autonomous AI agents are increasingly capable of supporting complex oncology clinical decision-making.
KEY INSIGHT
AI agents can perform oncology decision-making tasks at near expert level in selected scenarios but require rigorous validation, governance, and human oversight is needed.
ESMO COMMITMENT
ESMO promotes safe and responsible AI adoption in cancer care through its Artificial Intelligence and Digital Oncology (AIDO) Committee and ESMO Basic Requirements for AI-Based Biomarkers in Oncology (EBAI), advancing real-world evidence, validation standards, transparency and human oversight.
Development and validation of an autonomous artificial intelligence agent for clinical decision-making in oncology
Ferber D. et al., Nature (2026).
[Slide 4]
10. Oncology Workforce Crisis
KEY ISSUE
Growing global cancer workforce shortage.
An estimated 100 million healthcare worker shortfall by 2050 threatens our ability to deliver quality care.
KEY INSIGHT
Without urgent investment in training, retention, wellbeing, and multidisciplinary cancer teams, workforce shortages will continue to worsen while cancer incidence rises.
ESMO COMMITMENT
ESMO advocates for policy solutions to the cancer workforce crisis and supports the EU's efforts to reduce burnout by strengthening psychosocial risk prevention.
ESMO Resilience Task Force Reaccommodation's to Manage Psychosocial Risks, Optimise Well-Being and Reduce Burnout in Oncology.
Lim KHJ et al., ESMO Open (2024).
#ESMO26 How much benefit could adjuvant pembrolizumab + belzutifan provide over surveillance in high-risk ccRCC?
An indirect comparison using reconstructed survival data from KEYNOTE-564 and LITESPARK-022 (N=2,835).
📌DFS: HR 0.55 (95% CI 0.45–0.69)
📌 24-month DFS: 79.4% vs 67.8% with placebo
📌Absolute DFS gain: 11.6%
📌OS: HR 0.56 (95% CI 0.35–0.89), an early exploratory signal
@UroToday @myESMO
[Slide 1]
Study design (reconstructed individual survival data)
KEYNOTE-564
Phase 3, randomised, placebo-controlled
■ Pembrolizumab (A) n = 496
■ Placebo (B) n = 498
LITESPARK-022
Phase 3, randomised, placebo-controlled
■ Pembro + belzutifan (C) n = 921
■ Pembro + placebo (D) n = 920
Digitisation of published Kaplan–Meier curves (DFS and OS)
WebPlotDigitizer v5.7 · numbers at risk, events and censoring
Reconstruction of individual time-to-event data
Guyot iterative algorithm · R v4.5.3
Validation against published curves, HRs and event counts
No difference between pembrolizumab arms (A) vs (D)
Pooled pseudo-individual dataset · N = 2,835
Indirect comparison: Pembro + belzutifan (C) vs placebo (B)
Cox proportional hazards models · DFS (primary) and OS (secondary)
[Slide 2]
2,835 patients in the pooled reconstructed dataset
994 KEYNOTE-564 arms A + B
1,841 LITESPARK-022 arms C + D
~85% M0 intermediate-to-high risk in all arms
Comparable populations: age, sex, ECOG PS and risk category were similar (all P ≥ 0.05). Race/ethnicity differed (P < 0.01) and PD-L1 data were more often missing in LITESPARK-022. Reconstructed pembrolizumab curves did not differ between trials (DFS and OS).
Table 1. Baseline characteristics across KEYNOTE-564 and LITESPARK-022
Characteristic | KEYNOTE-564: Pembrolizumab (A) n = 496 | Placebo (B) n = 498 | LITESPARK-022: Pembro + belzutifan (C) n = 921 | Pembro + placebo (D) n = 920 | P value (B) vs (C) | (A) vs (D)
Median age, years (range) | 60 (27–81) | 60 (25–84) | 59 (20–91) | 60 (24–86) | – | –
Male sex, n (%) | 347 (70%) | 359 (72%) | 673 (73%) | 642 (70%) | 0.74 | 0.99
ECOG PS 1, n (%) | 75 (15%) | 72 (15%) | 133 (14%) | 143 (16%) | 0.99 | 0.90
Radical nephrectomy, n (%) | 459 (93%) | 459 (92%) | NA | NA | – | –
Race or ethnic group, n (%) | | | | | <0.01 | <0.01
American Indian or Alaska native | 10 (2%) | 2 (0%) | – | –
Asian | 63 (13%) | 75 (15%) | – | –
Black | 7 (1%) | 5 (1%) | – | –
Multiple | 8 (2%) | 5 (1%) | – | –
White | 372 (75%) | 376 (76%) | 576 (63%) | 581 (63%)
Missing data | 36 (7%) | 35 (7%) | 42 (5%) | 24 (3%)
PD-L1 CPS, n (%) | | | | | 0.59 | 0.60
<1 | 124 (25%) | 113 (23%) | 222 (24%) | 217 (24%)
≥1 | 365 (74%) | 383 (77%) | 547 (59%) | 502 (55%)
Missing | 7 (1%) | 2 (0%) | 152 (17%) | 201 (22%)
Risk category, n (%) | | | | | 0.057 | 0.058
M0 intermediate-to-high risk | 422 (85%) | 433 (87%) | 779 (85%) | 782 (85%)
M0 high risk | 40 (8%) | 37 (7%) | 58 (6%) | 53 (6%)
M0 other | 5 (1%) | 0 (0%) | – | –
M1 NED | 29 (6%) | 28 (6%) | 84 (9%) | 84 (9%)
Sarcomatoid features, n (%) | | | | | 0.75 | 0.46
Present | 52 (10%) | 52 (12%) | 104 (11%) | 84 (9%)
Absent | 414 (84%) | 415 (83%) | 730 (79%) | 724 (79%)
Unknown | 30 (6%) | 24 (5%) | 87 (9%) | 112 (12%)
P values by χ2 test. ECOG PS, Eastern Cooperative Oncology Group performance status; NA, not available; NED, no evidence of disease. CPS, combined positive score. Percentages as reported in the publication.5
[Slide 3]
HR 0.55 — DFS, (C) vs (B) — 95% CI 0.45–0.69; P < 0.001
79.4% — 24-mo DFS, (C) vs 67.8% with placebo (B)
+11.6 — percentage points absolute DFS gain at 24 months
HR 0.56 — OS, (C) vs (B) — 95% CI 0.35–0.89; P = 0.014
A Disease-free survival: pembrolizumab + belzutifan vs placebo
Legend: Placebo (n = 498); Pembrolizumab + belzutifan (n = 921)
No. of Events
Pembrolizumab + belzutifan 186
Pembrolizumab 151
Hazard ratio, 0.55 (95% CI, 0.45–0.69)
P < .001
Y axis DFS (%); X axis Months
No. at risk (0,5,...,40 months)
Placebo: 498 439 389 341 209 145 56 19 1
Pembrolizumab + belzutifan: 921 867 824 735 599 417 153 60 0
Survival table
Endpoint: DFS, pembrolizumab + belzutifan (C) vs placebo (B), reconstructed indirect comparison
Pembrolizumab + belzutifan (C) | 921
Placebo (B) | 498
HR: 0.55
HR CI: 0.45-0.69
P: <0.001
Landmark rates:
24 months: Pembrolizumab + belzutifan (C) 79.4% | Placebo (B) 67.8%
[Slide 4]
B Overall survival: pembrolizumab + belzutifan vs placebo
Legend: Placebo (n = 498) | Pembrolizumab + belzutifan (n = 921)
Y axis: OS (%) ; X axis: Months
No. of Events
Pembrolizumab + belzutifan 38
Pembrolizumab 33
Hazard ratio, 0.56 (95% CI, 0.35-0.89)
P = .014
No. at risk (months 0, 5, 10, 15, 20, 25, 30, 35, 40):
Placebo: 498 494 485 480 336 209 117 48 3
Pembrolizumab + belzutifan: 921 915 905 845 746 593 319 97 0
Survival table
Endpoint: OS
Placebo | 498
Pembrolizumab + belzutifan | 921
HR: 0.56
HR CI: 0.35-0.89
P: .014
Zach Klaassen@zklaassen_md
1) Slide: HRR gene alteration prevalence in prostate cancer liquid biopsy (N=18,691) · 2) Slide: Variant origin prediction by HRR gene (germline / tumor-somatic / CH-predicted), N=5,632 · 3) Kaplan-Meier survival data: TTNT and rwOS: CH-only vs germline/tumoral HRR alterations · 4) Biomarker data: CH-predicted mutations in samples collected before vs after PARPi exposure
Distinguishing clonal hematopoiesis (CH) from tumor HRR alts in liquid biopsy: Implications for PARPi use in mCRPC @urotoday #ESMO26 @EAntonarakis
📌5,632 HRRm; 56% arising from CH-predicted mutations only: 76% of ATM, 87% of CHEK2, 32% of BRCA1, 24% of PALB2
📌CH-only HRRm: less favorable TTNT (HR 3.24), rwOS (HR 3.52)
1) Slide: CCTG PR21: mean change from baseline in FACT-P total score and TOI, LuP vs Doc · 2) Slide: CCTG PR21: mean change from baseline in FACT-G and Physical Well Being, LuP vs Doc · 3) Slide: CCTG PR21: FACT-P and TOI responder categories at weeks 12 and 24, LU-P vs DOCE · 4) Slide: CCTG PR21: GP5 side effect bother, mean change and worst recorded score, LU-P vs DOC
Pt Reported QoL for Doce vs 177Lu-617-PSMA for mCRPC: Results from the 🇨🇦 CCTG PR21 Trial @urotoday #ESMO26
Doce vs 177Lu-617-PSMA:
📌Mean change in TOI: worse @ Wk 24 & Wk 30
📌Mean change in FACT-P: worse at Wk 24, Wk 30 & Wk 36
📌MCID: worse at Wk 24 vs Wk 12
1) Biomarker data: Niven Mehra: Anti-PD(L)1 in dMMR/MSI-H mAPMR — international · 2) Slide: Niven Mehra: KLK2 x CD3 T-cell engager pasritamig (JNJ-78278343) · 3) Trial design schema: Niven Mehra: Next-generation T-cell engager design · 4) Slide: Niven Mehra: Does masking widen the therapeutic window? JANX007 and VIR-5500
🚨⭐🔵 #ESMO26 | Emerging immune-based therapies in mCRPC
🎤 Presented by Niven Mehra
@OncoAlert
🔬 Immunotherapy in prostate cancer is finally becoming more nuanced: checkpoint blockade works in selected biologic subsets, while T-cell engagers are opening a new therapeutic frontier.
📌 KEY MESSAGES
🧬 1. Checkpoint inhibition has clear activity in dMMR / MSI-H mCRPC
International real-world data presented for dMMR/MSI-H mCRPC showed:
✅ ORR: 46%
✅ PSA50 response: 60%
✅ Median PFS: 7.7 months
✅ Median OS: 27 months
This is a critical reminder that prostate cancer is not uniformly immunologically “cold”—selected molecular subgroups can derive meaningful and durable benefit from anti–PD-(L)1 therapy.
📌 In contrast, the role of immunotherapy in TMB-high but microsatellite-stable mCRPC remains much less clear.
🧪 2. Beyond checkpoint blockade, four immune strategies are emerging
The talk reviewed a broader immunotherapy landscape in prostate cancer:
• T-cell engagers
• In-situ vaccines
• Oncolytic viruses
• CAR-T cells
Among these, CD3 T-cell engagers appear particularly advanced and clinically relevant.
🎯 3. T-cell engagers are showing encouraging early activity
Two key examples were highlighted:
Xaluritamig (STEAP1 × CD3)
• Novel bispecific T-cell engager targeting STEAP1
• Early data support proof of concept
• CRS occurred in 72%, but grade ≥3 CRS in only 2%, mostly confined to cycle 1 with step-up dosing
Pasritamig (KLK2 × CD3)
• First-in-class KLK2-directed engager
• 174 patients treated
• PSA50 at RP2D: 42.4%
• KLK2 may provide a more prostate-restricted target and potentially widen the therapeutic window
⚙️ 4. Next-generation engager design aims to improve tolerability
A key challenge for T-cell engagers remains cytokine release and off-tumor toxicity.
Strategies under development include:
• Masking / conditional activation
• Costimulation (signal 2)
• Alternative effectors
These innovations may help preserve efficacy while improving safety and outpatient feasibility.
⭐ MY POINT OF VIEW | CLINICAL PEARL
This talk highlights a very important shift:
Immunotherapy in prostate cancer is no longer a yes-or-no question. It is becoming a biomarker- and platform-specific question.
Checkpoint inhibitors are clearly relevant in dMMR/MSI-H disease, while T-cell engagers may expand immune-based treatment well beyond this small subset.
💡 The future of immune therapy in mCRPC will likely depend on matching the right immune strategy to the right tumor biology—and on engineering therapies that are not only active, but deliverable in practice.
For now:
✅ Test for dMMR/MSI-H
✅ Watch the evolution of T-cell engagers
✅ Expect immune therapy in prostate cancer to become increasingly selective, modular and precision-driven
@urologysummit @gbanna74 @ravikanesvaran @Uromigos @LosUromigos @nataliagandur
@brian_rini @tompowles1 @montypal @declangmurphy @salvolarosa @RenuEapen @seanmcbride @DrJaVallejo @Silke_Gillessen @crisbergerot @DrDanielHeng @apolo_andrea @DrChoueiri @PGrivasMDPhD @TiansterZhang @HHammersMD @neerajaiims @amerseburger @sonpavde @drenriquegrande @scserendipity1 @EfstathiouEleni @BraunMDPhD @cdanicas @AOmlin
@ecancer @UrologyTimes @urotoday @wearemedsir @OpenMedicineHQ @gu_onc
#ProstateCancer #mCRPC #Immunotherapy #TCellEngagers #PrecisionOncology #GUOncology
[Slide 1]
Anti-PD(L)1 checkpoint inhibition in dMMR / MSI-H mAPMR
International RWD patients with dMMR mAPMR on anti-PD-(L)1
46% ORR
60% PSA50 response
PFS across the entire cohort
mPFS 7.7 months (95% CI 5.2-11.7)
[PFS KM curve: Progression-free survival (proportion) vs Time in months 0-36; curve annotations 33%, 27%, 26%]
Number at risk: [illegible — low resolution]
[OS KM curve: Overall survival (proportion) vs Time (mo) 0-72]
Median OS 27 mo (95% CI 17.7-43.5)
Number at risk: [illegible — low resolution]
van Wilpe Eur Urol Oncol 2025 [partly illegible]
Speaker panel: Niven Mehra — Emerging immune-based therapies
Survival table
Endpoint: PFS and OS (real-world, anti-PD-(L)1 in dMMR/MSI-H mAPMR)
Entire cohort — PFS | 7.7 months | 5.2-11.7
Entire cohort — OS | 27 mo | 17.7-43.5
[Slide 2]
KLK2 × CD3 T-cell engager: pasritamig
174 patients (phase 1)
42.4% PSA50 at RP2D
Stein et al. J Clin Oncol 2025 — pasritamig (JNJ-78278343)
First-in-class KLK2 × CD3 bispecific. RP2D: 3.5 mg day 1, 18 mg day 8, 300 mg day 15, then every 6 weeks. Largest T-cell-engager dataset in prostate cancer to date.
[Waterfall plot — axis labels illegible]
[Safety table: columns All-Treated Population / RP2D Safety Population (IV Only); rows Participants with ≥1 TRAE, n (%); Serious TRAEs, n (%); Grade ≥3 TRAEs, n (%); TRAEs leading to treatment discontinuation, n (%) — cell values illegible at this resolution]
KLK2 is more prostate-restricted than PSMA, which may widen the therapeutic window.
Stein MN et al. J Clin Oncol 2025 [remainder illegible]
[Slide 3]
Next-generation engager design
Engineering approaches to limit cytokine release, antigen escape and on-target/off-tumour toxicity
MASKING / CONDITIONAL — Engager activated by tumour-associated proteases; systemic cytokine release markedly reduced. — VIR-5500 (PSMA (masked) × CD3 masked); JANX007 (PSMA × CD3 masked)
COSTIMULATION (signal 2) — CD28 or 4-1BB engager alongside a CD3 engager, providing co-stimulation and limiting exhaustion. — Nezastomig (REGN5678, PSMA × CD28); JANX007+ JANX013 (CD28 costimulation) [small text, partly illegible]
ALTERNATIVE EFFECTORS — Recruit γδ T cells or NK cells instead of conventional αβ T cells. — γδ-directed engagers; DLL3 and B7-H3 for NEPC [small text, partly illegible]
[References — illegible]
[Slide 4]
Does masking widen the therapeutic window?
First clinical signals with JANX007 and VIR-5500
MASKING / CONDITIONAL — Engager activated by tumour-associated proteases; systemic cytokine release markedly reduced.
VIR-5500 (PSMA (masked) × CD3 masked) — 1/51 (2%) with CRS ≥ G3 [small text, low resolution]
JANX007 (PSMA × CD3 masked) — 0/109 with CRS ≥ G3 [small text, low resolution]
JANX007: NR CRS; 0% CRS ≥ grade 3
[JANX007 schematic: PSMA BD, CD3ε BD, Cleavable linker, Mask, Albumin BD; BD = binding domain; Designed with PK extended half-life]
28% CRS; 2% CRS ≥ grade 3
VIR 5500 [schematic with labeled domains — illegible]
≥ 3000 µg/kg Q3W: 45% ORR
≥ 3000 µg/kg Q3W: 82% PSA50 response
[References — illegible]
David H Aggen, MD PhD@Dr_Aggen
Slide: GDFATHER-NEO Nature Medicine publication screenshot (Necchi et al., 24 Oct 2026)
Great discussion by Syed Hussain highlighting study out now from @AndreaNecchi
🚨 Now published in Nature Medicine: GDFATHER-NEO, a phase 2a study evaluating GDF-15 blockade with visugromab + nivolumab in cisplatin-ineligible MIBC.
Encouraging pathologic and radiographic responses without new safety signals. Small, nonrandomized study (N=31)—randomized validation needed.
#ESMO26 #BladderCancer
https://t.co/OKxs17xvVs
nature medicine
articles > article
Article | Open access | Published: 24 October 2026
Neoadjuvant nivolumab with or without visugromab in muscle-invasive bladder cancer: the phase 2a GDFATHER-NEO trial
Andrea Necchi, Chiara Mercinelli, Brigida A. Maiorano, Michela Piacentini, Antonio Cigliola, Roberto Iacovelli, Chiara Ciccarese, Chiara Ligato, Patrizia Giannatempo, Alessandro Rametta, Paolo Gontero, Francesco Soria, Christine Schuberth-Wagner, Joerg Wischhusen, Bernhard Rössler, ...
Julian Chavarriaga@chavarriagaj
1) Trial design schema: LITESPARK-034 TiP study design: belzutifan + zanzalintinib · 2) Trial design schema: LITESPARK-034 enrollment status world map
#ESMO26 Can dual HIF-2α + VEGF/MET/TAM inhibition improve outcomes after immunotherapy and VEGF-TKIs in advanced RCC?
🚨TiP - LITESPARK-034 It's aiming to answer that question: phase III trial evaluating belzutifan + zanzalintinib.
📌N≈758, randomized 1:1
📌Belzutifan 120 mg + zanzalintinib 60 mg daily vs belzutifan + placebo
📌Advanced ccRCC after anti–PD-(L)1 and VEGF-TKI therapy
📌Up to 3 prior systemic regimens permitted
📌Dual primary endpoints: PFS and OS
@UroToday @myESMO
[Slide 1]
Study design
Key Eligibility Criteria
• Histologically confirmed unresectable, advanced RCC with clear cell component
• Measurable disease per RECIST v1.1
• Disease progression during or after anti-PD-(L)1 therapy and VEGF-TKI in sequence or in combination
• Received ≤3 prior systemic regimens for metastatic disease
N ≈758 -> R 1:1
Belzutifan 120 mg PO QD + zanzalintinib 60 mg PO QD
Belzutifan 120 mg PO QD + placebo PO QD
Treatment will continue until unacceptable toxicity, disease progression, or participant or physician decision to withdraw
Stratification factors
• IMDC risk (favorable vs intermediate vs poor)
• Number of prior TKI (1 vs 2 or 3)
• Prior cabozantinib (yes vs no)
Primary end points:
• PFS per RECIST v1.1 by BICR and OS
Key secondary end point:
• ORR per RECIST v1.1 by BICR
Secondary end points:
• DOR per RECIST v1.1 by BICR, safety, and PROs
IMDC, International Metastatic RCC Database Consortium; PO, by mouth; QD, once daily; R, randomization.
[Slide 2]
Status
[World map with enrolling countries shaded]
Sites currently open to enrollment for LITESPARK-034
• The study is currently enrolling in Argentina, Australia, Brazil, Chile, Czechia, Denmark, France, Germany, Greece, Israel, Italy, Netherlands, Poland, Republic of Korea, Spain, Türkiye, United Kingdom, and the United States
Julian Chavarriaga@chavarriagaj
1) Biomarker data: NIAGARA mutational landscape and association of driver alterations with pCR · 2) Biomarker data: NIAGARA EFS benefit in mutation-defined subgroups forest plot
#ESMO26 Can molecular profiling identify who benefits most from perioperative durvalumab in MIBC?
Exploratory genomic/transcriptomic analyses from NIAGARA.
🔹 TP53alt in 50% of tumors, co-occurred with RB1, while mutually exclusive with FGFR3.
🔹ERCC2-mutated tumors achieved 75% pCR across treatment arms.
🔹 EFS benefit: TMB-high HR 0.44; TP53-mutated HR 0.51; FGFR3-mutated HR 0.24.
🔹 Immune-enriched subtypes: Basal-squamous HR 0.47; luminal-infiltrated HR 0.67.
🔹 Higher T-effector infiltration and IFNγ signaling were associated with greater benefit.
@UroToday @myESMO
[Slide 1]
NIAGARA: Mutational Landscape & Association of Driver Alterations
Select DDR-related gene alterations were associated with higher pCR rates in analysis of the combined-treatment arms
Top mutated cancer driver genes
TP53 50.1% | ARID1A 21.9% | KDM6A 18.4% | RB1 17.0% | KMT2D 14.0% | PIK3CA 13.3% | FGFR3 10.8% | ERBB2 6.9% | TSC1 6.6% | ELF3 6.4% | CDKN1A 6.4% | STAG2 5.7% | CREBBP 5.2% | EP300 4.7% | ERCC2 4.7% | RBM10 4.7% | KMT2C 4.4% | FAT1 4.4% | CDKN2A 4.2% | ZFP36L1 4.2%
TP53 (50%) represented the most frequent mutation, significantly co-occurring with RB1, and is mutually exclusive with FGFR3
TMB status: High | Low. Alterations: Missense | Truncating | Splice site | In-frame indel | Multiple
Association of gene mutation with probability of pCR (combined-arm analysis)
[forest plot, OR (log OR); P<0.05 vs Non-significant; Favours pCR | Favours non-pCR]
Increased pCR rates in patients with ERCC2, KMT2C, and FAT1 mutations
ERCC2 (12/16, 75%) | KMT2C (11/15, 73%) | FAT1 (14/18, 78%)
pCR rates in patients with gene mutation
DDR, DNA damage response; OR, odds ratio; pCR, pathological complete response; TMB, tumour mutational burden
[Slide 2]
NIAGARA: EFS Benefit in Mutation-Defined Subgroups
Addition of perioperative durvalumab to NAC consistently improved EFS across mutation-defined subgroups, with numerical increase of benefit for TMB-high and TP53- and FGFR3-mutated subgroups
Population/subgroup | D arm | C arm | HR (95% CI)
ITT (N=1063) | 533 | 530 | 0.68 (0.56-0.82)
BEP (n=407) | 209 | 198 | 0.64 (0.45-0.89)
TMB-high | 84 | 77 | 0.44 (0.25-0.76)
TMB-low | 125 | 121 | 0.82 (0.53-1.26)
TP53 mutated | 107 | 97 | 0.51 (0.32-0.81)
TP53 WT | 102 | 101 | 0.81 (0.49-1.31)
FGFR3 mutated | 20 | 24 | 0.24 (0.07-0.87)
FGFR3 WT | 189 | 174 | 0.70 (0.49-0.99)
TP53CC mutated (pathway) | 129 | 125 | 0.58 (0.38-0.88)
RTK mutated (pathway) | 86 | 82 | 0.49 (0.28-0.85)
DDR mutated (pathway) | 50 | 48 | 0.72 (0.36-1.43)
Histone-mod mutated (pathway) | 83 | 85 | 0.63 (0.37-1.08)
Chromatin remodelling (pathway) | 54 | 44 | 0.48 (0.23-0.98)
EFS HR (log scale): Favours D arm | Favours C arm
Graph depicts EFS HR (square) and 95% confidence intervals (lines), and was assessed by the Cox proportional hazards model, with treatment as the only covariate and ties handled by the Efron approach.
BEP, biomarker-evaluable population; C, comparator; CC, cell cycle; CI, confidence interval; D, durvalumab; DDR, DNA damage response; EFS, event-free survival; HR, hazard ratio; ITT, intention-to-treat population; NAC, neoadjuvant chemotherapy; RTK, receptor tyrosine kinase; TMB, tumour mutational burden; WT, wild-type.
marco stellato@marcos130990
Slide: Photo/capture of presented ESMO 2026 slide
P+EV shows promising activity in collecting duct and renal medullary carcinomas! 🧬
We’ve worked hard to get here, and the road is still long.
Proud of our team! 👏
@g_procopio_ @elena_verzoni
#ESMO26 #GUOncology #RareCancers https://t.co/i6p3QkivXY
Acknowledgements
• Special thanks to Gabriel Malouf, Pavlos Msaouel, Camillo Porta, Matteo Brunelli, Sebastiano Buti, Veronica Huber, Licia Rivoltini, Francesca Vignani, Veronica Prati, Marco Barella, Elena Verzoni and Marco Stellato who contributed to the preparation of this abstract and to conduct the REPRINT trial
#JunGuo with ivonescimab in favorable risk #kidneycancer — VEGF-PD1 bispecific treatment in favorable risk #kidneycancer — long PFS in this pt population, few pts but 65% ORR, less hypertension, a few more proteinuria.
@oncoalert #ESMO26 @myESMO https://t.co/3y8pYfxMKE
1) Trial design schema: KEYNOTE-564 final analysis study · 2) Kaplan-Meier survival data: KEYNOTE-564 final analysis: DFS · 3) Kaplan-Meier survival data: KEYNOTE-564 final analysis: OS
@DrChoueiri w last, very last update of #Keynote564 pembrolizumab for adjuvant #kidneycancer. Ongoing overall survival benefit — even 7+ years out.
@oncoalert #ESMO26 @myESMO https://t.co/RzNWvKHPuq
[Slide 1]
KEYNOTE-564 Study Design (NCT03142334)
Median study follow-up: 85.9 months (range, 76.6-103.2)
Key Eligibility Criteria
• Age ≥18 years
• Histologically confirmed clear cell RCC
• No prior systemic therapy for advanced disease
• Surgery ≤12 weeks prior to randomization
• Postnephrectomy intermediate-high risk of recurrence (M0): – pT2, grade 4 or sarcomatoid, N0 – pT3, any grade, N0
• Postnephrectomy high risk of recurrence (M0): – pT4, any grade, N0 – Any pT, any grade, N+
• Postnephrectomy and complete resection of metastasis (M1 NED)
• ECOG PS score of 0 or 1
R 1:1
N = 496: Pembrolizumab 200 mg IV Q3W for ~1 year (≤17 cycles)
N = 498: Placebo IV Q3W for ~1 year (≤17 cycles)
Stratification Factors • M stage (M0 vs M1 NED) • M0 group further stratified: – ECOG PS score of 0 vs 1 – US vs rest of the world
End Points
Primary: DFS by investigator assessment
Key secondary: OS
Other secondary: Safety
Exploratory: DFS and OS by protocol-defined risk subgroups and sarcomatoid features
Data cutoff date: February 4, 2026.
[Slide 2]
DFS by Protocol-Defined Risk Subgroup
Intermediate-high: HR 0.71 (95% CI, 0.58-0.87)
Pembro landmarks 63.5% | 62.1% | 59.8%; Placebo 55.5% | 52.3% | 48.3%
No. at risk (0–108 mo, every 12): Pembro 422 348 314 287 253 228 209 95 21 0; Placebo 433 340 299 274 239 211 190 88 15 0
High: HR 0.54 (95% CI, 0.31-0.94)
Pembro landmarks 44.6% | 44.6% | 44.6%; Placebo 29.1% | 26.2% | 19.4%
No. at risk: Pembro 40 26 18 18 17 16 15 8 1 0; Placebo 37 19 14 12 10 10 9 3 0 0
M1 NED: HR 0.50 (95% CI, 0.26-0.96)
Pembro landmarks 48.9% | 36.2% | 36.2%; Placebo 27.6% | 23.0% | 23.0%
No. at risk: Pembro 29 23 22 18 15 12 8 2 1 0; Placebo 28 13 10 8 8 6 5 3 0 0
Data cutoff date: February 4, 2026.
Survival table
Endpoint: DFS by protocol-defined risk subgroup (investigator)
Intermediate-high: Pembro | 422
Intermediate-high: Placebo | 433
High: Pembro | 40
High: Placebo | 37
M1 NED: Pembro | 29
M1 NED: Placebo | 28
HR: Int-high 0.71; High 0.54; M1 NED 0.50
HR CI: 0.58-0.87; 0.31-0.94; 0.26-0.96
[Slide 4]
OS by Protocol-Defined Risk Subgroup
Intermediate-high: HR 0.66 (95% CI, 0.48-0.91)
Pembro landmarks 89.2% | 87.5% | 84.7%; Placebo 83.7% | 80.9% | 78.0%
No. at risk: Pembro 422 413 405 396 385 371 362 201 46 0; Placebo 433 425 410 [illegible] 375 358 346 180 42 0
High: HR 0.92 (95% CI, 0.44-1.90)
Pembro landmarks 75.0% | 72.5% | 61.4%; Placebo 73.0% | 70.3% | 67.6%
No. at risk: Pembro 40 38 36 35 32 30 29 16 1 0; Placebo 37 35 32 29 27 27 26 14 2 0
M1 NED: HR 0.54 (95% CI, 0.19-1.53)
Pembro landmarks 86.1% | 82.5% | 78.1%; Placebo 70.6% | 66.9% | 66.9%
No. at risk: Pembro 29 29 27 26 25 24 23 9 2 0; Placebo 28 24 22 21 21 19 18 10 1 0
Data cutoff date: February 4, 2026.
Survival table
Endpoint: OS by protocol-defined risk subgroup
Intermediate-high: Pembro | 422
Intermediate-high: Placebo | 433
High: Pembro | 40
High: Placebo | 37
M1 NED: Pembro | 29
M1 NED: Placebo | 28
HR: Int-high 0.66; High 0.92; M1 NED 0.54
HR CI: 0.48-0.91; 0.44-1.90; 0.19-1.53
Panagiotis Vlachostergios@Panos_Vlach
1) Slide: Poster : De novo vs metachronous metastatic prostate cancer clinicogenomic analysis · 2) Slide: Poster : Early-onset vs average-onset prostate cancer clinicogenomic differences
At #ESMO26, come by our posters exploring the clinicogenomic landscape of #ProstateCancer
#2225: De novo vs metachronous
#2256: Early- vs average-onset
Insights into #genomics,#tumor #biology,#survival
#GUOnc @ChrisKyriakoMD
@DrRanaMcKay @LiuUw
@DavidJarrardMD @aserritella1984 https://t.co/BcyCCY8nIW
[Slide 1]
De Novo vs Metachronous Metastatic Prostate Cancer (mPC): A Comprehensive Clinicogenomic Analysis
ESMO 2026 Poster #2225
Panagiotis J. Vlachostergios, Anthony V. Serritella, Amy K. Taylor, John M. Floberg, Yingying Yu, Stamatina Fragkogianni, Kayla Viets Layng, Rana R. McKay, David F. Jarrard, Glenn Liu, Joshua M. Lang, Christos E. Kyriakopoulos
[affiliations: University of Ioannina; Weill Cornell Medicine; University of Wisconsin; Tempus AI; UC San Diego; Henry Dunant Hospital Center, Athens — small text]
INTRODUCTION
❑ The differences between de novo and metachronous mPC are incompletely characterized.
❑ This study compared demographic, clinical, molecular, and immunologic features between de novo and metachronous mPC.
METHODS
The Tempus Lens Platform was used to query the multimodal de-identified database to establish and subsequently analyze a cohort of patients diagnosed with mPC who underwent genomic profiling with xT (DNA) and xR (RNA) (n = 6,306).
Patients were classified as de novo (Stage IV at diagnosis) or metachronous (Stage I–III at diagnosis with progression to Stage IV >180 days later).
De Novo n = 6,171 Metachronous n = 135
❑ Immune cell proportions were estimated from RNA using quanTIseq.
❑ Differential gene expression analyses were conducted using Wilcoxon rank-sum tests with Benjamini-Hochberg correction.
❑ Gene set enrichment analysis was conducted using the Hallmark libraries.
❑ Groups were compared using Wilcoxon rank-sum tests or chi-squared tests as appropriate.
RESULTS
Figure 1. Treatment with prostatectomy or radiation was more common in patients with metachronous disease (prostatectomy: 57% vs 5.2%, radiotherapy: 92% vs 22%, p<0.001).
Figure 2. Treatment with upfront chemotherapy with ADT +/- ARPI was more common in de-novo metastatic pts (15.7% vs 8.1%, p=0.037).
Figure 3. Metachronous pts were enriched for APLNR (13% vs 4.7%, p<0.001) and ZMYM3 somatic alterations (11% vs 4.8%, p<0.001), while most canonical prostate cancer drivers (e.g., TP53, PTEN, ERG) had a similar frequency between groups.
[Fig 3 bar labels, de novo/metachronous %: APLNR 4.5/12.6; ZMYM3 4.7/11.1; LRP1B 9.4/14.8; FOXA1 13.9/20.0; SPOP 10.6/10.4; TP53 32.2/34.1; PTEN 25.6/26.7; ERG 36.1/39.3 — small text, verify against source]
Figure 4. Metachronous pts demonstrated increased regulatory T cell and natural killer cell infiltration as estimated by quanTIseq (p<0.001).
Figure 5. Inflammatory signaling (TNFα/NF-κB) and KRAS-related pathways were enriched in metachronous pts.
SUMMARY
❑ Metachronous mPC is a distinct entity characterized by lower PSA at diagnosis, greater prior local therapy exposure, unique genomic alterations, and a more immunologically suppressed tumor microenvironment compared to de novo disease.
❑ Future work should investigate therapeutic vulnerabilities and differences in survival associated with metachronous vs. de novo disease.
ACKNOWLEDGMENTS: We thank Vanessa Nepomuceno, PhD for assistance with poster preparation.
[Slide 2]
Clinicogenomic Differences Between Early-Onset (EO-PCa) and Average-Onset Prostate Cancer (AO-PCa): A Large-Scale Retrospective Cohort Study
ESMO 2026 Poster #2256
Christos E. Kyriakopoulos, Panagiotis J. Vlachostergios, Anthony V. Serritella, Amy K. Taylor, John M. Floberg, Yingying Yu, Stamatina Fragkogianni, Kayla Viets Layng, Rana R. McKay, David F. Jarrard, Glenn Liu, Joshua M. Lang
[affiliations: UW–Madison; Henry Dunant Hospital Center, Athens; University of Ioannina; Weill Cornell; Tempus AI; UC San Diego — small text]
INTRODUCTION
❑ Early-onset prostate cancer (EO-PCa) is increasingly recognized as biologically distinct, but its clinical behavior, molecular features, and outcomes relative to average-onset (AO-PCa) disease remain incompletely characterized.
SUMMARY
• EO-PCa exhibits distinct clinical and molecular characteristics compared to AO-PCa.
• OS appears to be driven by a combination of age and tumor biology.
METHODS
The Tempus Lens platform was used to query the de-identified, multimodal database for patients diagnosed with metastatic prostate cancer (N= 6,967) tested with Tempus xT (DNA-seq) and xR (RNA-seq).
Eligible de novo metastatic patients had a sample collected within 60 days of diagnosis and were stratified by onset age (EO-PCa ≤55 years; AO-PCa >55 years).
❑ Clinicogenomic characteristics were compared using Wilcoxon rank-sum tests or chi-squared tests as appropriate.
❑ Real-world overall survival (rwOS) was defined as the time from sample collection to death or loss to follow up.
❑ Median rwOS (mOS) was estimated using Kaplan-Meier (KM) curves and compared using log-rank tests. Hazard ratios (HR) were estimated using Cox proportional hazards models. Risk set adjustment was used to account for immortal time bias.
RESULTS
Figure 1. Frequency of primary radiotherapy or prostatectomy treatment in EO-PCa vs. AO-PCa. Patients with EO-PCa were more likely to undergo primary treatment (radiotherapy: 37.2% vs 26.4%; prostatectomy: 18.7% vs 10.4%, p<0.001).
Figure 2. Selected molecular differences between EO-PCa and AO-PCa. EO-PCa was enriched for germline BRCA2 variants (4.8% vs 2.6%, p=0.019), TMPRSS2 fusions (39.7% vs 34.7%, p=0.015), and ERG fusions (41.1% vs 36.6%, p=0.031). Somatic FOXA1 (15.4% vs 9.4%, p<0.001) and SPOP mutations (11.1% vs. 8.2%, p=0.033) were more common in AO-PCa.
Figure 3. Median real-world OS for EO-PCa vs. AO-PCa. EO-PCa was associated with longer mOS in the overall cohort [42 vs 32 months, HR = 1.51 (95% CI 1.26-1.81), p<0.001] and in SPOP-alt and TP53-alt sub-cohorts.
[Fig 3 bars, EO/AO months: Overall 42.0/32.0; SPOP alt 67.1/52.0; TP53 alt 33.8/25.9]
Figure 4. Association of SPOP and TP53 alterations with real-world OS in AO-PCa and EO-PCa. SPOP alterations were prognostic for favorable mOS compared to wild-type (AO-PCa: 52 months vs 30.7 months, p<0.001; EO-PCa: 67.1 months vs 41.7 months, p= 0.41). TP53 alterations were prognostic for worse mOS compared to wild-type (AO-PCa: mOS 25.9 months vs 37.9 months, p<0.001; EO-PCa: mOS 33.8 vs 55.9 months, p<0.001).
[Fig 4: four KM panels — A. SPOP Alterations in AO-PCa (Age >55); B. SPOP Alterations in EO-PCa (Age <=55); C. TP53 Alterations in AO-PCa (Age >55); D. TP53 Alterations in EO-PCa (Age <=55); panel p-values printed: A p = 1.79e-09, B p = 0.414, C p = 2.4e-25, D p = 0.000649 — small text]
ACKNOWLEDGMENTS: We thank Vanessa Nepomuceno, PhD for assistance with poster preparation.
Francesco Massari@fmassari79
Slide: AVESEC trial (GOIRC-02-2025) trial-in-progress poster with presenters
Great to be at #ESMO26 with my colleague @vmollica7 presenting the poster of our investigator-initiated AVESEC trial!
Exploring avelumab maintenance after second-line platinum-based chemotherapy in metastatic urothelial carcinoma.
@myESMO @OncoAlert https://t.co/BsjaBQtrI2
1) Slide: Rainer Hamacher: Emerging Targets for Theranostics in Solid Tumors · 2) Slide: Sandra P. D'Angelo: A decade of lessons — TCR T-cell therapy in sarcoma · 3) Trial design schema: The real-world eligibility funnel (afami-cel cohort 1 CONSORT) · 4) Slide: Conclusions - T-cell therapies in sarcoma (Sandra P. D'Angelo, ESMO 2026)
Great presentation by @sandrapdangelo on T-cell therapies in #sarcoma. TCRs clearly work for cancer-testis antigens in select patients and interesting data on TILs to be presented at #ESMO2026 on monday. However, patient selection still restricts who is eligible - target expression, HLA subtype…and geography! Afami-cell only approved by FDA, no other agent.
@myESMO @ctosociety @pawel_sobczuk
[Slide 1]
Emerging Targets for Theranostics in Solid Tumors
[Diagram: y-axis Expression (Tumor cells), x-axis Expression (CAFs/Stroma), Immune cells at origin]
Established (highlighted):
NIS – Radioiodine (131I)
SSTR2 – Lutathera® (177Lu-Dotatate)
NET – Metaiodobenzylguanidine (131I-MIBG)
PSMA – Pluvicto® (177Lu-PSMA) +endothelium
Clinical/Preclinical (italic):
Her2, GRPR, DLL3, CAIX, Frα, Integrins (αvβ6), GD2
EphA2
B7-H3
MT1-MMP
Integrins (αvβ3) endothelium
CXCR4 – 177Lu-PentixaTher
PD-L1
CD8, Granzyme B
LRRC15
FAP – different FAP-Inhibitors (FAPIs)
Legend: Established | Clinical | Preclinical
Rainer Hamacher
[Slide 2]
A decade of lessons
2013 — Lete-cel (NYESO-1) TCR in synovial sarcoma: ORR 20-50%; DOR 15-30 weeks
• Higher LDR impacts efficacy (Flu 120mg/m2 + Cy 2700mg/m2)
• Bridging therapy is essential option
• Correlates of response: expansion, persistence, IL15 levels, depletion of lymphocytes
• Correlates of resistance: loss of HLA expression & Ag presenting machinery
2016 — Lete-cel (NYESO-1) TCR in myxoid round cell liposarcoma: ORR 20-40%; DOR 5-7m
• Correlates of response: Expansion, persistence, IL15 levels, depletion of lymphocytes
• Tocilizumab doesn't appear to impact efficacy
2019 — Afami-cel (MAGE-A4 TCR) in synovial sarcoma + MRCLS: ORR 39% (SS), 25% (MRCLS); DOR 12m (SS), 4m (MRCLS)
• Clinical correlates: Lower disease burden, higher MAGEA4 expression, lack of bridging therapy
• Higher cell dose may impact efficacy
• Integrating cells early is likely better
FDA approved in 2024
2020 — Lete-cel (NYESO-1) TCR in synovial sarcoma + MRCLS: ORR 43%; DOR 12.2m
• Primary endpoint met
BLA planned for late 2026
Sandra P. D'Angelo, MD
D'Angelo SP Cancer Discovery 2018, D'Angelo SP JCO 2024, D'Angelo SP Lancet 2024
[Slide 3]
The real-world eligibility funnel
[Inverted funnel graphic, top to bottom:]
Sarcoma population: histology + clinical status
Biology: tumor antigen expression
Restriction: compatible HLA
Feasibility: manufacturing time, bridging, fitness
Outcome: response durability
[CONSORT flow diagram:]
373 patients pre-screened for HLA eligibility, MAGE-A4 expression, or both
-> 268 not positive for HLA or MAGE-A4
105 positive for both HLA and MAGE-A4
-> 42 not eligible or did not wish to enrol
63 enrolled into cohort 1 and underwent leukapheresis (ITT population)
-> 10 did not receive lymphodepletion chemotherapy
6 died due to disease progression
3 not eligible
1 withdrawn at investigator discretion
53 received lymphodepletion chemotherapy
-> 1 did not receive afami-cel (withdrew consent)
52 received afami-cel (modified ITT)
-> 6 ongoing in interventional phase at data cutoff (Aug 30, 2023)
46 completed interventional phase
-> 35 discontinued study
31 died
1 non-adherent to study requirements
2 withdrew consent
1 lost to follow-up
11 ongoing in long-term follow-up
Sandra P. D'Angelo, MD
[Slide 4]
Conclusions
Afamicel and letecel have shown promise in synovial sarcoma and myxoid round cell liposarcoma
• There is an on-going need to identify biomarkers of response/resistance
• Consideration of synergistic combinations may optimize efficacy (mRNA vaccines)
Leveraging cancer testis antigens as promising therapeutic targets through alternate therapeutic approaches, ie bispecific antibodies will continue to expand the field via off the shelf-options
Exploring alternate adoptive cell approaches, ie TIL, CAR-T as well as new targets, ie fusions will contribute to novel and exciting therapeutic options in the future and expand beyond the HLA restriction
@sandrapdangelo
dangelos@mskcc.org
Sandra P. D'Angelo, MD
Deborah Mukherji@dmukherji
Biomarker data: Conclusions - clonal hematopoiesis (CH) among HRR mutations in liquid biopsy, Emmanuel
Not all HRR mutations on liquid biopsy are tumour-derived in #prostateCancer
At #ESMO26, 56% of patients with detected HRR mutations had predicted CH-only alterations. These patients appeared to derive little benefit from PARPi monotherapy @EAntonarakis @OncoAlert https://t.co/IPUFQCNMzD
CONCLUSIONS
• There is a high prevalence of predicted CH among HRR gene mutations in liquid-biopsy samples (56% overall), including in BRCA1 (32%) and PALB2 (24%).
• Patients with predicted CH-only HRR alterations do not appear to benefit from PARPi monotherapy, highlighting the importance of accounting for HRR mutation origin in therapy selection.
• Some CH-predicted mutations are enriched in samples after PARPi exposure, including TP53, NF1, pTERT and CBL.
Emmanuel S. Antonarakis, MD
Julian Chavarriaga@chavarriagaj
1) Trial design schema: IRONMAN registry: Figure 1 age-specific death rates by disease state · 2) Trial design schema: IRONMAN registry: Figure 3 hazard ratios for age at enrollment · 3) Slide: IRONMAN registry: Figure 4 OS in 20 mAPMS patients by Hannum epigenetic clock (A) and clonal
#ESMO26 Is chronological age telling us the whole story in advanced prostate cancer? an IRONMAN registry analysis of 4,332 patients showed:
📌Mortality followed a J-shaped pattern, with higher risk in the youngest and oldest patients
📌The excess risk in men <55 years attenuated after adjustment, while mortality remained elevated after age 75
📌Older patients received less chemotherapy and more ADT monotherapy
📌In an exploratory cohort (n=20), clonal hematopoiesis and epigenetic aging were associated with numerically worse survival
📌Age-related survival differences extend beyond treatment patterns, comorbidities and frailty.
@UroToday @myESMO
[Slide 1]
Figure 1. Age-specific death rates and 95% CI by disease state at enrollment.
Legend: mAPMS | APMR
Death Rate (per 1,000 person-years)
Age group at enrollment (in years): <55 | 55-59 | 60-64 | 65-69 | 70-74 | 75-79 | 80-84 | 85+
[Slide 2]
Figure 3. Hazard ratios (95% CI) for the association between age at enrollment and overall survival.
Panels: Disease state-stratified | +country, stage M1, PSA, treatment | +hyperlipidemia, diabetes, hypertension, smoking, frailty
Hazard Ratio (95% CI) [log axis 1, 2, 3; reference 60-64]
Age group at enrollment (in years): <55 | 55-59 | 60-64 | 65-69 | 70-74 | 75-79 | 80-84 | 85+
[Slide 3]
Figure 4. Overall survival in 20 patients with mAPMS by the (A) Hannum epigenetic clock and (B) clonal hematopoiesis (CH).
A: Overall survival; Time from Enrollment (years) 0-5; Hannum clock: Low | High
B: Overall survival; Time from Enrollment (years) 0-5; CH: CH- | CH+
Survival table
Endpoint: Overall survival (exploratory cohort, n=20 mAPMS)
Hannum clock Low
Hannum clock High
CH-
CH+
Alan Tan@alantanmd
1) Kaplan-Meier survival data: STAMPEDE M0 Decipher score and distant metastasis cumulative incidence · 2) Kaplan-Meier survival data: STAMPEDE M0 Decipher score and prostate cancer-specific mortality curves · 3) Kaplan-Meier survival data: Decipher score and distant metastasis in real-world data NCCN high/very
STAMPEDE M0 transcriptome classifier analysis at #ESMO26, presented by Sarah Howlett 🇬🇧
High-risk localized PC on RT ± abiraterone (n=401), plus RWD validation (n=5,956)
▪️ High genomic score linked to more distant mets (HR 1.72) and higher PC-specific mortality (HR 1.43 ADT; 1.60 ADT+abi)
▪️ Predicted abi benefit for DM in N0 (interaction p=0.01)
▪️ Low scores in very high risk may allow de-escalation
Needs further validation. @neerajaiims @DrRanaMcKay #ProstateCancer #GUonc
SL-28: an allogeneic cell therapy with no HLA matching and no conditioning, with responses across biologically distinct solid tumors.
📈 CR 33%, PR 33%, SD 33% in the interim analysis
🛡️ No GvHD, ICANS, or CRS so far
❓ denominator is tiny
Phase 1, hypothesis-generating but excited to follow
#ESMO26 #ClinicalTrials #Immunotherapy #ProstateCa #GUOnc
[Slide 2]
RESULTS: Duration of Disease Control
Rows: FL | PCa | PCa | NSCLC | NB | PCa | PDAC | BLCA | LCC | ACC | GC | PDAC
OS STATUS (per row): x | o | o | o | x | o | o | o | o | o | x | x
Duration (months): 0 | 5 | 10 | 15 | 20 | 25 | 30 | 35
According to RECIST 1.1:
CR, n=4 (33.3%)
PR, n=4 (33.3%)
SD, n=4 (33.3%)
PD, n=0 (0%)
-> Ongoing
X Death (non-cancer related)
x Death o Censored
Median duration of response in patients with CR/PR has not been reached
(abbreviation legend as on prior slide: ACC, BLCA, FL, GC, LCC, NB, NSCLC, PCa, PDAC)
[Slide 3]
CONCLUSIONS
SL-28 represents a novel class of cell therapy, demonstrating antitumor activity across multiple biologically distinct cancer types
CR: 33%; PR: 33%; SD: 33%
SL-28 (TELLS) cells are not genetically modified. Their antitumor activity is enhanced through a novel TezR-mediated activation approach, representing the first therapeutic application of this Novel Receptor System
SL-28 is an off-the-shelf, allogeneic cell therapy that does not require HLA matching or immunosuppressive conditioning. Clinical experience to date suggests a favorable safety profile, with no observed GvHD, ICANS, or CRS
George Tetz, MD, PhD
g.tetz@hmi-us.com
Julian Chavarriaga@chavarriagaj
1) Trial design schema: BNT324-03 phase III TiP study design: elfetabart drozuntecan (Elfe-D) · 2) Trial design schema: BNT324-03 TiP Table 1: key eligibility criteria · 3) Slide: BNT324-03 TiP Table 2: study endpoints
#ESMO26 🧬 Could B7-H3-targeted ADCs challenge docetaxel in mCRPC?
BNT324-03, phase III TiP evaluating elfetabart drozuntecan (Elfe-D), a B7-H3-directed ADC carrying a topoisomerase I inhibitor payload.
📌Early phase I/II data provide the rationale:
• PSA50: 42.9%
• Confirmed ORR: 35.8%
• Median rPFS: 11.3 months
• Activity also observed after prior ¹⁷⁷Lu-PSMA therapy
📌Phase III design:
• N≈736, randomized 1:1
• Elfe-D 6 mg/kg Q3W vs docetaxel 75 mg/m² Q3W
• Taxane-naïve mCRPC after 1–2 ARPIs
• Prior ¹⁷⁷Lu-PSMA and docetaxel for mHSPC permitted
• Dual primary endpoints: rPFS and OS
@UroToday @myESMO
[Slide 1]
Figure 4. Study design
Key eligibility criteria:
• Metastatic adenocarcinoma of the prostate
• Docetaxel-naïve in the mCRPC setting (prior docetaxel allowed for mHSPC)
• 1–2 prior ARPIs
• Prior Lu 177-RLT allowed
R (1:1) N≈736
Stratification factors:
• Prior Lu 177-RLT (yes/no)
• Prior taxane in mHSPC (yes/no)
• Site of metastasis (liver/bone/other)
Elfetabart drozuntecan (Elfe-D)a 6 mg/kg IV Q3W
Docetaxel 75 mg/m2 IV Q3Wa,b (up to 10 cycles)
Treatment until PCWG3-modified RECIST v1.1-defined progressive disease, unacceptable toxicity, withdrawal of consent, or other discontinuation criteria being met
a Patients treated with an LHRH agonist or antagonist must continue such treatment throughout the trial.
b Patients randomised to docetaxel will also receive prednisone or prednisolone.
[Slide 2]
Table 1. Key eligibility criteria
Key inclusion criteria
• Men aged ≥18 years
• ECOG PS 0 or 1
• Histological, pathological, and/or cytological confirmation of prostate cancer (adenocarcinoma histology only)
• ≥1 metastatic lesion on baseline CT/MRI, or ≥2 metastatic lesions on bone scan imaging
• Prior orchiectomy and/or ongoing ADT with castrate serum/plasma testosterone levels (<50 ng/dL or <1.7 nmol/L)
• Progressive disease based on ≥1 of the following:
• Serum/plasma PSA progression and PSA ≥1.0 ng/mL at screening
• Radiographic soft tissue progression (per PCWG3-modified RECIST v1.1)
• Radiographic progression of bone disease: evaluable disease or new bone lesion(s) by bone scan per PCWG3 criteria
• No prior systemic cytotoxic chemotherapy (including taxane-based) for mCRPC. Prior docetaxel for initial mHSPC treatment allowed if no radiographic progression and last dose ≥6 months pre-trial
• Previous treatment with 1–2 ARPIs and progressive disease during or after ≥8 weeks of ARPI (≥12 weeks for patients with bone progression)
• Prior Lu 177-RLT (or investigational PSMA-targeted radioligand) permitted if >8 weeks from completing treatment
• Patients with known BRCA mutations should have received previous treatment with PARPi, if available
Key exclusion criteria
• Uncontrolled and/or untreated brain metastasis
• Prior treatment with B7H3-targeted therapy, including B7H3 ADC
• Prior treatment with ADC with topoisomerase I inhibitor payload
• History of (non-infectious) ILD/pneumonitis that requires steroids, or current ILD/pneumonitis, or suspected ILD/pneumonitis that cannot be ruled out by imaging at screening
• Has uncontrolled or significant cardiovascular disease
[Slide 3]
Table 2. Study endpoints
Dual primary
• rPFS (by BICR per PCWG3-modified RECIST v1.1)
• OS
Secondary
• TFST, ORR (BICR), DOR (BICR), time to pain progression, investigator-assessed rPFS, time to first symptomatic skeletal-related event, time to PSA progression, PSA response rate, safety and tolerability
Exploratory
• Health-related quality of life (functional assessment of cancer therapy – prostate)
#ESMO26 Ivonescimab (AK112): Can a PD-1/VEGF bispecific work as 1L monotherapy in IMDC favorable-risk mRCC?
Ph Ib/II, single-arm study
🔹 n=26 enrolled
🔹 Ivonescimab 30 mg/kg Q3W
🚨Encouraging activity with monotherapy🚨
🔹 ORR: 65%
🔹 DCR: 96%
🔹 Tumor shrinkage: 87%
🔹 irORR: 69.6%
At median FU 13.3 mo:
🔹 12-mo PFS: 85.5%
🔹 24-mo PFS: 55.4%
🔹 No deaths to date
Safety:
🔹 Grade 3–4 TRAEs: 26.9%
🔹 Most common TRAEs: proteinuria 42.3%, rhinitis 38.5%, pruritus 34.6%
🔹 No treatment-related deaths
🔑 Early single-arm data suggest meaningful activity of PD-1/VEGF bispecific monotherapy in favorable-risk ccRCC, a population where the optimal balance between efficacy and treatment intensity remains an important question.
@urotoday
Himalayas-1: Rinzimetostat, an Allosteric PRC2 Inhibitor, + Daro: 🌎 Ph 3 RC in mCRPC Previously Treated with Abiraterone @urotoday #ESMO26 @quimmateo
📌n=600
📌1:1 to rinzimetostat + Daro vs physician’s choice of ARPI or docetaxel
📌Prim EP: rPFS
📌Sec EP: OS https://t.co/vC0NAFhFA2
[Slide 1]
Table 1. Key Eligibility Criteria
Inclusion
• Male patients aged ≥18 years
• Histologically or cytologically confirmed prostate adenocarcinoma without small cell features
• Progressive disease in the setting of surgical or medical castration, with evidence of disease progression as per PCWG3 on treatment with abiraterone ≥12 weeks in the mCSPC setting or first-line mCRPC setting
• Metastatic disease in bone documented on bone scan, or in soft tissue documented on CT/MRI scan
• ECOG PS of 0 or 1
• Adequate organ function
Exclusion
• Prior systemic anticancer therapy, beyond protocol-permitted abiraterone-based treatment and docetaxel in the mCSPC setting
• Radiotherapy within 2 weeks before randomization
• Known or suspected brain metastases or active leptomeningeal disease
• Clinically significant cardiovascular disease
• Active inflammatory gastrointestinal disease, chronic diarrhea, or previous gastric resection or lap-band surgery
[Slide 2]
Figure 1. Himalayas-1 Study Design
Select Eligibility Criteria
• Patients with mCRPC
• Prior abiraterone in mCSPC or mCRPC setting
• May have received docetaxel in mCSPC setting
R 1:1
Rinzimetostat 400 mg QD + Darolutamide 600 mg BID (n=300)
Physician's choice of control (ARPI or docetaxel) (n=300)
R 1:1 -> Darolutamide 600 mg BID / Enzalutamide 160 mg QD
Docetaxel 75 mg/m2 Q3W for up to 10 cycles
Endpoints
Primary Endpoint • rPFS
Key Secondary Endpoint • OS
Julian Chavarriaga@chavarriagaj
1) Slide: PAnTHA 225Ac-PSMA-Trillium: Figure 1 xerostomia incidence by dose · 2) Slide: PAnTHA: Figure 5 changes in salivary amylase (sAA) level by dose · 3) Slide: PAnTHA: Figure 6 PSA response by xerostomia grade
#ESMO26 Can we reduce the xerostomia burden of ²²⁵Ac-PSMA therapy?
A detailed xerostomia analysis from the phase I PAnTHA trial of ²²⁵Ac-PSMA-Trillium in heavily pretreated mCRPC (N=50) was presented:
📌Xerostomia was limited to grade 1–2, with no treatment discontinuations
📌At doses ≤125 kBq/kg, grade 2 xerostomia occurred in 22%, with improvement in 88% after treatment
📌At 150 kBq/kg, grade 2 xerostomia increased to 62%
📌Salivary gland radiation exposure increased with dose (p<0.0001)
📌Salivary α-amylase did not predict xerostomia severity (p=0.68)
@UroToday @myESMO
Efficacy and Safety of AK112 (Ivonescimab), a PD-1/VEGF Bispecific Antibody, as First-Line Treatment for Patients with IMDC Favorable-Risk Advanced Renal Cell Carcinoma (aRCC): Results from a Phase Ib/II Study
Xieqiao Yan, Xinan Sheng, Juan Li, Simin Li, Bixia Tang, Huichun Tian, Huayan Xu, Yan Kong, Jun Guo
Presenter: Jun Guo, MD
Peking University Cancer Hospital & Institute, Beijing, China
Jun Guo
Deborah Mukherji@dmukherji
Biomarker data: PROMPT (Niven Mehra): Replace, or complement? Tissue NGS vs plasma ctDNA by pathway
Can liquid biopsy replace tumour tissue in mCRPC?
PROMPT study at #ESMO26: ctDNA detected 82% of HRR-altered cases, adding 7% yield to tissue testing.
But PI3K/AKT alterations, particularly PTEN biallelic losses, were frequently missed @MehraNiven @OncoAlert https://t.co/BbaYEskD5C
Replace, or complement? The answer differs by pathway
BRCA1/2 + HRRm
[Venn: Tissue NGS / Plasma ctDNA] 11 tissue only | 46 both | 4 plasma only
n = 61 altered patients · circle and overlap areas proportional to patient numbers
why discordant
11 tissue-only: [bar] 7 | 4
4 plasma-only: [bar] 2 | 1 | 1
Legend: not evaluable — ctDNA fraction below the class floor; assessable, still discordant — biology; technical — coverage / SNP filter or annotation; no explanation identified
Plasma alone identifies 50 of 61 altered patients (82%); as an adjunct it adds 4 patients tissue missed (+7%).
Plasma-first is defensible for PARP-inhibitor eligibility.
PI3K / AKT
[Venn: Tissue NGS / Plasma ctDNA] 55 tissue only | 20 both | 13 plasma only
n = 88 altered patients · circle and overlap areas proportional to patient numbers
why discordant
55 tissue-only: [bar] 42 | 13
13 plasma-only: [bar] 9 | 4
Plasma alone identifies 33 of 88 altered patients (38%).
Plasma-first is not defensible; PI3K/AKT stays tissue-anchored.
Niven Mehra
Rashid K. Sayyid@RKSayyid
1) Trial design schema: RAMPART trial schema: resected RCC randomised 3:2:2 to active · 2) Slide: RAMPART patient-reported outcomes: overall health-related QoL and functioning, durvalumab · 3) Slide: RAMPART patient-reported outcomes: symptoms and financial difficulties, durvalumab minus
#ESMO26 RAMPART: What do detailed PROs show with adjuvant durvalumab vs active monitoring after RCC resection?
PRO analysis, n=218 (Durvalumab: 87; Active monitoring: 131)
🚨 Primary QoL endpoint at Mo 15 showed no difference between arms—but domain-level analyses told a different story.
At Week 16, durvalumab worsened:
🔹 OHQL: –7.4
🔹 Role function: –7.1
🔹 Cognitive function: –5.3
🔹 Fatigue: +5.5
🔹 Appetite loss: +5.8
At Mo 15:
🔹 Cognitive function remained worse: –7.1
🔹 Appetite loss: +7.4
🔹 Dyspnea: +7.5
🔹 Constipation: +12.2
🔑 A global QoL endpoint may miss clinically meaningful treatment effects across individual domains—some occurring during therapy, some persisting, and others emerging later.
@urotoday
[Slide 1]
Resected RCC at intermediate-high risk of recurrence, or completely resected metastatic disease
Randomisation
Allocation ratio 3:2:2
N=790
Arm A active monitoring (AM) N=340
Arm B durvalumab (D) 1500mg q4W for 1 year N=225
Arm C durvalumab 1500mg q4w for 1 year and tremelimumab (DT) 75mg at day 1 and week 4 N=225
1. Larkin J et al. RAMPART: first results. ESMO 2025.
2. Larkin J et al. Durvalumab monotherapy. ASCO 2026.
3. Merrick S et al. Patient reported outcomes. GU ASCO 2026.
[Slide 2]
OHQL & Functioning
Primary QoL outcome: Change in OHQL from baseline to Month 15 showed no evidence of a difference between arms.
Week 16
Adjusted mean difference from baseline** (durvalumab - AM)
Durvalumab better
Durvalumab worse
-7.4* OHQL
Physical functioning
-7.1* Role functioning
Social functioning
Emotional functioning
-5.3* Cognitive functioning
Month 15
OHQL
Physical functioning
Role functioning
Social functioning
Emotional functioning
-7.1* Cognitive functioning
Higher scores = better OHQL/functioning with durvalumab.
* Statistically significant and exceeded predefined domain-specific CMD thresholds: OHQL ≥4; Role function ≥6; Cognitive function ≥3.
** Adjusted for baseline QoL score and sex; all analyses were exploratory.
[Slide 3]
Symptoms & Financial Difficulties
Primary QoL outcome: Change in OHQL from baseline to Month 15 showed no evidence of a difference between arms.
Week 16
Adjusted mean difference from baseline** (Durvalumab - AM)
Durvalumab worse
Durvalumab better
+5.5* Fatigue
Nausea and vomiting
Pain
Dyspnoea
Insomnia
+5.8* Appetite loss
Constipation
Diarrhoea
Financial difficulties
Month 15
Fatigue
Nausea and vomiting
Pain
+7.5* Dyspnoea
Insomnia
+7.4* Appetite loss
+12.2* Constipation
Diarrhoea
Financial difficulties
Higher scores = worse symptoms/financial difficulties with Durvalumab.
* Statistically significant and exceeded predefined domain-specific CMD thresholds: Appetite loss ≥5; Dyspnoea ≥4; Constipation ≥5.
** Adjusted for baseline QoL score and sex; all analyses were exploratory.
Julian Chavarriaga@chavarriagaj
1) Slide: Neoantigen vaccination is highly immunogenic in RCC (Braun et al, Nature 2025) · 2) Biomarker data: Driver mutations elicit strong immune responses · 3) Slide: Vaccination induces durable T cell expansion and anti-tumor immunity (Braun, RCC)
#ESMO26 Great presentation by @BraunMDPhD discussing personalized neoantigen vaccines which are moving immune navigation from concept to reality in #RCC
🔹 9/9 patients: Successful personalized vaccine manufacturing
🔹 9/9 developed neoantigen-specific T-cell responses
🔹 RCC driver mutations (VHL, PBRM1, BAP1) elicited strong immune responses
🔹 9/9 demonstrated immune memory, with vaccine-induced T-cell responses persisting months to years
The challenge: Immune activation is not clinical efficacy. The next step is combining personalized vaccines with checkpoint blockade to sustain antitumor activity and demonstrate meaningful clinical benefit: INTerpath-004
@UroToday @myESMO
[Slide 2]
Neoantigen vaccination is highly immunogenic in RCC
Heatmap: Patient ID 101, 102, 104, 105, 106, 107, 108, 109, 110; Vaccination timepoints Week 0, 3, 8, 12, 16, 20, 24; Vaccination pool A-D; Immunizing peptides
Max values printed: 101: 1051; 102: 201; 104: 88; 105: 95; 106: 793; 107: 137; 108: 477; 109: 570; 110: 487
Normalized IFNγ ELISpot (Min per patient response to Max per patient response)
Week 16: Immunogenic / Not immunogenic; No. of peptides per pool
Ex vivo T cell response in all patients
Patient 101; Vaccine pool: A, B, C, D; IFNγ spot-forming cells (per 10^6 PBMCs) vs Time (weeks)
Deconvolution of immunogenic neoantigens
101; DMSO (no-restimulation); Pool A; Pool B; Pool C; Pool D
IFNγ spot-forming cells (per 3×10^4 PBMCs); Mutation encoded by vaccine peptide
Braun et al, Nature, 2025.
[Slide 3]
Driver mutations elicit strong immune resposnes
Strong response against VHLmut peptide
Patient 101: VHLmut - T cells reacting against VHL neoAg; DMSO - Negative control; HIV peptide - Negative control; PHA - Positive control (non-specifically activate T cells)
Immune responses against common RCC driver mutations
No. of patients vaccinated against driver mutations: VHL, PBRM1, BAP1, KDM5C, PIK3CA (Immunogenic / Not immunogenic)
No. of peptides: Driver mutations, Passenger mutations (Immunogenic / Not immunogenic)
[Slide 4]
Vaccination induces durable T cell expansion and anti-tumor immunity
Durable expansion of vaccine-reactive T cells
Prime, Boost, Boost; % TCR β-chain vs Weeks after first vaccination (0-160); n = 9 patients
Viral | Tumor | Vaccine
Vaccine-reactive T cells can recognize tumor cells
Pt. 101 week 16 PBMCs, in vitro expanded against PIK3CAmut peptide: Autologous whole tumor cells; DMSO
Pt. 109 week 16 PBMCs, in vitro expanded against PBRM1mut peptide: Autologous whole tumor cells; DMSO
IFNγ ELIspot
Test vaccine-reactive T cells against patient's own tumor
Patient ID 101-110; No. of vaccine peptide pools generating anti-tumor reactivity (Anti-tumor reactivity / No anti-tumor reactivity)
[Br]aun et al, Nature, 2025.
Roberto Iacovelli@DrIacovelli
1) Slide: Group selfie at poster 2227P — co-occurring genomic alterations in metastatic prostate cancer · 2) Slide: Poster 2227P: co-occurrence of targetable genomic alterations in mPC
What happen when we use extensive NGS analysis to choose 1st line for mHSPC/mAPMS PC?
How many pts have just one option and how many have cross genomic alterations? Look at our analysis presented by @DanielaArduini3 and GU group @Unicatt at #ESMO26. @OncoAlert
@myESMO @ciccarese_c @ZEROCancer @PCFnews
[Slide 1]
Incidence and patterns of co-occurrence of targetable genomic alterations in metastatic Prostate Cancer (mPC): Implications for personalized treatment stratification
FINAL PUBLICATION NUMBER FPN: 2227P
RESULTS - TARGETABLE PROFILES: 72% of evaluable pts (n=215) harbored a potentially targetable profile
RESULTS - CO-OCCURRENCE: 92%; 33%
[remaining poster text partly obscured by people; full poster transcribed in 2114385655375728819_s2]
Adjacent poster 2228P: A phase 1 study of SHR-4394, a PSMA-targe[ted ...] [illegible]
[Slide 2]
Incidence and patterns of co-occurrence of targetable genomic alterations in metastatic Prostate Cancer (mPC): Implications for personalized treatment stratification
FINAL PUBLICATION NUMBER FPN: 2227P
Arduini D¹, Ciccarese C¹,², Occhipinti D², Belletto R², Neri A², Colasanti F², Di Maio L³, Dragonetti P³, Duranti S⁵, Nero C⁴, Giacò L⁷, Marino I⁵, Piermattei A⁵, Panfili A⁵, Rocco BCM⁸, Minucci A⁶, Tagliaferri L³, Gasbarrini A², Tortora G¹,², Iacovelli R¹,²
¹Medical Oncology, Fondazione Policlinico Universitario A. Gemelli IRCCS, Rome; ²Università Cattolica del Sacro Cuore, Rome; ³Diagnostic Imaging, Radiotherapy Oncology and Hematology, Gemelli IRCCS, Rome; ⁴Gynecologic Oncology Unit, Gemelli IRCCS and Catholic University, Rome; ⁵Scientific Directorate, Gemelli IRCCS, Rome; ⁶Molecular and Genomic Diagnostics, Genomics Core Facility, G-STeP, Gemelli IRCCS, Rome; ⁷Bioinformatics Research Core Facility, G-STeP, Gemelli IRCCS, Rome; ⁸Urology, Gemelli IRCCS, Rome, Italy
BACKGROUND
In mPC, genomic alterations (GenAlt) may act as predictive biomarkers for treatment selection. HRR gene alterations identify candidates for PARP inhibitors (PARPi); activation of the PI3K/AKT pathway may support AKT inhibitors (capivasertib). Two among TP53, RB1, PTEN alterations are associated with aggressive variant PC (AVPC) and the greatest benefit from chemotherapy. SPOP mutations may predict sensitivity to androgen receptor-targeting agents, whereas the role of TMPRSS2-ERG remains controversial.
Aim: to challenge the single-driver paradigm in mPC by defining co-occurring molecular profiles to guide treatment strategies in the precision-medicine era.
METHODS
342 mPC pts enrolled in the FPG500 program (NCT06020625)
127 (37.1%) excluded: insufficient / damaged biopsy
215 pts with evaluable CGP (TSO500 HT assay)
Pts were stratified into potentially therapeutic profiles:
PARPi - ≥1 HRR gene alteration
AVPC - ≥2 alterations among PTEN, TP53, RB1
AKT-inhibitor - PTEN and/or PIK3CA alterations
Hormone-sensitive - SPOP
TMPRSS2-ERG - TMPRSS2-ERG fusion
RESULTS - TARGETABLE PROFILES
72% of evaluable pts (n=215) harbored a potentially targetable profile
Prevalence of each profile (% of evaluable pts)
TMPRSS2-ERG | 26%
AKT-inhibitor | 22.8%
PARPi | 20%
SPOP | 11.6%
AVPC | 6%
TMPRSS2-ERG was the most frequent profile, followed by the AKT-inhibitor and PARPi profiles. AVPC was identified in 6% (n=13) of pts.
SPOP (11.6%) showed strict mutual exclusivity with TMPRSS2-ERG - two distinct, non-overlapping molecular groups.
RESULTS - CO-OCCURRENCE
Overlap of the AVPC profile (n=13) with other profiles
AKT-inhibitor | 92%
TMPRSS2-ERG | 54%
92% of AVPC pts also qualified for the AKT-inhibitor profile and 54% overlapped with the TMPRSS2-ERG profile.
33% overall co-occurrence among the other groups, mainly TP53 with PTEN or TMPRSS2
CONCLUSIONS
• Comprehensive genomic profiling identified clinically targetable alterations in the majority of mPC pts (72%).
• The high rate of genomic co-occurrence challenges the single-driver paradigm.
• Findings support the potential role of routine molecular profiling to optimize treatment selection in mPC.
Abbreviations: mPC, metastatic prostate cancer; CGP, comprehensive genomic profiling; HRR, homologous recombination repair; PARPi, PARP inhibitor; AVPC, aggressive variant prostate cancer.
DISCLOSURE (presenting author) "No conflicts of interest to declare"
FPG500 program, NCT06020625
CONTACT: daniela.arduini@guest.policlinicogemelli.it DanielaArduini3
Zach Klaassen@zklaassen_md
1) Trial design schema: PEACE-6 Oligo-PRESTO study schema: SOC + MDT vs SOC in omHSPC · 2) Slide: PEACE-6 Oligo-PRESTO baseline characteristics · 3) Trial design schema: PEACE-6 Oligo-PRESTO: acute AEs within 6 months by randomized arm · 4) Slide: PEACE-6 Oligo-PRESTO: Brief Pain Inventory scores in patients with bone pain at baseline
Ph 3 PEACE-6 Oligo-PRESTO RCT: Role of MDT in omHSPC - Early toxicity and efficacy data @urotoday #ESMO26 @YssfGhannam
📌n=282 SOC+MDT vs n=283 SOC
📌@ 6 mos: median PSA 0 vs 0 ng/dL
📌Gr 1 AEs: 33.0% vs 38.3%
📌Gr 2 AEs: 41.2% vs 44.7%
📌@ 6 mos: No diff in HRQoL https://t.co/nrlqhuxJ9w
[Slide 1]
omHSPC · 1–5 metastases · ≥1 bone lesion · ECOG 0–2 · all lesions amenable to ablative RT
565 RANDOMIZED 1:1 2020–2025
ARM A: SOC* + MDT, n = 282, SBRT to all oligometastatic lesions
ARM B: SOC*, n = 283, Standard-of-care treatment*
TREATED n=279 SBRT n=245 | TREATED n=282
STRATIFIED BY
METASTATIC BURDEN: 1–2 vs 3–5
SYSTEMIC INTENSIFICATION: None · docetaxel · NHA
DISEASE PRESENTATION: De novo vs recurrent
[Slide 2]
| Characteristic | Overall N=565 | Arm A (SOC+MDT) N=282 | Arm B (SOC) N=283 |
Age, years — median (IQR) | 71 (65–75) | 71 (65–75) | 72 (66–76)
ECOG performance status 0 | 486 (86.0%) | 241 (85.5%) | 245 (86.6%)
Number of metastases
1–2 | 421 (74.5%) | 211 (74.8%) | 210 (74.2%)
3–5 | 144 (25.5%) | 71 (25.2%) | 73 (25.8%)
Disease presentation
De novo | 289 (51.2%) | 145 (51.4%) | 144 (50.9%)
Recurrent | 276 (48.8%) | 137 (48.6%) | 139 (49.1%)
Metastatic sites
Bone | 558 (98.8%) | 279 (98.9%) | 279 (98.6%)
Lymph nodes | 209 (37.0%) | 104 (36.9%) | 105 (37.1%)
Staging imaging
Choline PET/CT | 354 (62.7%) | 178 (63.1%) | 176 (62.2%)
PSMA PET/CT | 211 (37.3%) | 104 (36.9%) | 107 (37.8%)
Additional systemic treatment
None | 85 (15.0%) | 42 (14.9%) | 43 (15.2%)
Docetaxel | 2 (0.4%) | 1 (0.4%) | 1 (0.4%)
New-generation hormonal therapy | 478 (84.6%) | 239 (84.8%) | 239 (84.5%)
Baseline PSA, ng/mL — median (IQR) | 6 (1–22) | 7 (2–22) | 6 (1–22)
[Slide 3]
Acute AEs within 6 months by randomized arm, n (%)
| Maximum grade | ARM A (SOC + MDT) n=279 | ARM B (SOC) n=282 |
Any acute AE | 253 (90.7) | 277 (98.2)
Grade 1 | 92 (33.0) | 108 (38.3)
Grade 2 | 115 (41.2) | 126 (44.7)
Grade 3 | 39 (14.0) | 37 (13.1)
Grade 4 | 3 (1.1) | 4 (1.4)
Grade 5 | 4 (1.4) | 2 (0.7)
[Slide 4]
Brief Pain Inventory Scores in patients with bone pain at baseline
[Left panel: Brief Pain interference score; BPI Score 0–10 by Study Visit; SOC + MDT (blue) vs SOC (red)]
Number of patients at visit (Baseline / Week 6 / Month 3 / Month 6)
SOC + MDT 90 / 84 / 87 / 101
SOC 93 / 73 / 80 / 88
[Right panel: Brief Pain severity score; BPI Score 0–10 by Study Visit; SOC + MDT (blue) vs SOC (red)]
Number of patients at visit (Baseline / Week 6 / Month 3 / Month 6)
SOC + MDT 93 / 83 / 89 / 100
SOC 94 / 75 / 79 / 84
Zach Klaassen@zklaassen_md
1) Trial design schema: ARACOG study design schema: randomized darolutamide vs enzalutamide · 2) Slide: ARACOG baseline characteristics table: darolutamide (N=38) vs enzalutamide (N=41), total N=79 · 3) Slide: Figure 4: Distribution of polygenic hazard score (PHS) among evaluable patients (N=79) · 4) Slide: Table 5: Change in FACT-Cog at 24 weeks - MCCD by PHS quartile, darolutamide vs enzalutamide
Genetic Dementia Risk and ARPI-associated Cognitive Effects in ARACOG (RCT Daro vs Enza) #ESMO26 @charlesryanmd @urotoday
📌No association of polygenic hazard score (PHS) to baseline CANTAB
📌Maximally changed cognitive domain on Enza >> than Daro across PHS risk quartiles: suggests mechanism of drug effect
📌Findings support a mechanism of ARPI-associated cognitive effects, independent of genetic risk of Alzheimer’s dementia
[Slide 1]
Week: 0 12 24 48
Patients with mCRPC nmCRPC or mHSPC N=111
RANDOMIZE
Darolutamide -> Meets crossover criteria (Y -> Enzalutamide; N -> Darolutamide) -> Meets crossover criteria (Y -> Enzalutamide; N -> Darolutamide)
Enzalutamide -> Meets crossover criteria (N -> Enzalutamide; Y -> Darolutamide) -> Meets crossover criteria (N -> Enzalutamide; Y -> Darolutamide)
Week 0: CANTAB modules, Blood (PHS, AR), PROMs, TUG
Week 12: CANTAB modules, PROMs, TUG
Week 24: CANTAB modules, PROMs, TUG
Week 48: CANTAB modules, PROMs, TUG
Stratification: Age (< 65, 65-80, > 80)
[Slide 2]
| Darolutamide (N=38) | Enzalutamide (N=41) | Total (N=79)
Age
Median (IQR) | 70.2 (66.4, 76.0) | 69.5 (66.4, 74.2) | 70.1 (66.4, 76.0)
Range | 58.9, 86.2 | 57.7, 84.5 | 57.7, 86.2
Age Category, n (%)
<65 | 8 (21.1%) | 9 (22.0%) | 17 (21.5%)
65-80 | 26 (68.4%) | 29 (70.7%) | 55 (69.6%)
>80 | 4 (10.5%) | 3 (7.3%) | 7 (8.9%)
Gender, n (%)
Male | 38 (100.0%) | 41 (100.0%) | 79 (100.0%)
Race, n (%)
American Indian or Alaska Native | 0 (0.0%) | 1 (2.4%) | 1 (1.3%)
Black or African American/African Heritage | 0 (0.0%) | 4 (9.8%) | 4 (5.1%)
White | 36 (94.7%) | 33 (80.5%) | 69 (87.3%)
Not reported | 1 (2.6%) | 3 (7.3%) | 4 (5.1%)
Unknown | 1 (2.6%) | 0 (0.0%) | 1 (1.3%)
Ethnicity, n (%)
Hispanic or Latino | 1 (2.6%) | 1 (2.4%) | 2 (2.5%)
Not Hispanic or Latino | 35 (92.1%) | 38 (92.7%) | 73 (92.4%)
Not reported | 1 (2.6%) | 2 (4.9%) | 3 (3.8%)
Unknown | 1 (2.6%) | 0 (0.0%) | 1 (1.3%)
Level of education, n (%)
Left formal education at age 17-18 | 10 (26.3%) | 5 (12.2%) | 15 (19.0%)
Undergraduate degree or equivalent | 18 (47.4%) | 30 (73.2%) | 48 (60.8%)
Master's degree or equivalent | 4 (10.5%) | 3 (7.3%) | 7 (8.9%)
PhD or equivalent | 2 (5.3%) | 1 (2.4%) | 3 (3.8%)
Missing | 4 (10.5%) | 2 (4.9%) | 6 (7.6%)
Known family history of dementia, n (%)
Yes | 4 (10.5%) | 5 (12.2%) | 9 (11.4%)
No | 34 (89.5%) | 36 (87.8%) | 70 (88.6%)
[Slide 3]
Figure 4: Distribution of PHS among Evaluable patients (N=79)
[Horizontal histogram of PHS (y-axis 'phs', bins -0.75 to 2.75 in 0.5 steps; x-axis count 0-30) with adjacent box plot]
[Slide 4]
Table 5. Change in FACT-Cog at 24 Weeks
MCCD at 24 Weeks by PHS Quartile
% Change from Baseline | Quartile 1 (N=9) | Quartile 2 (N=9) | Quartile 3 (N=7) | Quartile 4 (N=9) | Total (N=34)
MCCD | DAROLUTAMIDE
Median | -14.3 | -16.7 | -22.2 | -33.3 | -17.4
(IQR) | (-20.0, -5.3) | (-37.5, 0.0) | (-40.0, -7.1) | (-44.4, -12.4) | (-40.0, -5.3)
Range | -122.2, 5.4 | -92.3, 12.6 | -90.0, 7.0 | -240.0, 6.1 | -240.0, 12.6
MCCD | ENZALUTAMIDE
Median | -33.5 | -50 | -33.3 | -31.4 | -34.7
(IQR) | (-266.7, -24.9) | (-73.3, -25.0) | (-75.0, -10.5) | (-36.8, -9.4) | (-73.3, -16.7)
Range | -1000.0, -16.7 | -120.0, -0.2 | -500.0, 1.1 | -50.0, 0.0 | -1000.0, 1.1
Rahul Winayak@RWinayak
1) Slide: Slide: cell therapy as a selective way to deploy cytokines (tethered, secreted, antigen-induced) · 2) Response data: Slide: IL-15 armoring potentiates T cell therapies, GPC3 CAR tumour volume change · 3) Slide: Slide: Engineering cytokines and the T cells that receive them (summary points)
Incredible talk at #ESMO26 on reharnessing the historical success of interleukin therapy in RCC/melanoma through cytokine-armored T cell approaches.
🎯 Cytokine-armored CAR-T cells allow targeted delivery of cytokines and even T cell repurposing
@xrtcell https://t.co/wKNtl0rOc7
[Slide 2]
Cell therapy offers another selective way to deploy cytokines
• Cytokines shape therapeutic product during manufacturing (IL-2, IL-7, IL-15, IL-21)
• "Armored" cell therapy products extend cytokine support in vivo beyond cell infusion
1 Tethered
Retain cytokines at the cell surface
Membrane tether
Engineered T cell
Cytokine receptor
CELL-ASSOCIATED EXPOSURE
2 Constitutively secreted
Release cytokines from the cell product
Engineered T cell
Cytokine receptor
LOCAL CYTOKINE SOURCE
3 Antigen-induced
Couple production to antigen sensing
Target cell
Antigen
Cytokine gene induced
Engineered T cell
Cytokine receptor
CAR-NFAT / synNotch
ANTIGEN-LINKED EXPOSURE
[Slide 4]
Engineering cytokines—and the T cells that receive them
1. Engineering expands how cytokines can be delivered and controlled.
Exposure, cell selectivity, and potency are complementary design opportunities.
2. Cytokine-armored T cells show clinical promise—but how do we choose the right cytokine signal?
Synthetic receptors enable systematic testing of alternative cytokine programs and nominating candidates for translation.
3. Repurposing innate cytokine signals expands the possibilities for T-cell therapy..
IL-9R, GCSFR and IL-22R signaling support distinct functions and improved antitumor activity in preclinical models.
The opportunity is not only to control which cells receive cytokines—but to choose what those signals instruct therapeutic T cells to do.
@zklaassen_md @urotoday Zach - phenomenal #ESMO26 coverage (as always!)
Wanted to add to this list - RETAIN 3 opening at @FoxChaseCancer https://t.co/6cUDQtTHIZ
THE PATH FORWARD
RETAIN-3: Clinical and Molecular Response Guide De-escalation
Eligibility: cT2–T3 N0, predominant urothelial carcinoma, ECOG 0–1
TURBT
EV + P
x3 cycles
Restaging
Cystoscopy + biopsies
CT chest/abdomen
Pelvic MRI
Urine cytology
ctDNA, real time
seeT0 + ctDNA−
seeT0 + ctDNA+
No cCR
Active surveillance
Maintenance pembrolizumab q6 wk x7
ctDNA clearance
EV + P x3
then repeat ctDNA
Persistent ctDNA+
Definitive local therapy
Cystectomy or chemoradiation
Proposed: N=120; primary endpoint 2-year MFS. Clinical and molecular response guide local and systemic de-escalation.
EV, enfortumab vedotin; P, pembrolizumab. Slide adapted from P. Ghatalia, MD
Alexander Kutikov, MD, FACS
@uretericbud
Fox Chase Cancer Center Temple Health
The Urologic Institute
Kohji Takemura, MD@KohjiToncol
Slide: Poster 4505P: KIM-1 dynamics and baseline CXCR3+CD8+ T cells and ICI outcomes in mRCC (Takemura, JFCR)
Delighted to present our research at #ESMO26 in Madrid!
We explored the relationship between KIM-1 and peripheral T-cell subsets, particularly CXCR3⁺CD8⁺ T cells.
Hope our work contributes, even in a small way, to advancing GU oncology! https://t.co/yUiTKBgk0h
4505P
KIM-1 dynamics and baseline CXCR3+ CD8+ T cells are associated with outcomes of ICI-based therapy in metastatic renal cell carcinoma
Kohji Takemura, Hirotake Tsukamoto, Takanobu Motoshima, Shinichiro Watanabe, Shoichiro Kuroda, Masaya Baba, Yuki Sugiura, Kazushige Sakaguchi, Shinji Urakami, Yuji Miura
1) Department of Advanced Medical Development, Cancer Institute Hospital of JFCR. 2) Division of Clinical Immunology and Cancer Immunotherapy, Center for Cancer Immunotherapy and Immunobiology, Kyoto University. 3) Department of Urology, Saiseikai Kumamoto Hospital. 4) Department of Urology, Kumamoto University. 5) Multiomics platform, Center for Cancer Immunotherapy and Immunobiology, Kyoto University. 6) Department of Urology, Toranomon Hospital. 7) Department of Medical Oncology, Cancer Institute Hospital of JFCR.
Contact E-mail: kohji.takemura@jfcr.or.jp
Background
KIM-1 has emerged as a promising biomarker for RCC. Although current evidence from recent phase III trials supports the prognostic value of circulating KIM-1 in mRCC, the biological role of KIM-1 remains poorly understood.
We investigated the prognostic value of plasma KIM-1 in patients with metastatic RCC treated with immune-based therapies and explored its association with peripheral immune cell phenotypes.
Methods
[Schema: Patients with mRCC → Baseline plasma/PBMC (C1D1) → ICI-based therapy (ICI mono/dual or ICI-TKI) → On-treatment plasma/PBMC (C2D1) → Plasma KIM-1, T cell subsets in PBMC → PFS/OS]
Study design: Multicenter retrospective study in Japan
Participants: Patients who initiated ICI-based therapy for mRCC between October 2018 and July 2024
Treatment regimens: ICI mono/dual: Nivolumab / Ipilimumab + Nivolumab; ICI-TKI: ICI + tyrosine kinase inhibitor (TKI) combinations
Measurements: Plasma KIM-1 and T-cell subsets in peripheral blood mononuclear cells (PBMC) were evaluated by ELISA and flow cytometry, respectively. KIM-1 was measured at baseline and on-treatment (mainly at the second ICI dose).
Endpoints: Associations in plasma KIM-1 levels and T-cell subsets in PBMC of baseline and on-treatment samples with clinical outcomes were evaluated. Analyses were performed using available data.
Results
Table 1. Baseline characteristics (Total n=57)
Sex Male 47 (82.5%)
Age (median, range) 69 (28-90)
IMDC risk category: Favorable 14 (24.6%); Intermediate 31 (54.4%); Poor 11 (19.3%)
Histology: ccRCC 40 (70.2%); nccRCC 14 (24.6%)
Prior nephrectomy 42 (73.7%)
Treatment category: ICI mono/dual 36 (63.2%); - Ipilimumab + Nivolumab 25 (43.9%); - Nivolumab monotherapy 11 (19.3%); ICI-TKI 21 (36.8%)
Table 2. Association between baseline KIM-1 and T-cell subsets in PBMC (class / subset / n / Spearman ρ / P value)
CD8 CD3+CD8+ 54 −0.275 0.0440
CD3+CD8+CXCR3+ 54 −0.457 0.00051
CD3+CD8+ICOS+ 54 −0.363 0.00694
CD4 CD3+CD4+ 54 −0.397 0.00297
Th1; CD3+CD4+CXCR3+ 54 −0.350 0.00940
Th17; CD3+CD4+CCR6+CXCR3− 54 −0.295 0.0304
Tfh; CD3+CD4+CXCR5+ 54 −0.272 0.0467
CD4+CCR6+CCR4+ 39 −0.319 0.0476
CD3+CD4+ICOS+ 54 −0.377 0.00490
Only subsets with nominal p < 0.05 are shown. P values are unadjusted for multiple comparisons.
Figure 1. Association between KIM-1 dynamics (delta KIM-1), baseline CXCR3+CD8+ T cells and clinical outcomes. [KM panels: Delta KIM-1 / PFS (KIM-1 Decrease vs KIM-1 Increase, HR 1.82 [illegible CI] p=0.08); Delta KIM-1 / OS (HR 3.98 [illegible CI] p=0.005); Baseline CXCR3+CD8+ T cell / PFS; Baseline CXCR3+CD8+ T cell / OS (High vs Low)]
Figure 2. Association between KIM-1 dynamics and clinical outcomes stratified by baseline CXCR3+CD8+ T cells in PBMC. [KM panels PFS and OS; groups KIM-1 Decrease / CXCR3+CD8+ T cells High, KIM-1 Decrease / Low, KIM-1 Increase / High, KIM-1 Increase / Low; HR values illegible]
Discussion
✓ A decrease in circulating KIM-1 during ICI-based therapy was significantly associated with longer OS, whereas the association with PFS did not reach significance.
✓ Higher baseline KIM-1 levels correlated with lower proportions of several peripheral T-cell subsets. The strongest unadjusted correlation was observed for CXCR3+CD8+ T cells, suggesting an association between KIM-1 and peripheral immune composition.
✓ Combining KIM-1 dynamics with baseline CXCR3+CD8+ T-cell proportions may help stratify patients by prognosis. This exploratory finding requires validation, as formal interaction tests were not significant and incremental prognostic value was not established.
✓ The retrospective design, small sample size, multiple comparisons, and variation in on-treatment sampling times limit interpretation.
Take Home Message
1. Lower baseline KIM-1 levels are associated with higher frequencies of T-cell subsets implicated in antitumor immunity, particularly CXCR3+CD8+ T cells.
2. Combining KIM-1 dynamics with baseline CXCR3+CD8+ T cell status may improve prognostic stratification, warranting further validation.
[References and conflict of interest text small]
Elvina Almuradova@Dr_ElvinaA
1) Slide: KEYNOTE-564 final protocol-prespecified analysis title slide (Toni K. Choueiri) · 2) Kaplan-Meier survival data: KEYNOTE-564 final analysis: OS in ITT population
At 7 years of follow-up, no new safety signals emerged. Earlier analyses already marked a milestone: the first demonstrated OS benefit with adjuvant immunotherapy!
@Larvol @OncoAlert #ESMO26 https://t.co/mydtLk3KiB
[Slide 1]
Final Protocol-Prespecified Analysis of the Phase 3 KEYNOTE-564 Trial of Adjuvant Pembrolizumab Versus Placebo in Clear Cell Renal Cell Carcinoma
Toni K. Choueiri, Piotr Tomczak, Se Hoon Park, Balaji Venugopal, Thomas Ferguson, Naomi B. Haas, Yen-Hwa Chang, Stefan N. Symeonides, Jae Lyun Lee, Piotr Sawrycki, Naveed Sarwar, Mauricio Mahave, Howard Gurney, Marine Gross-Goupil, Gurjyot K. Doshi, John M. Burke, Rui Kang, Joseph E. Burgents, Priyanka Chablani, Thomas Powles
[affiliations: small print, partly illegible]
[Slide 2]
OS, ITT Population
Pembro: 96.3% | 93.9% | 91.2% | 87.7% | 85.9% | 82.3%
Placebo: 93.9% | 89.5% | 85.8% | 82.2% | 79.3% | 76.6%
| Pembro (N = 496) | Placebo (N = 498)
Events, n (%) | 86 (17.3) | 118 (23.7)
Median (95% CI), months | NR (NR-NR) | NR (NR-NR)
HR 0.70 (95% CI, 0.53-0.92)
Months
No. at risk
Pembro 496 489 485 479 472 468 460 452 445 440 428 422 417 383 227 131 49 1 0
Placebo 498 492 484 478 464 455 442 429 423 416 404 398 390 358 204 119 45 2 0
[...] end point was met at IA3 and was not formally statistically tested thereafter. Data cutoff date: February 4, 2026.
Survival table
Endpoint: Overall survival (ITT), final analysis
Arm | N | Median | Median CI
Pembro | 496 | NR | NR-NR
Placebo | 498 | NR | NR-NR
HR: 0.70
HR CI: 0.53-0.92
Landmark rates:
dashed-line landmarks 1-6 (timepoints not labeled on slide): Pembro 96.3% / 93.9% / 91.2% / 87.7% / 85.9% / 82.3%
same: Placebo 93.9% / 89.5% / 85.8% / 82.2% / 79.3% / 76.6%
Alan Tan@alantanmd
1) Slide: PROMPT (Niven Mehra): Concordance is high for HRR - PI3K/AKT biallelic loss is the outlier · 2) Kaplan-Meier survival data: PROMPT (Niven Mehra): Only plasma-detected PTEN loss appears prognostic · 3) Slide: Conclusions and take-home message - plasma vs tissue genotyping in prostate cancer
Can plasma replace tissue for genotyping in mCRPC? Niven Mehra presented PROMPT at #ESMO26 🧬 In 301 matched tissue/plasma pairs, plasma alone found 82% of BRCA/HRR-altered patients and added 4 that tissue missed, so plasma-first with reflex to tissue at low tumor fraction is defensible for PARPi eligibility. PI3K/AKT is different: only 38% were caught, mostly from missed PTEN loss. But PTEN loss seen in plasma was prognostic (HR 2.11 adjusted for ctDNA fraction), while tissue-only loss was not. Report a low-TF plasma result as not informative, not negative. #ctDNA #LiquidBiopsy #ProstateCancer
[Slide 1]
Concordance is high for HRR — PI3K/AKT biallelic loss is the outlier
| SNV / indel | Biallelic loss
BRCA1/2 | PPV 82%; PPA 93% (14/15) · 95% CI 70–99% | PPV 100%; PPA 50% (3/6) · 95% CI 19–81%
HRR (non-BRCA) | PPV 97%; PPA 81% (29/36) · 95% CI 65–90% | n/a; n = 1 — not evaluable
PI3K / AKT | PPV 65%; PPA 57% (13/23) · 95% CI 37–74% | PPV 50%; PPA 14% (8/58) · 95% CI 7–25%
Accuracy fails predominantly for detection of copy-number loss in PI3K/AKT — PTEN-dominated
Tissue as comparator, n = 301. PPA = positive percent agreement (plasma-positive among tissue-positive), Wilson 95% CI; PPV = positive predictive value (tissue-positive among plasma-positive). Tissue is a comparator.
Updated after re-review of 10 PTEN homozygous-deletion calls since abstract submission; patients carrying both a BRCA and a non-BRCA HRR alteration (n = 3) are assigned to the BRCA row.
Niven Mehra
[Slide 3]
Not all discordance is technical — and only plasma-detected PTEN loss appears prognostic
Legend: Neither n=136, mOS 32 mo; Tissue-only n=58, mOS 29 mo; ctDNA-only n=23, mOS 11 mo; Both n=28, mOS 17 mo
Overall survival; Months from first blood draw
No. at risk (0, 12, 24, 36, 48, 60):
Neither: 136, 121, 91, 59, 45, 19
Tissue-only: 58, 51, 36, 22, 16, 7
ctDNA-only: 23, 9, 3, 1, 0, 0
Both: 28, 21, 6, 4, 2, 1
Liquid NGS misses PTEN deletions, not PTEN mutations
Tukachinsky, Clin Cancer Res 2021 ·
Chaki, Breast Cancer Res 2025 ·
Spatial and temporal heterogeneity of PI3K (PTEN loss)
Ferraldeschi, Eur Urol 2015 ·
Punnoose & Ferraldeschi, Br J Cancer 2015 ·
Warner, Nature Cancer 2024 ·
PTEN loss found only in tissue is not prognostic
58 of 245 patients are tissue-only, and their survival is comparable to wild-type — 29 vs 32 months, HR 1.16 (0.81–1.66), p = 0.43.
When PTEN loss is visible in plasma, median survival is 11–17 months: HR 3.50, and 2.11 (1.38–3.24) after adjusting for ctDNA fraction.
Niven Mehra
Survival table
Endpoint: Overall survival from first blood draw, by PTEN-loss detection (mCRPC)
Neither | 136 | 32 mo
Tissue-only | 58 | 29 mo
ctDNA-only | 23 | 11 mo
Both | 28 | 17 mo
HR: 1.16 (tissue-only vs wild-type)
HR CI: 0.81–1.66
P: 0.43
[Slide 4]
Conclusions and take-home message
1 BRCA1/2 and HRR
Plasma is a credible standalone test for PARP-inhibitor eligibility when tumour fraction is adequate — 82% of all altered patients, and 100% of tissue-positive SNVs above 5% tumour fraction. As an adjunct it adds 7% over tissue alone.
2 PI3K / AKT
Neither compartment is a gold standard. PTEN loss is spatially heterogeneous and discordance runs in both directions — relevant if the capivasertib biomarker moves from IHC to NGS.
3 Reporting standard
A plasma result below the tumour-fraction threshold should be reported as not informative (not as negative).
Matched leukocyte DNA is essential not optional — 10 apparent HRR/PI3K findings were clonal haematopoiesis.
Proposed pathway for BRCA1/2 and HRR: plasma first at APMR -> reflex to tissue if tumour fraction is below threshold
Niven Mehra
Rashid K. Sayyid@RKSayyid
1) Mechanism of action: Mechanism of action of ABBV-969 (dual PSMA/STEAP1 ADC) · 2) Response data: ABBV-969 PSA waterfall by dose and biomarker (phase I, mCRPC) · 3) Slide: ABBV-969 CTC reduction and PSA50 in PSMA-negative mCRPC (per VISION criteria) · 4) Biomarker data: ABBV-969 ctDNA reduction and association of ≥95% C3D1 reduction with rPFS
Phase I biomarker analysis of ABBV-969, a dual PSMA/STEAP1 ADC, in heavily pretreated mCRPC (n=49)
🔹 PSA50: 67%; PSA90: 30% at doses ≥3 mg/kg; median PSA response duration 10.8 mo
🔹 PSMA & STEAP1 detected in all evaluable baseline biopsies; 66% of baseline CTCs co-expressed both targets
🔹 Rapid ctDNA decline with treatment; ≥95% reduction at C3D1 associated with longer rPFS (median NR vs 8.3 mo; HR 3.7)
🔹 78% converted from >5 to <5 CTCs by C2D1; 47% had complete CTC clearance by C3D1
🔹 Activity also seen in PSMA PET– pts: PSA50 in 2/2 pts (PR: 1/2)
🔑 Dual PSMA/STEAP1 targeting demonstrated deep PSA, molecular & imaging responses across heterogeneous tumors, supporting continued development of ABBV-969.
@urotoday #ESMO26
[Slide 1]
Mechanism of action of ABBV-969
Top1i
Dual binding: STEAP1 binding | PSMA binding
STEAP1 | COOH | NH2 | PSMA
Tumor cell -> Cell death
PSMA, prostate-specific membrane antigen; STEAP1, six-transmembrane epithelial antigen of the prostate 1; Top1i, topoisomerase 1 inhibitor.
[Slide 2]
ABBV-969 achieved deep, durable PSA responses in patients with prior taxane and radioligand therapy exposure, bone/soft-tissue lesions, and diverse deleterious genomic alterations
[Waterfall plot] Y-axis: PSA Change from Baseline (%), 30 to -100; dashed lines at -50, -70, -90
Annotation rows: PSMA IHC | STEAP1 IHC | AR Alteration | TP53 Alteration | RB1 Alteration | PTEN Alteration | BCOR
Dose: 1 mg/kg; 2 mg/kg; 3 mg/kg; 5 mg/kg; 8 mg/kg; 10 mg/kg; 12.5 mg/kg
PSMA IHC: [0,100); [100,200); [200,300]; NA
STEAP1 IHC: [0,100); [100,200); [200,300]; NA
AR: AR-Altered; AR-Non-Altered
TP53: TP53-Altered; TP53-Non-Altered
RB1: RB1-Altered; RB1-Non-Altered
PTEN: PTEN-Altered; PTEN-Non-Altered
BCOR: CR; PR; SD; NA
Data cutoff: April 2, 2026.
* Patients with measurable liver lesions.
AR, androgen receptor; BCOR, best confirmed overall response; CR, complete response; IHC, immunohistochemistry; NA, not available; PR, partial response; PSA, prostate-specific antigen; PSMA, prostate-specific membrane antigen; PTEN, phosphatase and tensin homolog; RB1, retinoblastoma 1; SD, stable disease; STEAP1, six-transmembrane epithelial antigen of the prostate 1; TP53, tumor protein p53.
[Slide 3]
ABBV-969 triggered rapid and deep CTC reduction
A. Abundant CTC shedding was observed at baseline
n = 34; Median: 5.44; y-axis: log2(Baseline Total CTC Count + 1); All Doses
Median (IQR) CTC at baseline: 43 (11, 120)
B. Rapid and deep CTC reduction
Kruskal–Wallis Test P-value <0.001
Week 1 (C1D1): n = 34, Median: 0 | Week 4 (C2D1): n = 20, Median: -89.97 | Week 7 (C3D1): n = 30, Median: -99.79; P<0.001
y-axis: Percentage Change in Total CTC; x-axis: Visit
CTC conversion rate:
• From ≥5 at baseline to <5 at C3D1: 78%
• 100% clearance at C3D1: 47%
C, cycle; CTC, circulating tumor cell; D, day; IQR, interquartile range.
PSA50 responses were observed in patients with PSMA-negative mAPMR prostate cancer (mCRPC) at baseline (per VISION criteria)(8)
| No PSA50 Response | PSA50 Response | Total | Percent Yes
PSMA Negative Per VISION | 0 | 2 | 2 | 100
PSMA Positive Per VISION | 9 | 18 | 27 | 67
mAPMR, metastatic androgen pathway modulation resistant; PSA50, ≥50% decline in prostate specific antigen from baseline; PSMA, prostate-specific membrane antigen; mCRPC, metastatic castration resistant prostate cancer.
• Two of 29 patients with baseline PSMA PET from ≥3 mg/kg doses were PSMA PET negative per VISION study criteria at baseline
• Both achieved PSA50 with stable disease and confirmed partial response respectively per RECIST v1.1
[Slide 4]
ABBV-969 triggered deep and rapid ctDNA reduction; reduction at Cycle 3, Day 1 was associated with radiographic progression-free survival (rPFS)
A. Abundant ctDNA shedding was observed at baseline
n = 49; Median: 0.29; y-axis: Baseline ctDNA Fraction; All Doses
Median (IQR) baseline ctDNA fraction: 0.29 (0.05, 0.61)
B. ABBV-969 triggered rapid and deep ctDNA reduction
Kruskal-Wallis Test P-value <0.001
Week 1 (C1D1): n = 49, Median: 0 | Week 4 (C2D1): n = 19, Median: -88.56 | Week 7 (C3D1): n = 45, Median: -95.82
y-axis: ctDNA Percentage Change; x-axis: Visit
ctDNA reduction rate at C3D1 (n=113 [small text; as rendered]):
• ≥50%: 82%
• ≥95%: 58%
C. Deep ctDNA reduction at C3D1 was associated with radiographic PFS
Legend: ≥95% Reduction; <95% Reduction
y-axis: Survival Probability; x-axis: Time (Months) 0, 5, 10, 15, 20
Number at risk:
≥95% Reduction: 23, 22, 11, 6, 0
<95% Reduction: 19, 9, 3, 2, 0
rPFS | Overall (n=42) | <95% reduction (n=19) | ≥95% reduction (n=23)
Median rPFS, months | 11.9 | 8.3 | NR
HR (95% CI): 3.7 (1.38–9.93); log-rank P-value: 0.0055
Survival table
Endpoint: rPFS by ctDNA reduction at C3D1
Overall | 42 | 11.9 months
<95% reduction | 19 | 8.3 months
≥95% reduction | 23 | NR
HR: 3.7
HR CI: 1.38–9.93
P: 0.0055 (log-rank)
Bartek Tomasik@B_Tomasik
Slide: RAPSTAR trial-in-progress poster (3638TiP): RAPN vs SABR in localized RCC
Great start to #ESMO2026 in Madrid!
Just presented #RAPSTAR, our randomized phase III trial comparing #SABR with robotic partial nephrectomy (#RAPN) in localized renal cell carcinoma. Even better to do it alongside Krzysztof Konopa - a true SABR grandmaster I keep learning from! https://t.co/TUGuA0bw1f
RENAL CANCER 3638TiP
FPN: 3638TiP
RAPSTAR: randomized phase III trial comparing robotic-assisted partial nephrectomy (RAPN) versus stereotactic ablative radiotherapy (SABR) in localized renal cell carcinoma
Bartłomiej Tomasik¹, Michał Czarnogórski², Krzysztof Konopa¹, Jan Adamowicz², Paweł Teterycz³,⁴, Krzysztof Koper⁵, Rafał Dziadziuszko¹, Tomasz Drewa²
¹Department of Oncology and Radiotherapy, Faculty of Medicine, Medical University of Gdańsk, Gdańsk, Poland; ²Department and Chair of Urology and Andrology, Ludwik Rydygier Collegium Medicum, Nicolaus Copernicus University, Bydgoszcz, Poland; ³Digital Medicine Center, Maria Sklodowska-Curie National Research Institute of Oncology, Warsaw, Poland; ⁴Department of Soft Tissue/Bone Sarcoma and Melanoma, Maria Sklodowska-Curie National Research Institute of Oncology, Warsaw, Poland; ⁵Department of Oncology, Ludwik Rydygier's Collegium Medicum in Bydgoszcz, Nicolaus Copernicus University in Toruń, Poland.
[Logos: Medical University of Gdańsk; Nicolaus Copernicus University in Toruń; Medical Research Agency]
INTRODUCTION
Partial nephrectomy, performed as robotic-assisted partial nephrectomy (RAPN), is the standard treatment for localized renal cell carcinoma (RCC), providing excellent outcomes while preserving renal function (1).
The phase II FASTRACK II trial demonstrated promising local control and acceptable toxicity with stereotactic ablative radiotherapy (SABR) (2). However, randomized evidence comparing SABR with surgery in operable patients is lacking.
The RAPSTAR trial aims to address this evidence gap by comparing RAPN with SABR, with a primary focus on renal function preservation. Beyond renal function, the trial will also assess oncological outcomes, treatment-related toxicity, quality of life, and cost-effectiveness.
METHODS
RAPSTAR is a multicenter, randomized, open-label phase III trial comparing RAPN and SABR (1:1) in patients with localized RCC eligible for surgery and radiotherapy. A total of 164 patients (82 per arm) will be enrolled over 4 years, with post-treatment follow-up at 6, 12, 18, and 24 months.
The sample size was calculated using the approach described by Borm et al. (3), assuming a clinically relevant between-group difference of 5 mL/min/1.73 m² in eGFR, a standard deviation of 15 mL/min/1.73 m², R² ≥ 0.5, a two-sided α of 0.05, and 80% power. The calculated sample size of 142 evaluable patients was increased to 164 to account for potential attrition.
The primary analysis is planned in the intention-to-treat population, with a supportive per-protocol analysis.
Inclusion criteria:
• Age ≥18 years
• Biopsy-confirmed diagnosis of RCC with no more than one lesion in one kidney (bilateral RCC allowed)
• Stage I disease (tumour ≤7 cm in diameter)
• ECOG performance status ≤2
• Eligible for both surgery and radiotherapy
• Provision of written informed consent
• Multidisciplinary decision justifying the need for active local treatment
N = 164, 1:1 randomisation, stratification by: ✓ tumour size (T1a vs T1b) ✓ randomising centre
SABR: 26 Gy in 1 fraction for tumors <4 cm; 42 Gy in 3 fractions for tumors 4-7 cm
RAPN
Figure 1. RAPSTAR trial design.
ENDOPOINTS
Between-group difference in the change in estimated glomerular filtration rate (eGFR) from baseline to 24 months after treatment (mL/min/1.73 m²).
FREEDOM FROM LOCAL PROGRESSION · FREEDOM FROM DISTANT FAILURE · OVERALL SURVIVAL · PROGRESSION-FREE SURVIVAL · QUALITY OF LIFE · COST-EFFECTIVENESS
EXPLORATORY ANALYSES
1. Evaluation of multiparametric magnetic resonance imaging (mpMRI) as a predictor of treatment response.
2. Analysis of circulating tumour DNA (ctDNA) to identify genetic alterations, mutational profiles, and tumour-specific DNA fragments associated with treatment response and disease progression.
3. Evaluation of augmented reality (AR) technologies for improving intraoperative navigation.
4. Intraoperative tumour localization using indocyanine green (ICG) fluorescence imaging and/or robot-assisted intraoperative ultrasonography.
5. Validation and comparative assessment of the R.E.N.A.L., PADUA, and SPARE nephrometry scoring systems for predicting the anatomical complexity of partial nephrectomy.
FOLLOW-UP
Post-treatment follow-up: 6, 12, 18 and 24 months
Clinical assessment: physical examination, ECOG performance status.
Imaging: chest CT and abdominal/pelvic MRI.
Renal function: serum creatinine, eGFR, urinalysis; renal scintigraphy (EC/MAG3) at 12 and 24 months.
Quality of life: EORTC QLQ-C30.
Safety: adverse event and toxicity assessment.
Exploratory biomarkers: ctDNA sampling at 12 and 24 months.
Disease outcomes: progression, subsequent treatment and survival follow-up.
DISCLOSURE STATEMENT
Bartlomiej Tomasik declares no conflicts of interest. The RAPSTAR study is funded by the Polish government through the Medical Research Agency (2024/ABM/02/00045).
REFERENCES
(1) Bex A et al. "European association of urology guidelines on renal cell carcinoma: the 2025 update" European urology 87.6 (2025): 683-696.
(2) Siva S et al. "Long-term outcomes of stereotactic ablative body radiotherapy for primary kidney cancer (TROG 15.03 FASTRACK II): a multicentre, non-randomised, phase 2 study" The Lancet Oncology 27.6 (2026): 711-720.
(3) Borm GF, Fransen J, Lemmens WAJG. "A simple sample size formula for analysis of covariance in randomized clinical trials" Journal of clinical epidemiology 60.12 (2007): 1234-1238.
Contact: bartlomiej.tomasik@gumed.edu.pl
Zach Klaassen@zklaassen_md
1) Trial design schema: LIBERTAS study design (Figure 1) - apalutamide + intermittent vs continuous · 2) Slide: LIBERTAS Figure 2 - Daily life activity behavior in the ITP overall population by HF severity · 3) Slide: LIBERTAS Figure 5 - Patient-reported PHQ-9 fatigue and sleep disturbance in ITP by HF severity
Wearable derived Physical Activity and Patient Reported Fatigue and Sleep Differ by Hot Flash (HF) Severity During Initial Treatment Phase (ITP) in LIBERTAS @CaPsurvivorship @urotoday #ESMO26
📌Pts >> HF @ 6 mos were already more sedentary at BL, remained throughout ITP
📌⏫ HF severity: assoc w/ more fatigue and sleep disturbance
📌Value in continuous monitoring of physical activity with wearable digital health technologies
[Slide 1]
Figure 1: LIBERTAS Study Design
Baseline + ITP (6 mos)
Newly diagnosed mCSPC
• Metastasis detected by conventional imaging and/or next-generation imaging
• ECOG PS 0-1 (up to 2-3)a
APA 240 mg/d + ADT + Ametris CentrePoint Insight Watchb
Stratification
• Tumor volume
• Prior localized prostate cancer treatment
MTP (≥18 mos) + ≤24-mos follow-up
PSA undetectable <0.2 ng/mL -> R 1:1 -> Arm A: APA + Intermittent ADT / Arm B: APA + Continuous ADT
PSA detectable ≥0.2 ng/mL -> Continue SOC off study
Dual primary endpoints
• 18-mo radiographic PFS rate
• 18-mo % change in severity-adjusted HF score
[Slide 2]
Figure 2: Daily life activity behavior in the ITP overall population.
Low HF severity | High HF severity
Top panels - Y-axis: Mean ± SEM awake sedentary time (min/d); axis 430-470
Bottom panels - Y-axis: Mean ± SEM awake MVPA time (%); axis 9.0-12.5
X-axis timepoints: Baseline, C4D1, C7D1
[Line plots with error bars; no data values printed. Low HF severity sedentary time plotted below ~445 min/d; High HF severity plotted ~456-465 min/d. MVPA: low HF ~11-12%, high HF ~9.4-9.8% (read from plot, not printed).]
[Slide 3]
Figure 5: Patient-reported PHQ-9 fatigue (A) and sleep disturbance (B) in the ITP overall population.
A - Low HF severity: Baseline (n=145), C4D1 (n=142), C7D1 (n=141)
A - High HF severity: Baseline (n=148), C4D1 (n=136), C7D1 (n=138)
B - Low HF severity: Baseline (n=145), C4D1 (n=142), C7D1 (n=141)
B - High HF severity: Baseline (n=148), C4D1 (n=136), C7D1 (n=138)
Y-axis: % of patients
Categories: Not at all / Several days / More than half the days / Nearly every day
[Grouped bar charts; no bar values printed.]
[Footnote line at bottom cut off / illegible]
6/The CSS point estimate still leans toward cystectomy, and the interval is wide enough to drive a cystoscope through.
The OS estimate is 94% weighted on a single NCDB study. Every included study carried serious risk of confounding on ROBINS-I.
Recurrence after bladder sparing ran 33–75%.
LVI was more common in the RC groups, which tells you who got sent to surgery and that a cystectomy specimen finds what a TURBT misses.
A
Study or Subgroup | log[Hazard Ratio] | SE | Weight | Hazard Ratio IV, Random, 95% CI
Lonati 2022 | -0.32 | 0.54 | 36 % | 0.73 [0.25, 2.09]
Spaliviero 2014 | 0.05 | 0.86 | 17 % | 1.05 [0.19, 5.67]
Willis 2015 | 0.84 | 0.45 | 45 % | 2.32 [0.96, 5.60]
Total (95% CI) | | | 100 % | 1.32 [0.60, 2.88]
Heterogeneity: Tau² = 0.14; Chi² = 2.84, df = 2 (P = 0.2 ); I² = 30%
Test for overall effect: Z = 0.69 (P = 0. 5 )
Favors BP Favors RC
B
Study or Subgroup | log[Hazard Ratio] | SE | Weight | Hazard Ratio IV, Random, 95% CI
Dursun 2022 | -0.17 | 0.12 | 94 % | 0.84 [0.67, 1.07]
Lonati 2022 | -0.07 | 0.49 | 5 % | 0.93 [0.36, 2.44]
Total (95% CI) | | | 100 % | 0.85 [0.68, 1.07]
Heterogeneity: Tau² = 0.00; Chi² = 0.04, df = 1 (P = 0.8 ); I² = 0%
Test for overall effect: Z = 1.41 (P = 0.16)
Favors BP Favors RC
Rashid K. Sayyid@RKSayyid
Trial design schema: PEACE-6 Poor Responders trial-in-progress: study design
#ESMO26 TiP
PEACE-6 Poor Responders: Ph 3 trial of early 177Lu-PSMA-617 intensification in de novo mHSPC with poor PSA response to initial SOC (planned n=500)
💭 PSA ≥0.2 ng/mL at 6–8 mos despite SOC identifies a poor-prognosis group → rationale for response-adapted LuPSMA intensification
🔹 Randomized 1:1 • SOC vs SOC + 177Lu-PSMA-617 7.4 GBq q6w ×4
🔹 Key eligibility: de novo mHSPC • PSA ≥0.2 ng/mL at 6–8 mos • no progression • castrate testosterone
🔹 PSMA-PET required, but PSMA-negative pts remain eligible
🔹 Coprimary endpoints: rPFS & OS
🔹 Powered for HR 0.66 for rPFS & HR 0.73 for OS
🔹 79 pts randomized across 19 centers to date
@urotoday
Figure 1: Study design
6 to 8 months after standard of care initiation | 28 days max after informed consent form | Treatment phase (until CRPC stage)
Pre-screening: Standard of care initiation
Screening phase:
- De novo metastatic disease at initial diagnosis
- Serum PSA ≥ 0,2 ng/ml at 6-8 mo after standard of care initiation
- Stable or declining PSA but not a rising one
- Testosterone level < 50ng/dl or <1,7 nmol/L
R1:1
Arm A: Standard of care
Arm B: Standard of care + ¹⁷⁷Lu-PSMA-617 -> Arm B: Standard of care
4 cycles of ¹⁷⁷Lu-PSMA-617 (every 6 weeks)
Follow-up phase: Up to 10 years after randomization
Alan Tan@alantanmd
Safety data: CATALINA-1 TEAEs and TRAEs Experienced by >=20% of Patients (Ixo-V, GCT)
First-in-class CLDN6 ADC ixotatug vedotin (Ixo-V) in heavily pretreated relapsed germ cell tumors, presented by Darren Feldman at #ESMO26 🎯 CLDN6 is almost universally expressed in GCT and barely present in healthy adult tissue. In 11 patients from the phase 1 CATALINA-1 study, ORR was 45.5%, DCR 72.7% and mPFS 5.8 months. 3 of 6 responders came after HDCT/ASCT, and one patient with testicular GCT is still responding at 47.4 months. Safety was manageable, with mostly low-grade AEs, reversible G4 neutropenia and no febrile neutropenia. A real option could be emerging for the 20–30% who relapse. #GermCellTumor #TesticularCancer #GUOnc
TEAEs and TRAEs Experienced by ≥20% of Patients
• Ten (90.9%) patients experienced a TEAE of any grade
• Seven (63.6%) patients experienced a G ≥3 TEAE
• Three patients experienced reversible G4 neutropenia
• No febrile neutropenia was observed
• Two patients with G1 neuropathy at baseline experienced G3 peripheral sensory neuropathy
• No G5 events were observed
[Butterfly bar chart: TEAE (left) | TRAE (right), Patients, % (0-60), by Grade 1-4]
AEs listed: Constipation; Arthralgia; Back pain; Nausea; Vomiting; Fatigue; Neutropenia; Peripheral neuropathy, NOS; Peripheral sensory neuropathy; Peripheral motor neuropathy; Alopecia; Cough; Decreased appetite; Insomnia
The safety profile of Ixo-V continues to be manageable, associated with predominately low-grade TEAEs, and consistent with prior reported experience.
G, grade; Ixo-V, ixotatug vedotin; NOS, not otherwise specified; TEAEs, treatment-emergent adverse events; TRAEs, treatment-related adverse events.
Yesterday: Could PAPMET 2 change practice in papillary RCC?
Today at #ESMO26:
📊 mPFS 25 vs 10 months (HR 0.46)
🎯 ORR 47% vs 19%
Cabo + atezo vs cabo.
Promising randomized data, but only 36 patients enrolled. No MET data. https://t.co/CEpVB2xlJA
First results of SWOG S2200, a randomized, phase II study comparing cabozantinib with or without atezolizumab in metastatic papillary renal cell carcinoma (mPRCC)
Abstr 3591 – PAPMET 2 trial
PLUS
- We deal with a randomised clinical trial in a rare cancer population
- SWOG organised trial – consortium
- ORR of 47% is promising and in line with other combi trials in this population
-At first sight no new safety signals
-Most pts were first line
MINUS
-Inclusion of a limited number of patients
-23pts, slow inclusion rate (200 patients) prematurely closed
-PFS is primary endpoint (OS, ORR, safety = secondary) but seems comparable with other combi trials in this setting, PR in 8/17 pts = 47%
-No MET information is provided, biomarkers ? (Sarcomatoid expression)
-2 grade 5 events are reported : 1 in each group : high !
Kenrick Ng@Kenrickng1
1) Slide: CCTG PR21 (177Lu-PSMA-617 vs docetaxel, mCRPC) QoL results: FACT-P Total Score and TOI mean change · 2) Slide: CCTG PR21 QoL results: GP5 item 'I am bothered by the side effects of treatment' - LuP vs Doc
Favourite study of #ESMO25: CCTG PR21, ¹⁷⁷Lu-PSMA-617 vs docetaxel in mCRPC
Similar efficacy, very different QoL (#ESMO26) @DKhalafMD: ✅ FACT-P stable on LuPSMA, declined on Doc ⚠️ Side-effect bother "quite a bit/very much": 15% vs 41%
Next: financial toxicity & post tx QoL https://t.co/bDqa5IYHMp
[Slide 1]
Results
Mean change over time
†Higher scores indicate better QOL
FACT-P Total Score†
* Indicates p<0.05
Trial Outcomes Index (TOI)†
[Two line charts: Mean change from baseline vs Weeks (6, 12, 18, 24, 30, 36); legend LuP / Doc; asterisks at weeks 24, 30, 36 (FACT-P) and weeks 24, 30 (TOI)]
Weeks
Mixed Model Assessment week x treatment arm interaction: p = 0.002
Weeks
Mixed Model Assessment week x treatment arm interaction: p < 0.001
Presenter: Dr. Daniel J. Khalaf
[Slide 2]
Results
GP5 item: 'I am bothered by the side effects of treatment'
GP5 Item – Side Effect Bother †
†Higher scores indicate worse side effect bother
[Line chart: Mean change from baseline vs Week (6, 12, 18, 24, 30, 36); legend LuP / Doc; asterisks at weeks 6, 12, 24, 30, 36]
Week
Mixed Model Assessment week x treatment arm interaction: p = 0.007
Worst Recorded GP5 'Side Effect Bother' Score
Legend: 0 | 1 to 2 | 3 to 4
LU-P: 28.6% | 56.0% | 15.4%
DOC: 9.9% | 49.5% | 40.7%
Kruskal-Wallis P < 0.001
% patients
Score 0: Not at all Score 1: A little bit Score 2: Somewhat
Score 3: Quite a bit Score 4: Very much
Presenter: Dr. Daniel J. Khalaf
Rashid K. Sayyid@RKSayyid
1) Slide: PROFIT real-world Ra-223 mCRPC study (Spain) - Table 1 baseline demographic, clinical · 2) Kaplan-Meier survival data: PROFIT real-world Ra-223 mCRPC study - Figure 3 OS by number · 3) Kaplan-Meier survival data: PROFIT real-world Ra-223 mCRPC study - Figure 3 OS by number · 4) Slide: PROFIT real-world Ra-223 mCRPC study - Figure 4 Sankey diagram of treatment-line sequences
#ESMO26: PROFIT real-world study of Ra-223 sequencing in mCRPC in Spain (n=224)
🔹 59% received Ra-223 within first 2 mPC lines; 41% in ≥3L
🔹 Earlier Ra-223 associated with longer OS: 12.4 vs 9.3 mo (p=0.024)
🔹 ≥5 injections strongly associated with longer OS: 14.1 vs 7.1 mo (p<0.001)
🔹 62.5% completed 5–6 injections
🔹 48.7% received subsequent mCRPC therapy; most commonly cabazitaxel or docetaxel
🔑 Earlier integration and treatment continuity with Ra-223 were associated with improved survival in routine practice.
@urotoday
#ESMO26 Can adding atezolizumab to cabozantinib improve outcomes in metastatic papillary RCC?
SWOG S2200 (PAPMET2) randomized cabo ± atezo; trial closed early for slow accrual (n=33 eligible).
Cabo + atezo vs cabo:
🔹 mPFS: 25 vs 10 mo
🔹 HR 0.46 (95% CI 0.22–0.97); p=0.043
🔹 ORR: 47% vs 19%
🔹 PD as best response: 0% vs 19%
🔹 Grade 3/4 AEs: 65% vs 75%
🔑 Despite the small sample size + early closure, these randomized data support IO/TKI combination therapy as an appropriate 1L approach for mPRCC.
Results from STELLAR-304, SAMETA + AXIPAP remain pending.
@urotoday
ESMO 20[26]
Genomic biomarkers of response to Extreme Bipolar Androgen Therapy (BAT) Alternating Darolutamide and Testosterone Cypionate in Patients with Metastatic Castration-Resistant Prostate Cancer (mCRPC) - ExBAT trial/LACOG 0620
Authors: Diogo Assed Bastos, MD, PhD; Daniel Girardi, MD; Andrey Soares, MD; Fernando Cotait Maluf, MD, PhD; Denis Leonardo Jardim, MD, PhD; Igor Morbeck, MD, MSc; Mariane Sousa Fontes, MD; Vinicius Carrera Souza, MD; Rafaela Gomes de Jesus, BSc, MSc; Pedro Isaacsson Velho, MD, PhD
Abstract No: [illegible] | Poster No: [illegible]
INTRODUCTION
- Sequencing androgen receptor-pathway inhibitors (ARPI) have limited activity in mCRPC.
- Bipolar androgen therapy (BAT), which cycles serum testosterone between supraphysiological and castrate levels, can resensitize prostate cancer to androgen receptor pathway inhibitors (ARPIs) in patients who previously progressed on them.
- After a course of BAT, enzalutamide rechallenge has yielded meaningful PSA and radiographic responses, with PSA50 rates above 50%. The mechanism is incompletely understood but plausibly reflects BAT's demonstrated ability to downregulate AR and reverse AR-V7 expression in circulating tumor cells.
- To report exploratory genomic biomarker analyses to identify predictors of response.
METHODS
[Figure 1 schema - small text largely illegible: Phase 2, single-arm, multicenter (9 institutions), open-label trial - N = 51 treated patients; Testosterone cypionate (BAT) / Darolutamide / Washout; Endpoints]
- Study Design: phase II, single-arm trial in mCRPC pts after progression to abiraterone (Figure 1).
- Population & Settings: Pts received testosterone cypionate 400 mg IM (day 1) followed by darolutamide 1200 mg/day (days 29-56) in 63-day cycles.
- Data Collection: ctDNA was collected at baseline and end of treatment and evaluated for evaluation by next-generation sequencing (NGS) of AR alterations, including amplification, and mutations as potential biomarkers of rPFS and OS.
- Study Registration: NCT04558866 (ClinicalTrials.gov).
RESULTS
rPFS by AR Amplification Status
- AR amplification was significantly associated with inferior rPFS (median 8.3 vs. 2.9 months; HR 0.39; p = 0.0284), compared to non-amplified status (Figure 2).
[KM] Median (95% CI) 8.3m (3.9-NE) [Non-Amplified]; Median (95% CI) 2.9m (1.8-NE) [Amplified]
P-value: 0.0284; HR: 0.39
AR | Events/Total | % 12m rPFS (95% CI) | HR (95% CI)
Amplified | 7/8 | 0.0 (NE-NE%) | Reference
Non-Amplified | 23/38 | 42.3 (26.2-67.6%) | 0.39 (0.16-0.94)
At Risk (Months 0,2,4,6,8,10,12,14): Amplified 8, 6, 2, 2, 2, 0; Non-Amplified 38, 30, 22, 18, 18, 16, 15, 0
Figure 2. Radiographic Progression-Free Survival* by AR amplification Status.
12m Overall Survival by AR Amplification Status
- Overall survival was significantly longer in patients with non-amplified AR compared to those with AR amplification (HR 0.19, 95% CI 0.07-0.55; p=0.001) (Figure 3).
[KM] 12m OS (95% CI) 88.9% (73.0-95.7%) [Non-amplified]; 12m OS (95% CI) 50% (15.2-77.5%) [Amplified]
P-value: 0.001; HR: 0.19
AR | Events/Total | Median (95% CI) | HR (95% CI)
Amplified | 6/8 | 11.6 (3.7-NE) | Reference
Non-Amplified | 9/38 | NR (21.6-NE) | 0.19 (0.07-0.55)
At Risk (Months 0-14): Amplified 8, 8, 7, 6, 6, 5, 3, 2; Non-amplified 38, 38, 37, 36, 34, 32, 31, 25
Figure 3. Overall Survival by AR Amplification Status.
Genomic Profile and Individual Clinical Outcomes
[Oncoprint heatmap + swimmer plot; gene labels and keys largely illegible]
Figure 4: Swimmer plot with available molecular somatic profiling results
[Footnotes on radiographic progression definitions and **Other gene list (e.g. SF3B1, CTNNB1, ARID2, SPOP, ZFHX3, APC, SRSF2, PIK3CA, SETD2, ACVR1, RAD50, FANCI, BARD1, AXIN2, PRKN, AKT1, FOXA1, MYC, GNAS, EPCAM, FANCA, RET, LRP1B, MGA, INPP4A, MSH6, NBN, RB1, STAG2, KDM6A, PMS1, RNF43, EPHA3, KEAP1, CBL, PALB2, BRAF, RPS6KB1, FOXL2, MEN1); DNMT3A, TET2, ASXL1 and PPM1D are recognized clonal hematopoiesis (CHIP)-associated genes ... PTEN alterations were not detected in this baseline ctDNA cohort. - partly illegible]
CONCLUSION
- Alternating bipolar androgen therapy and darolutamide (ExBAT) showed durable rPFS and a manageable safety profile, in men with mCRPC who progressed on abiraterone.
- Baseline AR amplification emerged as a potential biomarker of resistance to this strategy, identifying a subgroup with markedly worse rPFS and OS and warranting prospective validation as a tool for treatment selection. These findings support further evaluation of BAT-based ARPI sequencing, potentially guided by AR status, as an alternative to conventional therapy in this setting.
Survival table
Endpoint: rPFS by AR amplification status (Figure 2)
Arm | N | Median | Median CI
AR non-amplified | 38 | 8.3 mo | 3.9-NE
AR amplified | 8 | 2.9 mo | 1.8-NE
HR: 0.39 (non-amplified vs amplified reference)
HR CI: 0.16-0.94
P: 0.0284
Landmark rates:
12 mo rPFS: AR non-amplified 42.3% (CI 26.2-67.6%) | AR amplified 0.0% (CI NE-NE)
12 mo OS: AR non-amplified 88.9% (CI 73.0-95.7%) | AR amplified 50% (CI 15.2-77.5%)
Rashid K. Sayyid@RKSayyid
1) Trial design schema: COSMIC-313 design with serial plasma KIM-1 collection: C+N+I vs N+I · 2) Slide: COSMIC-313: higher baseline KIM-1 associated with IMDC poor risk, no prior nephrectomy · 3) Kaplan-Meier survival data: COSMIC-313 survival curves: PFS and OS by week-3 KIM-1 decrease · 4) Slide: COSMIC-313: random-forest model predicting week-3 KIM-1 decrease captured metabolic and immune
#ESMO26 Can plasma KIM-1 help identify who needs a TKI added to immunotherapy in advanced ccRCC?
🧬 Post-hoc COSMIC-313 analysis of KIM-1 dynamics:
🔹 Higher baseline KIM-1 → poor-risk disease, no prior nephrectomy + greater tumor burden
🔹 With nivo/ipi, >30% KIM-1 ↓ at week 3 predicted:
• Better PFS: HR 0.46
• Better OS: HR 0.55
• ORR: 59% vs 31%
🚨This association was NOT seen with cabo/nivo/ipi → suggesting distinct biology
🤖 A baseline RNA-seq ML model predicted KIM-1 non-decreasers. In these predicted IO-resistant patients, adding cabozantinib improved:
• PFS: HR 0.63
• ORR: 49% vs 34%
• DCR: 90% vs 71%
🔑 KIM-1 dynamics may help distinguish patients who do well with dual IO from those who may benefit from TKI escalation
@urotoday
[Slide 1]
COSMIC-313 Is a Randomized First-Line Trial in Advanced ccRCC Comparing C+N+I vs N+I With Serial Plasma KIM-1 Collection
Advanced RCC (N=855)
• No prior systemic therapy
• Clear cell component
• Intermediate or poor risk
• Measurable disease (RECIST v1.1)
• Karnofsky performance status ≥70%
R 1:1
• IMDC risk
• Region
Cabozantinib + Nivolumab + Ipilimumab (C+N+I)
Weeks 0–12: Cabozantinib 40 mg PO QD, Nivolumab 3 mg/kg Q3W, Ipilimumab 1 mg/kg Q3W
Weeks 13+: Cabozantinib 40 mg PO QD, Nivolumab 3 mg/kg Q3W
Placebo + Nivolumab + Ipilimumab (N+I)
Weeks 0–12: Placebo, Nivolumab 3 mg/kg Q3W, Ipilimumab 1 mg/kg Q3W
Weeks 13+: Placebo, Nivolumab 3 mg/kg Q3W
Weeks 0 3 6 9 13
n=703 n=635 n=583 n=533 n=495
KIM-1 test results (n)
C+N+I n=356 n=272 n=208 n=158 n=146
N+I n=347 n=295 n=253 n=203 n=139
Plasma samples, collected at baseline and post treatment, were profiled for KIM-1 levels using an enzyme-based electrochemiluminescence assay
[Slide 2]
Higher Baseline KIM-1 Levels Are Associated With IMDC Poor-Risk Disease, Absence of Prior Nephrectomy, and Greater Tumor Burden
IMDC Risk
Wilcoxon, P = 1e−10
KIM−1 (pg/mL)
Intermediate | Poor
Prior Nephrectomy
Wilcoxon, P < 2.2e−16
No | Yes
Radiographic Tumor Burden
R = 0.58, P < 2.5e−16
Week 1 KIM−1 (pg/mL)
Sum of diameters at week 1
[Slide 3]
Early KIM-1 Decrease Is Predictive of Clinical Outcome in IO Arm (N+I)
Key Finding:
• A >30% decrease at week 3 strongly predicts PFS, OS, and ORR (59% vs. 31%) with N+I
• Under triplet therapy, this threshold does not stratify outcomes, indicating distinct biology
Distribution by Arm
Density
Treatment C+N+I / N+I
30% Decrease
Percent Change from W1D1 to W4D4
Placebo + Nivolumab + Ipilimumab (N+I)
Cabozantinib + Nivolumab + Ipilimumab (C+N+I)
PFS
OS
N+I >30% Decrease (n=109)
N+I ≤30% Decrease (n=212)
C+N+I >30% Decrease (n=246)
C+N+I ≤30% Decrease (n=68)
Progression-free survival probability
Overall survival probability
Months
Survival table
Endpoint: PFS and OS by week-3 KIM-1 decrease (>30% vs ≤30%)
N+I >30% decrease | 109
N+I ≤30% decrease | 212
C+N+I >30% decrease | 246
C+N+I ≤30% decrease | 68
[Slide 4]
Machine Learning Model to Predict Week-3 KIM-1 Decrease Captured Metabolic Signatures in Addition to Immune-Inflamed Programs
Key Finding:
• AI/machine learning model trained on baseline N+I RNA-seq to predict N+I-mediated KIM-1 decrease
• The model captured metabolic signatures, which were enriched in non-decreasers, have been implicated in immunosuppressive tumors states, and may define settings in which VEGFR-targeted therapy provides incremental benefit
N+I
Placebo PO QD
+ nivolumab 3 mg/kg IV Q3W x 4
+ ipilimumab 1 mg/kg IV Q3W x 4
≤30% Decrease | >30% Decrease
DGE using N+I bulk RNA-seq
Train a random forest classifier to predict N+I-associated 30% KIM-1 decrease
Random Forest Classifier
Model Performance
Accuracy 88.6%
Sensitivity 81.9%
Specificity 100 %
Classify all patients into N+I-associated 30% KIM-1 decreaser
Predicted / Observed
[illegible] Patients | [illegible] Patients | 21 Patients | [illegible] Patients
C+N+I | N+I
No N+I-associated 30% KIM-1 decr. | N+I-associated 30% KIM-1 decr.
z-score
IMDC: Intermediate / Poor
PDL1 TPS: <1% / ≥1%
Original KIM-1 decrease: ≤30% Decrease / >30% Decrease
CD8+ Tem
pDC
Class-switched memory B-cells
ImmuneScore
MicroenvironmentScore
CD4+ memory T-cells
CD8+ T-cells
CD8+ Tcm
aDC
HALLMARK_INFLAMMATORY_RESPONSE
HALLMARK_IL6_JAK_STAT3_SIGNALING
HALLMARK_COMPLEMENT
HALLMARK_ALLOGRAFT_REJECTION
HALLMARK_INTERFERON_GAMMA_RESPONSE
Macrophages M1
Macrophages
Tregs
DC
HALLMARK_SPERMATOGENESIS
HALLMARK_BILE_ACID_METABOLISM
HALLMARK_ADIPOGENESIS
HALLMARK_FATTY_ACID_METABOLISM
HALLMARK_PEROXISOME
Immune Signatures
Metabolic Signatures
C, cabozantinib; decr, decrease; DGE, differential gene expression; I, ipilimumab; IMDC, International mRCC Database Consortium; KIM-1, kidney injury molecule-1; N, nivolumab; PDL1, programmed death-ligand 1; PO, by mouth; TPS, tumor proportion score; VEGFR, vascular endothelial growth factor receptor; QD, once daily; Q3W, every 3 weeks.
Rashid K. Sayyid@RKSayyid
1) Kaplan-Meier survival data: KEYNOTE-564 DFS curves by protocol-defined risk subgroup · 2) Kaplan-Meier survival data: KEYNOTE-564 OS curves by protocol-defined risk subgroup
#ESMO26 KEYNOTE-564: Final Survival Analysis (7-yr)
✅ Durable DFS benefit:
🔹 HR 0.68
🔹 84-mo DFS: 57.2% vs 44.6%
✅ OS benefit maintained:
🔹 HR 0.70
🔹 84-mo OS: 82.3% vs 76.6%
🔹 DFS benefit maintained across intermediate-high, high-risk, & M1 NED groups
🔹 No new safety signals with longer follow-up
🔑 With the longest follow-up reported for adjuvant immunotherapy in ccRCC, pembrolizumab continues to demonstrate durable DFS + OS benefit and remains a standard of care after nephrectomy in appropriately selected high-risk pts.
@urotoday @DrChoueiri
[Slide 2]
DFS by Protocol-Defined Risk Subgroup
Intermediate-high
HR 0.71 (95% CI, 0.58-0.87)
High
HR 0.54 (95% CI, 0.31-0.94)
M1 NED
HR 0.50 (95% CI, 0.26-0.96)
DFS, %
Months
Pembro
Placebo
No. at risk
Survival table
Endpoint: DFS by protocol-defined risk subgroup (exploratory)
Pembro, intermediate-high | 422
Placebo, intermediate-high | 433
Pembro, high | 40
Placebo, high | 37
Pembro, M1 NED | 29
Placebo, M1 NED | 28
HR: Intermediate-high 0.71; High 0.54; M1 NED 0.50
HR CI: 0.58-0.87; 0.31-0.94; 0.26-0.96
Intermediate-high 60/72/84 mo: pembro 63.5% / 62.1% / 59.8%; placebo 55.5% / 52.3% / 48.3% (as labelled)
High 60/72/84 mo: pembro 44.6% / 44.6% / 44.6%; placebo 29.1% / 26.2% / 19.4% (as labelled)
M1 NED 60/72/84 mo: pembro 48.9% / 36.2% / 36.2%; placebo 27.6% / 23.0% / 23.0% (as labelled)
[Slide 3]
OS by Protocol-Defined Risk Subgroup
Intermediate-high
HR 0.66 (95% CI, 0.48-0.91)
High
HR 0.92 (95% CI, 0.44-1.90)
M1 NED
HR 0.54 (95% CI, 0.19-1.53)
OS, %
Months
Pembro
Placebo
No. at risk
Survival table
Endpoint: OS by protocol-defined risk subgroup (exploratory)
Pembro, intermediate-high | 422
Placebo, intermediate-high | 433
Pembro, high | 40
Placebo, high | 37
Pembro, M1 NED | 29
Placebo, M1 NED | 28
HR: Intermediate-high 0.66; High 0.92; M1 NED 0.54
HR CI: 0.48-0.91; 0.44-1.90; 0.19-1.53
Intermediate-high 60/72/84 mo: pembro 89.2% / 87.5% / 84.7%; placebo 83.7% / 80.9% / 78.0% (as labelled)
High 60/72/84 mo: pembro 75.0% / 72.5% / 61.4%; placebo 73.0% / 70.3% / 67.6% (as labelled)
M1 NED 60/72/84 mo: pembro 86.1% / 82.5% / 78.1%; placebo 70.6% / 66.9% / 66.9% (as labelled)
Katy Beckermann@katy_beckermann
1) Slide: ChAImeleon multi-cancer project title slide: clinical impact of AI models in medical imaging · 2) Slide: ChAImeleon clinical validation pipeline workflow: AI model inputs, platform, 46 clinicians · 3) Slide: ChAImeleon performance: diagnosis time and accuracy with vs without AI support across five · 4) Response data: ChAImeleon performance sunburst charts: correct vs incorrect diagnoses
ChAImeleon tested AI support in imaging with 46 clinicians. Each read 20 cases in their assigned cancer, unaided, then with AI after a 30-day washout. Overall accuracy rose from 54.3% to 58.3%, and diagnosis time fell in all 5 cancers, p<0.001.
📈 Colon T stage 35.9% to 55.0%
📐 Prostate risk group barely moved, 75.1% to 75.3%, with model performance 0.73 on screen
⚠️ Discussant highlights human in the loop necessary and more studies or structures in the workflow to prevent incorrect information and flags on accuracy for the clinicians.
#ESMO26 #AIinMedicine #ClinicalAI #ProstateCancer
[Slide 1]
MADRID 2026 ESMO congress
Clinical impact of AI Models in Medical Imaging:
Evidence from the ChAImeleon Multi-Cancer Project
Gloria Ribas
23-27 October 2026
Gloria Ribas Despuig
The in-silico clinical validation CHAIMELEON platform: A standardized multi-center framework to validate the impact of human-AI interaction across five cancers
[Slide 2]
CLINICAL VALIDATION PIPELINE
WORKFLOW OF THE CLINICAL VALIDATION
DEVELOPED INPUTS FROM AI MODELS - CHAIMELEON PROJECT
OVERALL SURVIVAL
STAGE : TNM
LUNG COLON BREAST PROSTATE RECTUM
HIGH VS LOW RISK
HISTOLOGY SUBTYPES
INVASION: EVMI &/OR MFI
chAImeleon
DICOM IMAGES MMG MRI CT
STRUCTURED CLINICAL DATA
DEVELOPMENT OF THE PLATFORM FOR IN-SILICO CLINICAL VALIDATION
1 CLINICAL EVALUATION
2 AI TRUST ASSESSMENT
3 FINAL CHECK
GT: Ground Truth
CLINICIAN RECRUITMENT & PLATFORM TESTING
46 CLINICIANS RECRUITED
EACH CLINICIAN EVALUATED 20 UNIQUE CASES PER ASSIGNED CANCER TYPE
1 CLINICAL EVALUATION
30-DAY WASHOUT PERIOD
2 AI TRUST ASSESSMENT
3 FINAL CHECK
USER FEEDBACK
LIKERT QUESTIONNAIRE
EACH CLINICIAN EVALUATED THE SYSTEM USING A 5-POINT LIKERT SCALE ACROSS 4 DIMENSIONS:
PLATFORM USABILITY
TRUST IN AI
AI UTILITY
AI IMPACT ON WORKFLOW
[Slide 3]
PERFORMANCE
TIME DX - IMPROVEMENT WITH AI SUPPORT
Phase I — 2 months — Phase II
Diagnosis time
Lung p < 0.001 | Breast p < 0.001 | Prostate p < 0.001 | Colon p < 0.001 | Rectum p < 0.001 | Global p < 0.001
Diagnosis made by the clinician without AI assistance | Diagnosis made by the clinician with AI assistance
AI, Artificial Inteligence.
Accuracy (without AI | with AI)
Overall survival: Lung 40.0% | 51.2%
Histology types: Breast 43.3% | 44.3%
Risk group: Prostate 75.1% | 75.3%
TNM stages Size, node involment, metastasis: Colon (T) 35.9% | 55.0%; Colon (N) 36.8% | 40.5%; Colon (M) 80.5% | 94.1%; Colon (global) 17.7% | 23.6%
Invasion (IVEM or/and IMF) extramural vascular or/& fascia mesorrectal: Rectum (EVI) 61.3% | 66.7%; Rectum (MFI) 69.0% | 78.3%; Rectum (global) 56.3% | 64.3%
Overall: ChAImeleon 54.3% | 58.3%
COLON 14% | LUNG 22% | RECTUM 20% | PROSTATE 26% | BREAST 18%
Improved 55% | Unchanged 17% | Worsened 28%
Martin ZapataLaguado@zapatalaguadomd
1) Slide: POTOMAC papillary-only title slide, 4737RO (Maria De Santis) · 2) Slide: POTOMAC: baseline characteristics, papillary-only tumours
#ESMO26 | POTOMAC Durvalumab + BCG reduced recurrence/death risk by 44% in BCG-naïve high-risk NMIBC with papillary-onlytumors (HR 0.56; 95% CI 0.37–0.84). Fewerhigh-risk recurrences and cystectomies, with safety. @SCUColombia @achoHematoYOnco @myESMO @ASCO @oncodaily @OncoAlert https://t.co/mkGGHgW1PO
[Slide 1]
4737RO
Durvalumab (D) in Combination With BCG Induction and Maintenance (I+M) for BCG-Naïve, High-Risk Non-Muscle-Invasive Bladder Cancer (NMIBC): Early Recurrence and Cystectomy-Free Survival in Patients With Papillary Only Tumours From POTOMAC
Maria De Santis,1,2 Neal D. Shore,3 Joan Palou Redorta,4 Michał Krawczyński,5 Artur Seyitkuliev,6 Andrey Novikov,7 Félix Guerrero-Ramos,8 Minoru Kato,9 Lieven Goeman,10 Eva Hellmis,11 Thomas Powles,12 Kilian M. Gust,13 Robert Zielinski,14 Julien Deturmeny,15 Girish Kulkarni,16 Jarmo Hunting,17 Ana Quartilho,18 Suliman Boulos,18 Hiroyuki Nishiyama19
1Charité Universitätsmedizin, Berlin, Germany; 2Medical University of Vienna, Vienna, Austria; 3START Carolinas/Carolina Urologic Research Center, Myrtle Beach, SC, USA; 4Fundació Puigvert, Universitat Autònoma de Barcelona, Barcelona, Spain; 5Clinical Research Centre Sp., Poznan, Poland; 6St. Petersburg Hospital of the Russian Academy of Sciences, St. Petersburg, Russia; 7North-Western State Medical University, St. Petersburg, Russia; 8Hospital Universitario 12 de Octubre, Madrid, Spain; 9Osaka Metropolitan University, Osaka, Japan; 10University Hospitals Leuven, Leuven, Belgium; 11Urologicum-Duisburg, Duisburg, Germany; 12Barts Cancer Institute Biomedical Research Centre, Queen Mary University of London, London, UK; 13Medical University of Vienna, Vienna, Austria; 14Western Sydney University, Orange Hospital, NSW, Australia; 15Hôpital Européen, Marseille, France; 16Princess Margaret Cancer Centre, Toronto, ON, Canada; 17St. Antonius Hospital, Utrecht, The Netherlands; 18AstraZeneca, Cambridge, UK; 19University of Tsukuba, Ibaraki, Japan
[Slide 2]
POTOMAC: Baseline Characteristics for Patients With Papillary Only Tumoursa
Demographic and disease characteristics were generally well balanced between the arms
Characteristics | D+BCG (I+M) N=217 | BCG (I+M) N=220
[Values as printed, top to bottom; row labels appear vertically offset from values on the projected slide]
Median age, years (range) | 67 (24–86) | 67 (32–86)
Sex, n (%) Male | 170 (78) | 173 (79)
Region, n (%) Western Europe | 85 (39) | 74 (34)
ROW | 132 (61) | 146 (66)
Race, n (%) White | 178 (82) | 180 (82)
Asian | 33 (15) | 33 (15)
Other | 3 (1) | 5 (2)
Missing | 3 (1) | 2 (1)
ECOG PS, n (%) 0 | 186 (86) | 195 (89)
1 | 31 (14) | 25 (11)
Smoking, n (%) Current | 42 (19) | 41 (19)
Former | 102 (47) | 109 (50)
Never | 73 (34) | 70 (32)
Disease stage, n (%) T1 [red box] | 137 (63) | 145 (66)
Ta | 79 (36) | 75 (34)
Other | 1 (0.5) | 0
Higher-risk papillary disease,b n (%) Yes | 114 (53) | 120 (55)
aDefined as any grade T1 or Ta disease without CIS, that met the high-risk disease enrollment criteria. bDefined as T1G3/T1 high-grade or multiple and recurrent and large tumours (those with a diameter of ≥3 cm). Data cutoff 03 April 2025. BCG, Bacillus Calmette-Guérin; D, durvalumab; ECOG PS, Eastern Cooperative Oncology Group performance status; I, induction; M, maintenance; ROW, rest of world.
TALAPRO-2 CTC analysis of TALA + ENZA vs PBO + ENZA in mCRPC (n=599)
🔹 Baseline CTC <5 in 81.5%; CTC=0 in 65.3%
🔹 ≥5→<5 CTC conversion at any time: 90% vs 64%
🔹 Baseline CTC=0 associated with longer rPFS in both arms
TALA+ENZA: HR 0.53
PBO+ENZA: HR 0.42
🔹 CTC <5 similarly prognostic: HR 0.41 & 0.35
🔹 Week 9/17 CTC clearance showed favorable rPFS trends, but small n limited interpretation
🔑 Lower baseline CTC burden was strongly prognostic; CTC conversion was numerically more frequent with TALA + ENZA.
@urotoday #ESMO26
[Slide 1]
Table 1. Baseline CTC Counts (ITT Population)
| Talazoparib + Enzalutamide (n=300) | Placebo + Enzalutamide (n=299)
Patients with evaluable CTC count, n | 182 | 175
Baseline CTC count | |
Median (range), cells/7.5 mL | 0 (0–105) | 0 (0–1486)
Mean (SD), cells/7.5 mL | 3.4 (12.3) | 14.2 (113.7)
≥5 CTC/7.5 mL at baseline, n (%) | 30 (10.0) | 36 (12.0)
<5 CTC/7.5 mL at baseline, n (%) | 152 (50.7) | 139 (46.5)
=0 CTC/7.5 mL at baseline, n (%) | 121 (40.3) | 112 (37.5)
>0 CTC/7.5 mL at baseline, n (%) | 61 (20.3) | 63 (21.1)
Counts reported for patients who had a baseline CTC assessment and at least one post-baseline CTC assessment. The denominator for patients with CTC counts at baseline is the ITT population.
CTC=circulating tumor cell; ITT=intent-to-treat; SD=standard deviation.
[Slide 2]
Table 2. Post-Baseline CTC Conversion at Any Time (ITT Population)
| Talazoparib + Enzalutamide (n=300) | Placebo + Enzalutamide (n=299)
≥5 CTC/7.5 mL at baseline, n (%) | 30 (10.0) | 36 (12.0)
CTC conversion from ≥5 to <5, n | 27 | 23
CTC conversion* from ≥5 to <5, % (95% CI) | 90.0% (72.3–97.4) | 63.9% (46.2–78.7)
>0 CTC/7.5 mL at baseline, n (%) | 61 (20.3) | 63 (21.1)
CTC conversion from >0 to 0, n | 42 | 38
CTC conversion* from >0 to 0, % (95% CI) | 68.9% (55.6–79.8) | 60.3% (47.2–72.2)
<5 CTC/7.5 mL at baseline, n (%) | 152 (50.7) | 139 (46.5)
CTC increase from baseline <5 value at any time, n | 119 | 106
CTC increase* from baseline <5 value at any time, % (95% CI) | 78.3% (70.7–84.4) | 76.3% (68.2–82.9)
Counts reported for patients who had a baseline CTC assessment and at least one post-baseline CTC assessment. The denominator for patients with CTC counts at baseline is the ITT population.
*Conversion counts are from blood collection time points at Weeks 9, 17, and 25. The denominator for conversion/increase calculations is patients who have CTC counts at baseline under each category.
Two-sided 95% CI was calculated using the Wilson score interval with continuity correction.
CI=confidence interval; CTC=circulating tumor cell; ITT=intent-to-treat.
[Slide 3]
Figure 1. rPFS in CTC Evaluable Population by Treatment and A) CTC=0 and B) CTC <5 at Baseline
A.
| Events/n | Median rPFS (95% CI), mo
TALA + ENZA, CTC=0 | 25/121 | NR (NR–NR)
TALA + ENZA, CTC>0 | 20/61 | NR (34.3–NR)
PBO + ENZA, CTC=0 | 35/112 | NR (45.8–NR)
PBO + ENZA, CTC>0 | 36/63 | 22.7 (17.2–NR)
Unstratified
TALA + ENZA BL CTC=0 vs CTC >0
HR=0.53; 95% CI, 0.29–0.95; 2-sided p=0.03
PBO + ENZA BL CTC=0 vs CTC >0
HR=0.42; 95% CI, 0.26–0.68; 2-sided p<0.001
B.
| Events/n | Median rPFS (95% CI), mo
TALA + ENZA, CTC <5 | 33/152 | NR (NR–NR)
TALA + ENZA, CTC ≥5 | 12/30 | NR (18.4–NR)
PBO + ENZA, CTC <5 | 48/139 | NR (45.8–NR)
PBO + ENZA, CTC ≥5 | 23/36 | 18.4 (12.9–29.3)
Unstratified
TALA + ENZA BL CTC <5 vs CTC ≥5
HR=0.41; 95% CI, 0.21–0.80; 2-sided p=0.007
PBO + ENZA BL CTC <5 vs CTC ≥5
HR=0.35; 95% CI, 0.21–0.58; 2-sided p<0.001
rPFS, % (y-axis); rPFS, months (x-axis 0–52)
No. at risk [rows printed but too small to transcribe reliably]
rPFS based on investigator assessment. Unstratified hazard ratio based on Cox proportional hazards model. P-value from an unstratified log-rank test. Month 0 is the time of randomization.
BL=baseline; CI=confidence interval; CTC=circulating tumor cell; ENZA=enzalutamide; HR=hazard ratio; NR=not reached; PBO=placebo; rPFS=radiographic progression-free survival; TALA=talazoparib.
Survival table
Endpoint: rPFS (investigator-assessed), CTC-evaluable population, by baseline CTC
Arm | N | Median | Median CI
Panel A: TALA + ENZA, CTC=0 | 121 | NR | NR–NR
Panel A: TALA + ENZA, CTC>0 | 61 | NR | 34.3–NR
Panel A: PBO + ENZA, CTC=0 | 112 | NR | 45.8–NR
Panel A: PBO + ENZA, CTC>0 | 63 | 22.7 mo | 17.2–NR
Panel B: TALA + ENZA, CTC <5 | 152 | NR | NR–NR
Panel B: TALA + ENZA, CTC ≥5 | 30 | NR | 18.4–NR
Panel B: PBO + ENZA, CTC <5 | 139 | NR | 45.8–NR
Panel B: PBO + ENZA, CTC ≥5 | 36 | 18.4 mo | 12.9–29.3
HR: TALA+ENZA BL CTC=0 vs >0: 0.53; PBO+ENZA BL CTC=0 vs >0: 0.42; TALA+ENZA BL CTC<5 vs ≥5: 0.41; PBO+ENZA BL CTC<5 vs ≥5: 0.35
HR CI: 0.29–0.95; 0.26–0.68; 0.21–0.80; 0.21–0.58
P: p=0.03; p<0.001; p=0.007; p<0.001 (2-sided)
[Slide 4]
Figure 2. rPFS in CTC Evaluable Population by Treatment and A) CTC Conversion and B) CTC0 at Week 9
A.
| Events/n | Median rPFS (95% CI), mo
TALA + ENZA, CTC conversion | 10/22 | 32.0 (18.4–NR)
TALA + ENZA, no CTC conversion | 1/6 | NR (NR–NR)
PBO + ENZA, CTC conversion | 16/21 | 17.2 (6.5–26.5)
PBO + ENZA, no CTC conversion | 5/12 | NR (15.4–NR)
Unstratified
TALA + ENZA CTC conversion vs no CTC conversion
HR=2.81; 95% CI, 0.36–21.94; 2-sided p=0.30
PBO + ENZA CTC conversion vs no CTC conversion
HR=2.31; 95% CI, 0.84–6.35; 2-sided p=0.09
B.
| Events/n | Median rPFS (95% CI), mo
TALA + ENZA, CTC0 | 6/22 | NR (NR–NR)
TALA + ENZA, no CTC0 | 9/26 | NR (29.3–NR)
PBO + ENZA, CTC0 | 9/19 | NR (22.7–NR)
PBO + ENZA, no CTC0 | 12/24 | 29.5 (15.6–NR)
Unstratified
TALA + ENZA CTC0 vs no CTC0
HR=0.62; 95% CI, 0.22–1.75; 2-sided p=0.36
PBO + ENZA CTC0 vs no CTC0
HR=0.72; 95% CI, 0.30–1.73; 2-sided p=0.47
rPFS, % (y-axis); rPFS, months (x-axis 0–52)
No. at risk [rows printed but too small to transcribe reliably]
rPFS based on investigator assessment. Unstratified hazard ratio based on Cox proportional hazards model. P-value from an unstratified log-rank test. Month 0 is the time of randomization.
CI=confidence interval; CTC=circulating tumor cell; CTC0=CTC count reduction from >0 to 0 per 7.5 mL of blood; ENZA=enzalutamide; HR=hazard ratio; NR=not reached; PBO=placebo; rPFS=radiographic progression-free survival; TALA=talazoparib.
Survival table
Endpoint: rPFS (investigator-assessed), CTC-evaluable population, by Week 9 CTC conversion / CTC0
Arm | N | Median | Median CI
Panel A: TALA + ENZA, CTC conversion | 22 | 32.0 mo | 18.4–NR
Panel A: TALA + ENZA, no CTC conversion | 6 | NR | NR–NR
Panel A: PBO + ENZA, CTC conversion | 21 | 17.2 mo | 6.5–26.5
Panel A: PBO + ENZA, no CTC conversion | 12 | NR | 15.4–NR
Panel B: TALA + ENZA, CTC0 | 22 | NR | NR–NR
Panel B: TALA + ENZA, no CTC0 | 26 | NR | 29.3–NR
Panel B: PBO + ENZA, CTC0 | 19 | NR | 22.7–NR
Panel B: PBO + ENZA, no CTC0 | 24 | 29.5 mo | 15.6–NR
HR: TALA+ENZA conversion vs no: 2.81; PBO+ENZA conversion vs no: 2.31; TALA+ENZA CTC0 vs no CTC0: 0.62; PBO+ENZA CTC0 vs no CTC0: 0.72
HR CI: 0.36–21.94; 0.84–6.35; 0.22–1.75; 0.30–1.73
P: p=0.30; p=0.09; p=0.36; p=0.47 (2-sided)
Michael Hofman@DrMHofman
Slide: abstract 2238P: LuCAB phase I/II trial of cabazitaxel + 177Lu-PSMA-617 in mCRPC (Kostos et al.)
MADRID 2026 ESMO congress
2238P
A phase I/II trial of combined cabazitaxel and lutetium-177 PSMA-617 (LuPSMA) in patients (pts) with metastatic castration-resistant prostate cancer (mCRPC): Results of the LuCAB trial
L.K. Kostos1, J.P. Buteau2, M. Fahey3, G. Kong2, B. Tran1, P. Jackson2, L. Mcintyre4, M. Haskali5, B. Emmerson2, W. Harris1, L. MacFarlane2, J. Lewin1, D. Murphy6, L. Furic7, M. Crumbaker8, L. Emmett9, M. Hofman2, A.A. Azad1
1 Department of Medical Oncology, Peter MacCallum Cancer Center, Melbourne, Australia, 2 Department of Cancer Imaging, Peter MacCallum Cancer Center, Melbourne, Australia, 3 Department of Biostatistics And Clinical Trials (bact), Peter MacCallum Cancer Center, Melbourne, Australia, 4 Parkville Cancer Clinical Trials Unit, Peter MacCallum Cancer Center, Melbourne, Australia, 5 Department of Radiopharmacy, Peter MacCallum Cancer Center, Melbourne, Australia, 6 Department of Urology, Peter MacCallum Cancer Center, Melbourne, Australia, 7 Department of Research, Peter MacCallum Cancer Centre, Melbourne, Australia, 8 Department of Medical Oncology, St Vincent's Hospital Sydney, Darlinghurst, Australia9 Department of Theranostic and Nuclear Medicine, St Vincent's Hospital Sydney, Darlinghurst, Australia
Background
Cabazitaxel may improve LuPSMA efficacy by overcoming heterogeneous PSMA expression and enhancing radiation damage as a radiosensitiser.
Methods
We conducted a single-arm, investigator-initiated phase I/II trial at two centres. Eligible pts had progressive mCRPC, PSMA-PET positive disease (SUVmax ≥15) without discordance on FDG-PET, and prior treatment with docetaxel and an androgen receptor pathway inhibitor. LuPSMA (7.4 GBq) was administered IV 6-weekly (≤6 cycles), concurrently with cabazitaxel IV 3-weekly (≤12 doses), on days 2 and 23 of a 6-week cycle with G-CSF prophylaxis. Four dose levels of cabazitaxel (12.5mg/m2 -20mg/m2) were evaluated using a 3+3 design. The primary objective was to determine the maximum tolerated dose (MTD) and recommended phase II dose (RP2D). Key secondary endpoints included safety, ≥50% PSA response rate (PSA50-RR), PSA- and radiographic progression-free survival (PSA-PFS and rPFS), and overall survival (OS).
Results
Between 26 Jul 2022 and 13 Feb 2025, 35 eligible pts were enrolled. Median (IQR) age was 68.0 years (63.0 - 75.0), baseline PSA 50.2 ug/L (IQR 15.1 - 109.8), PSMA SUVmean 8.3 (6.5 - 10.2), PSMA volume 493.3 mL (119.0-874.7), and FDG volume 85.8 mL (30.0 - 246.9). 25 pts (71%) had de novo metastatic disease; 10 (29%) had M1c disease at baseline. No dose-limiting toxicities were observed. The MTD and RP2D was 20mg/m2 cabazitaxel 3-weekly with 7.4 GBq LuPSMA 6-weekly. 26 (74%) and 22 (63%) pts received all doses of LuPSMA and cabazitaxel, respectively. Clinically significant grade 3 treatment-related adverse events (TRAEs) occurred in 8 (24%) pts: neutropenia, anemia (both n=2), diarrhea, weight loss, urinary tract infection and fatigue (n=1 each). No febrile neutropenia, grade 4 or 5 TRAEs occurred. The efficacy analysis was conducted in pts treated at the MTD (n=26) with a median follow-up of 20.4 months. PSA50-RR was 73% (95% CI 54-86), the median PSA-PFS was 8.5 (95% CI 4.8-12.1), rPFS 10.9 (10.2-13.4) and OS 16.5 (13.4-21.8) months.
Conclusions
Combined LuPSMA and cabazitaxel was safe with encouraging anti-tumour activity in a heavily pre-treated cohort of mCRPC pts with unfavourable baseline characteristics.
Clinical trial identification
NCT05340374.
Andrea Necchi, MD, FASCO@AndreaNecchi
Slide: Nature Medicine article page: Neoadjuvant nivolumab with or without visugromab in MIBC - phase
nature medicine Search Log in
Content About Publish
articles > article
Download PDF
Article | Open access | Published: 24 October 2026
Neoadjuvant nivolumab with or without visugromab in muscle-invasive bladder cancer: the phase 2a GDFATHER-NEO trial
Andrea Necchi, Chiara Mercinelli, … Felix S. Lichtenegger + Show authors
Nature Medicine (2026) Cite this article
Save article
View saved research
Abstract
WUTSUP-02: Conclusions
• The perioperative Tislelizumab with neoadjuvant Disitamab Vedotin demonstrates a positive antitumor activity and a manageable safety profile in high risk, non-metastatic UTUC
• Higher HER2 expression may be associated with numerically greater response rates, but this exploratory finding requires further validation
Yige Bao yige.bao@scu.edu.cn
Katy Beckermann@katy_beckermann
1) Slide: COSMIC-313: baseline immune enrichment associated with early KIM-1 decrease on nivolumab + · 2) Response data: COSMIC-313: TKI addition in predicted N+I KIM-1 non-decreasers — PFS and ORR
Congrats @VincentWenxinXu Baseline tumor RNA-seq predicted who would (immune enrichment) and wouldn't get an early KIM-1 drop on nivo/ipi in COSMIC-313.
📈 Predicted non-decreasers N+I: PFS HR 0.63 with cabo vs 0.79 in all ITT
🧬 Non-decreasers looked immune-depleted, with fatty acid and bile acid signatures
⚠️ Post-hoc, look forward to future of prospective trial testing combination biomarker-guided escalation.
#ESMO26 #KidneyCancer #GUonc #AIinMedicine
Phase 2 Study 2870-002/SKB264-II-06 (NCT05642780)
Key Eligibility Criteria for UC Cohort
• Aged ≥18 y
• Histologically or cytologically confirmed locally advanced or metastatic urothelial carcinoma of the renal pelvis, ureter, bladder, or urethra(a)
• Not eligible for cisplatin-containing chemotherapy(b)
• No prior systemic therapy for advanced or unresectable urothelial carcinoma(c)
• Measurable lesion per RECIST v1.1
• ECOG PS 0 or 1
→ Sac-TMT 4 mg/kg or 5 mg/kg IV Q2W(d) + Pembrolizumab 400 mg IV Q6W; N = 40
Endpoints
Primary
• Safety, including AEs and AEs leading to treatment discontinuation
• ORR per RECIST v1.1 by investigator
Secondary
• DCR per RECIST v1.1 by investigator
• DOR per RECIST v1.1 by investigator
• PFS per RECIST v1.1 by investigator
• OS
[Footnotes a-d too blurry to transcribe reliably: concern mixed histology (urothelial component >50%, plasmacytoid <10%), cisplatin-ineligibility definitions (creatinine clearance <60 but >30 mL/min, grade ≥2 audiometric hearing loss, grade ≥2 peripheral neuropathy, or NYHA Class III heart failure), prior adjuvant/neoadjuvant therapy with recurrence >12 months permitted, and treatment duration (pembrolizumab up to 2 years) - [illegible detail]]
Rashid K. Sayyid@RKSayyid
Slide: REPRINT results: 13 patients enrolled, 4 excluded after central pathology review, 9 evaluable
#ESMO26 Can enfortumab vedotin + pembrolizumab have activity in rare aggressive renal tumors?
🇮🇹 First-stage results from REPRINT in collecting duct carcinoma (CDC) + renal medullary carcinoma (RMC).
🔹 13 enrolled → 9 evaluable after central pathology review
🔹 ORR: 22%
🔹 DCR: 55%
🔹 Median PFS: 5.2 mo
🔹 No grade 3–4 AEs
2/2 pts with SMARCB1-deficient RCCU-MP responded → ORR 100%, despite neg membranous NECTIN-4 expression.
No ORRs were seen in CDC (0/7), although 3/7 achieved SD.
🔑 The trial met its prespecified threshold to proceed to stage 2.
@urotoday
REPRINT Results
13 Patients Enrolled May 2025 – April 2026
4 Excluded Post-Review Central pathological review
9 Evaluable Patients Included in final analysis
Diagnostic Exclusion Rate (30.8%)
Centralized pathological review reallocated over 30% of initially suspected cases, underscoring the critical need for specific molecular markers.
Alan Tan@alantanmd
1) Kaplan-Meier survival data: Neoadjuvant toripalimab + TIP in locally advanced penile SCC - Efficacy · 2) Trial design schema: Neoadjuvant toripalimab + TIP penile SCC - Exploratory HPV stratification
Neoadjuvant toripalimab + TIP in locally advanced penile SCC at #ESMO26 👏 ORR 84% (21/25) and pCR 48% (12/25), against about 10% historically with TIP chemo alone. 1-yr EFS was 72% and 1-yr OS 88% at 21.4 months median follow-up. HPV+ tumors trended better, but that wasn't significant. Small study and early days, but very encouraging for a rare cancer that badly needs better options. Phase 3 next! #PenileCancer #GUOnc
[Slide 1]
Efficacy & Survival Outcomes
A [waterfall plot: Change from baseline (%); Best response CR / SD / PR / PD]
B [spider plot: Change from baseline (%) at Baseline, After Cycle 2, After Cycle 4; Clinical response CR / SD / PR / PD]
C [KM curve: Event-free survival (%) vs Time from enrolment (months)]
Events: 8 (32%)
Median EFS: Not reached
12-month EFS rate: 72.0 (95%CI 50.1-85.5)
24-month EFS rate: 67.8 (95%CI 45.7-82.4)
Number at risk (0/6/12/18/24 mo): 25, 22, 18, 12, 5
D [KM curve: Overall survival (%) vs Time from enrolment (months)]
Deaths: 3 (12%)
Median OS: Not reached
12/24-month OS rate: 88.0 (95%CI 67.3-96.0)
Number at risk (0/6/12/18/24 mo): 25, 23, 22, 16, 7
Best ORR: 84.0%
21/25 pts (2 CR, 19 PR)
vs 50% of historical TIP chemo
Pathological CR (pCR): 48.0%
12/25 pts vs 10% of historical TIP chemo
Median Follow-up: 21.4 mo
Median EFS/OS: Not reached
1-yr EFS rate: 72%
1-yr OS rate: 88%
Full analysis set (FAS): all enrolled patients receiving at least one dose of study treatment.
All efficacy, survival, and safety analyses were performed in the FAS.
Survival table
Endpoint: EFS and OS (single-arm), FAS
Toripalimab + TIP (EFS) | 25 | Not reached
Toripalimab + TIP (OS) | 25 | Not reached
Landmark rates:
12 mo: EFS 72.0% (CI 50.1-85.5)
24 mo: EFS 67.8% (CI 45.7-82.4)
12/24 mo: OS 88.0% (CI 67.3-96.0)
[Slide 2]
Exploratory Stratification & Conclusions
[KM curve: Event-free survival (%) vs Time from enrolment (months); HPV positive vs HPV Negative]
HR: 0.31 (95% CI,0.06–1.58)
Log-rank p=0.13
Number at risk (0/3/6/9/12/15/18/21/24 mo):
HPV negative (blue): 12, 11, 10, 8, 7, 7, 5, 3, 2
HPV positive (red): 12, 12, 12, 12, 11, 9, 7, 7, 3
[KM curve: Overall survival (%) vs Time from enrolment (months); HPV positive vs HPV Negative]
HR: 0.01 (95% CI,0–152.55)
Log-rank p=0.07
Number at risk (0/3/6/9/12/15/18/21/24 mo):
HPV negative (blue): 12, 12, 10, 9, 9, 9, 7, 5, 4
HPV positive (red): 12, 12, 12, 12, 12, 11, 9, 7, 3
HPV+ vs HPV-:
Trend toward favorable outcomes (not statistically significant)
• pCR rate: 66.7% vs 33.3%, p=0.22
• 1-yr OS rate: 100% vs 75%, p=0.070
• Neoadjuvant toripalimab + TIP demonstrates encouraging ORR/pCR and manageable safety in La-PSCC.
• Longer follow-up and phase III RCTs are required to validate these preliminary findings.
One patient did not undergo HPV genotyping and was excluded from these HPV-stratified analyses.
Survival table
Endpoint: EFS and OS by HPV status (exploratory)
HPV positive | 12
HPV negative | 12
HR: EFS 0.31; OS 0.01
HR CI: EFS 0.06-1.58; OS 0-152.55
P: EFS log-rank 0.13; OS log-rank 0.07
Landmark rates:
1 yr: HPV positive (OS) 100% | HPV negative (OS) 75%
Tomas Pokrivcak, MD, PhD@pokrivcak
1) Slide: STAMPEDE Decipher score predicts distant metastasis benefit of abiraterone in N0 · 2) Slide: STAMPEDE Decipher discussant summary (Nicholas van As, ESMO 2026)
Can Decipher guide treatment intensification in high-risk localised #ProstateCancer?
New #ESMO2026 STAMPEDE data suggest it may help identify who benefits most from adding abiraterone to ADT + RT (N0 interaction p=0.01). https://t.co/elk1jBqLhY
[Slide 1]
10:15 - 11:45 Proffered paper: Genitourinary tumours, prostate, penile and testis
CHAIRS: CHRISTOPHER J SWEENEY, URSULA VOGL
Decipher score is predictive of distant metastasis benefit of abiraterone in STAMPEDE node negative (N0) patients
STAMPEDE All: Treatment x Decipher Interaction for DM: p = 0.11
STAMPEDE N0: Treatment x Decipher Interaction for DM: p = 0.01
[Two plots: y-axis 10-year distant metastasis (%) 0/25/50; x-axis Decipher 0.25/0.50/0.75/1.00; curves RT + ADT (solid purple) and RT + ADT + Abi (dashed orange), with Decipher score distribution strip plots per arm]
Sarah Howlett
[Slide 2]
My summary: Important progress towards personalised treatment
Strong prognostic validation and an encouraging signal for treatment selection
PROGNOSTIC VALUE | Distant metastasis aHR 1.44 per 0.1 Decipher increse 95% CI 1.19-1.76; p < 0.001
REPRODUCED in RWD | Consistent associations in STAMPEDE and real-world cohorts
PREDICTIVE SIGNAL | N0 treatment × Decipher interaction for DM: p = 0.01
The data is provocative but needs further validation
Nicholas van As
Martin ZapataLaguado@zapatalaguadomd
Slide: GDFATHER-NEO title slide (Necchi, ESMO 2026 Rapid Oral GU)
#ESMO26 | GDFATHER-NEO Phase II trial (n=31) evaluating nivolumab ± visugromab (anti-GDF-15) in MIBC. Adding visugromab nearly quadrupled pCR and ORR, with no safety issue. Promising bladder-preservation. @SCUColombia @achoHematoYOnco @myESMO @ASCO @OncoAlert @oncodaily https://t.co/4ADxqDI4Le
Final pathological and radiological outcomes and initial EFS from a blinded, exploratory phase 2 trial of nivolumab with or without visugromab in MIBC (GDFATHER-NEO)
Andrea Necchi1,2, Chiara Mercinelli1,2, Brigida A. Maiorano1, Antonio Cigliola1,2, Roberto Iacovelli3,4, Chiara Ciccarese3,4, Chiara Ligato3,4, Patrizia Giannatempo5, Alessandro Rametta5, Paolo Gontero6,7, Francesco Soria6, Aasim Amin8, Lena Lemke8, Frank Hermann8, Ana Kamova8, Kathrin Klar8, Alexandra Auckenthaler8, Sujata Rao8, Eugen Leo8, Felix S. Lichtenegger8
1. Department of Medical Oncology, IRCCS San Raffaele Hospital, Comprehensive Cancer Center, Milan, Italy; 2. Vita-Salute San Raffaele University, Milan, Italy; 3. Department of Oncology, Fondazione Policlinico Universitario Agostino Gemelli, Rome, Italy; 4. Translational Medicine and Surgery, Università Cattolica del Sacro Cuore, Rome, Italy; 5. Department of Medical Oncology, Fondazione IRCCS Istituto Nazionale dei Tumori, Milan, Italy; 6. Division of Urology, Department of Surgical Sciences, San Giovanni Battista Hospital, Turin, Italy; 7. University of Turin, Turin, Italy; 8. CatalYm GmbH, Munich, Germany
Rapid Oral Session I, GU Kidney & Bladder, Saturday October 24, 10:15-11:45 CET
Shilpa Gupta@shilpaonc
Slide: Presenter at Poster 3656: EV-302 updated exploratory analysis of enfortumab vedotin plus pembrolizumab
Poster 3656
Enfortumab Vedotin Plus Pembrolizumab for Previously Untreated Locally Advanced or Metastatic Urothelial Carcinoma: Updated Exploratory Analysis of EV-302 in Older Patients and Those With Comorbidities
Srikala S. Sridhar, Michiel van der Heijden, Thomas Powles, Jens Bedke, Begona Perez Valderrama, Jean Hoffman-Censits, Christof Vulsteke, Gopakumar Iyer, Steffen Rausch, Evan Y. Yu, Ignacio Duran, Se Hoon Park, Jian-Ri Li, Eiji Kikuchi, Blanca H[illegible], Jasmine Lichfield, Xuesong Yu, Dana Wishengr[illegible]
Patients and Baseline Characteristics
• At data cutoff (October 6, 2025), median follow-up in the ITT population was 42.8 months (95% CI, 41.7-43.9)
• Select baseline characteristics are shown in Table 1
Table 1. Key Demographic and Baseline Disease Characteristics Across Analyzed Subgroups
Figure 2. OS in Subgroups of Interest
A. Age ≥75 years B. BMI ≥30 kg/m2 C. Diabetes D. GFR <60 mL/min
Table 2. Summary of TRAEs in Subgroups of Interest
Table 3. Treatment-Related AEs of Special Interest for EV
[remaining poster text illegible at this resolution]
Tomas Pokrivcak, MD, PhD@pokrivcak
Trial design schema: Neoadjuvant toripalimab + TIP in locally advanced penile SCC
Phase II data in locally advanced penile SCC at #ESMO26
Neoadjuvant toripalimab + TIP (n=25): • ORR 84% | pCR 48% • 1y EFS 72% | OS 88% • G3–4 AEs: 84% • HPV+ vs HPV−: pCR 67% vs 33% (NS)
Encouraging efficacy, substantial toxicity. Validation needed.
#PenileCancer https://t.co/jb3g5LJ6A5
Promising early data in refractory GCT at #ESMO26
CLDN6-targeted ADC ixotatug vedotin (TORL-1-23):
• ORR 45.5% (5/11)
• DCR 72.7%
• Responses even after HDCT/ASCT
Encouraging phase I data in a population with high unmet need. Further validation warranted.
#TesticularCancer https://t.co/EBV7WOl74H
[Left slide]
Response Rates in Patients with GCTa,b
[Waterfall plot] Y-axis: Best change from baseline, % [partially obscured]; X-axis: Patient ID: OC04 T01 T06 T04 T03 T07 T08 T02 T05 S07
Legend: 0.4 mg/kg; 1.1 mg/kg; 2.2 mg/kg; 2.4 mg/kg; 3.0 mg/kg; 4 mg/kg; Ovarian tumor; Mediastinal tumor; Received prior HDCT/ASCT; Tx ongoing
Parameterc | All dose levels (N=11)
BOR, n (%)
PR 5 (45.5)
SD 3 (27.3)
PD 2 (18.2)
NE 1 (9.1)
ORR, % 45.5; 95% CI (16.7-76.6)
DCR, % 72.7; 95% CI (39.0-94.0)
mPFS, months 5.8; 95% CI (1.4-13.8)
• Responses were observed at Ixo-V dose levels ranging from 1 mg/kg to 3.4 mg/kg, with a median follow-up of 13.8 months
• Three of 6 (50.0%) patients who received prior HDCT/ASCT had confirmed responses to Ixo-V
• One patient with testicular GCT has maintained a response for 47.4 months with treatment ongoing at time of data cutoff
Ixo-V monotherapy exhibits preliminary antitumor clinical activity at doses ≥1 mg/kg in heavily pretreated patients with recurrent GCT, including those with disease refractory to ASCT
BOR, best overall response; DCR, disease control rate; HDCT/ASCT, high-dose chemotherapy with autologous stem cell transplant; Ixo-V, ixotatug vedotin. aData cutoff was March [illegible, possibly 16], 2026. bPrimary sites for the 11 GCT patients include: testicular (n=9), ovarian (n=1) and mediastinal (n=1).
[Right slide]
Conclusions
• Ixo-V monotherapy demonstrates meaningful clinical activity in heavily pretreated patients with recurrent GCT, including patients with disease refractory to HDCT/ASCT
• Ixo-V has a manageable safety profile, characterized by predominantly low-grade TEAEs
• These phase 1 data support ongoing clinical investigation of Ixo-V in GCT that have progressed on or after platinum-based chemotherapy
GCT, germ cell tumors; HDCT/ASCT, high-dose chemotherapy with autologous stem cell transplant; TEAEs, treatment emergent adverse events
Ricardo Sánchez-E@tioriri
Slide: Neoantigen vaccine for kidney cancer - trial overview (David Braun, ESMO 2026)
Great presentación by Dr David Braun about vaccine development against RCC, the field presents a great opportunity for better treatments #ESMO2026 https://t.co/M4pkmkrbUw
A neoantigen vaccine for kidney cancer
Trial overview
Tumor procurement → Target selection → Personal vaccine manufacture → Vaccine administration
ccRCC Stage III-IV; No evidence of disease (NED) after surgery
WES, RNAseq → Neoantigen prediction (HLAthena) → Identification of up to 20 personal neoantigens
Braun et al, Nature, 2025.
Martin ZapataLaguado@zapatalaguadomd
1) Trial design schema: CCTG PR21 - Background and study schema (Daniel J. Khalaf) · 2) Slide: CCTG PR21 - Study population, questionnaire completion, baseline FACT-P (Khalaf) · 3) Slide: CCTG PR21 - MCID response analysis, FACT-P total and TOI (Khalaf) · 4) Slide: CCTG PR21 - Mean change over time, FACT-P total and TOI (Khalaf)
#ESMO26 | PR21 trial: ^177Lu-PSMA-617 showed better patient-reported quality of life than docetaxel in mCRPC, with less deterioration in FACT-P scores. @SCUColombia @achoHematoYOnco @myESMO @ASCO @OncoAlert @oncodaily https://t.co/APHsmuuD38
[Slide 1]
13:30 - 15:00 Rapid oral: Genitourinary tumours, prostate, penile and testis
CHAIRS: THOMAS HWANG, EDMOND KWAN, ALISON REID
Background PR21 trial
Study schema
Key Eligibility
- mCRPC post ARPI
- Chemotherapy naive
- Except prior Docetaxel for mHSCP allowed if >= 12 months prior
- PSMA-PET positive (uptake > liver)
- Excluded if < 50% of extra-osseous lesions or < 5 cm soft tissue lesion were PSMA negative
Randomize 1:1
177Lu-PSMA-617 7.4 GBq IV every 6 weeks x 6 cycles | Docetaxel 75 mg/m2 IV every 3 weeks up to 12 cycles
Baseline FACT-P; FACT-P every 6 weeks x 6; FACT-P every 12 weeks
Radiographic Progression 1 -> crossover: Docetaxel 75 mg/m2 IV every 3 weeks up to 12 cycles | 177Lu-PSMA-617 7.4 GBq IV every 6 weeks x 6 cycles; FACT-P; FACT-P every 6 weeks x 6
Radiographic Progression 2
Primary Endpoint: rPFS 1
Additional Endpoints: rFPS 2, OS, Quality of Life*
*Trials Outcomes Index (TOI) was a pre-specified Quality of Life outcome of interest.
rPFS1(1) [small KM inset: 177Lu-PSMA-617 vs Docetaxel; Time in Months]
HR 1.01 (90% CI 0.77-1.31)
1-sided p = 0.51
Presenter: Dr. Daniel J. Khalaf
(1)Kim N. Chi et al, ESMO Congress 2025
[Speaker video inset] Daniel Khalaf
Patient reported quality of life (QoL) for docetaxel (Doc) vs lutetium177-617-PSMA (LuP) for metastatic castration-resistant prostate cancer (mCRPC): Results from the Canadian cancer trials group (CCTG) PR21 trial
BILBAO AUDITORIUM - HALL 3
[Slide 2]
13:30 - 15:00 Rapid oral: Genitourinary tumours, prostate, penile and testis
CHAIRS: THOMAS HWANG, EDMOND KWAN, ALISON REID
Results
Study Population and Questionnaire Completion rates
Randomized, N=199
n=100 -> 177Lutetium-PSMA-617 Received Protocol therapy: n = 94
n=99 -> Docetaxel Received protocol therapy: n = 95
Baseline questionnaires: LuP Baseline 91 received / 94 expected (96.8%); Docetaxel 91 received / 95 expected (95.8%)
On-treatment questionnaire completion rates:
LuP: Week 6 79.3%; Week 12 81.0%; Week 18 84.3%; Week 24 80.6%; Week 30 74.1%; Week 36 61.2%
Docetaxel: Week 6 89.2%; Week 12 86.0%; Week 18 70.1%; Week 24 75.8%; Week 30 59.0%; Week 36 32.8%
Mean baseline FACT-P Scores [bar chart, Lu-P vs Doce; categories Total, TOI, FACT-G, PWB, FWB, PCS, EWB, SWB; numerical score axis 0-120; bar values not printed]
Presenter: Dr. Daniel J. Khalaf
[Speaker video inset] Daniel Khalaf
Patient reported quality of life (QoL) for docetaxel (Doc) vs lutetium177-617-PSMA (LuP) for metastatic castration-resistant prostate cancer (mCRPC): Results from the Canadian cancer trials group (CCTG) PR21 trial
BILBAO AUDITORIUM - HALL 3
[Slide 3]
13:30 - 15:00 Rapid oral: Genitourinary tumours, prostate, penile and testis
CHAIRS: THOMAS HWANG, EDMOND KWAN, ALISON REID
Results
MCID* Response analysis
FACT-P Total Score (Improved % / Stable % / Worse % / Missing %)
Week 12: LU-P 28 / 30 / 28 / 14; DOCE 22 / 36 / 31 / 10
Week 24: LU-P 29 / 34 / 18 / 19; DOCE 15 / 27 / 32 / 26
Trials Outcomes Index (TOI) (Improved % / Stable % / Worse % / Missing %)
Week 12: LU-P 16 / 51 / 21 / 12; DOCE 12 / 50 / 29 / 9
Week 24: LU-P 13 / 58 / 10 / 19; DOCE 6 / 42 / 26 / 26
% patients
Improved indicates increase from baseline by >= the MCID*
Worse indicates decrease from baseline by >= the MCID
MCID for Total FACT-P : 9 points
MCID for TOI: 7 points
*MCID: Minimal Clinically Important Difference
Presenter: Dr. Daniel J. Khalaf
[Speaker video inset] Daniel Khalaf
Patient reported quality of life (QoL) for docetaxel (Doc) vs lutetium177-617-PSMA (LuP) for metastatic castration-resistant prostate cancer (mCRPC): Results from the Canadian cancer trials group (CCTG) PR21 trial
BILBAO AUDITORIUM - HALL 3
[Slide 4]
13:30 - 15:00 Rapid oral: Genitourinary tumours, prostate, penile and testis
CHAIRS: THOMAS HWANG, EDMOND KWAN, ALISON REID
Results
Mean change over time
FACT-P Total Score(T) [line chart, LuP vs Doc, mean change from baseline, weeks 6-36; * at weeks 24, 30, 36]
* Indicates p<0.05
Mixed Model Assessment week x treatment arm interaction: p = 0.002
Trial Outcomes Index (TOI)(T) [line chart, LuP vs Doc, weeks 6-36; * at weeks 24, 30]
(T)Higher scores indicate better QOL
Mixed Model Assessment week x treatment arm interaction: p < 0.001
Presenter: Dr. Daniel J. Khalaf
[Speaker video inset] Daniel Khalaf
Patient reported quality of life (QoL) for docetaxel (Doc) vs lutetium177-617-PSMA (LuP) for metastatic castration-resistant prostate cancer (mCRPC): Results from the Canadian cancer trials group (CCTG) PR21 trial
BILBAO AUDITORIUM - HALL 3
Nature Medicine@NatureMedicine
Trial design schema: Nature Medicine figure: CONSORT flow and study schema, visugromab + nivolumab
At #ESMO26: In a phase 2a trial, treatment of patients with immune checkpoint-inhibitor-naive bladder cancer with the GDF15-neutralizing antibody visugromab + nivolumab produced encouraging response with no new safety signals @AndreaNecchi dlvr.it/TW32cC https://t.co/e8MZv40sb3
a
Assessed for eligibility
n = 50
September 2023 to March 2025
Excluded (n = 19)
Did not meet eligibility criteria (n = 17)
Other reasons (n = 2)
Enrolled and treated
n = 31
Safety population
Group A, n = 15; group B, n = 16
Excluded from efficacy analyses (n = 4)
Group A: withdrawal, n = 1; dosing error, n = 1 (both excluded from both analyses)
Group B: late withdrawal before RC, n = 1 (excluded from pathological analysis)
Group B: not RECIST evaluable, n = 1 (excluded from radiographic analysis)
Local pathological response population (pCR, MPR)
n = 28
Group A, n = 13
Group B, n = 15
Local radiographic response population (ORR per RECIST 1.1)
n = 28
Group A, n = 13
Group B, n = 15
b
Eligible population
Stage T2–T4a N0 M0 muscle-invasive bladder cancer; ineligible for or declining cisplatin-based chemotherapy; pure or predominant (≥50%) urothelial histology
TURBT
Baseline tumour biopsy, TNM staging, PD-L1 status (CPS)
Sequential treatment assignment (1:1)
Stratified by disease stage (T2 versus T3–T4a) and PD-L1 CPS (<10 versus ≥10)
Alternating allocation (A→B→A→B...) within strata
Participants per stratum
Stratum | A | B
T2/CPS <10 | 5 | 5
T2/CPS ≥10 | 4 | 5
T3–T4a/CPS <10 | 2 | 2
T3–T4a/CPS ≥10 | 4 | 4
Total | 15 | 16
Group A (n = 15)
Nivolumab 480 mg i.v.
+ placebo i.v.
Three cycles, every 4 weeks
4–8 weeks after the last trea[tment] [obscured by QR code]
Restaging CT (RECIST v1.1)
Radi[cal cystectomy] (RC) [obscured]
Dana-Farber@DanaFarber
1) Slide: Poster 3599P: Plasma proteomics reveals biological landscape of TKI sensitivity in mRCC · 2) Slide: Poster 4743P: Functional epigenomic liquid biopsy at EV/P resistance in mUC - emerging role · 3) Response data: Poster 2265P (FPN): Baseline and dynamic ctDNA changes as correlates of resistance
The first day of poster presentations at #ESMO26 featured new research from metastatic prostate, renal, and urothelial cancers. https://t.co/Moi4CTcFWM
[Slide 2]
[Photo of presenter beside poster; sign: POSTER AREA; board 3599P]
#3599P Plasma Proteomics Reveals the Biological Landscape of Tyrosine Kinase Inhibitors (TKI) Sensitivity in Metastatic Renal Cell Carcinoma (mRCC)
Liliana Ascione, Clara Steiner, Coren Lahav, Yehonatan Elon, Adam P. Dicker, Michal Harel, Marc Eid, Renee Maria Saliby, Karl Semaan, Eddy Saad, Razane El Hajj Chehade, Marc Machaalani, Mustafa Saleh, Wassim Daoud Khatoun, Pablo Barrios, Rashad Nawfal, Francois-Xavier Danlos, Laurence Albiges, Toni K. Choueiri, Wenxin Xu [affiliation superscripts]
1Dana-Farber Cancer Institute, Boston, MA, USA; European Institute of Oncology (IEO), IRCCS, Milan, Italy; 3 Department of Urology, University Hospital Leipzig, Leipzig, Germany; 4OncoHost, Binyamina, Israel; 5Thomas Jefferson University, Philadelphia, PA, USA; 6Institut Gustave Roussy, Villejuif, France; 7Harvard Medical School, Boston, MA, USA
Background
- We previously developed a plasma proteomic signature (TKI-POS) by selecting circulating proteins associated with response to TKI therapy in RCC.
- This PRO-TKI score was associated with prolonged OS after treatment with TKI-containing regimens, versus immune-checkpoint inhibitors-only regimens, in an independent validation cohort.
- A bioinformatic analysis of the model proteins was performed to characterize the biological mechanisms underlying the plasma proteins most predictive of TKI benefit.
Methods
[Schema: Pre-treatment Plasma Sample -> Aptamer-based Proteomic Assay -> Computational Analysis -> TKI-positive / TKI-negative]
- Pre-treatment plasma proteomic data from 178 mRCC were generated using SomaScan 7K.
- During the TKI-POS model development, proteins were selected from the 7K panel.
- Protein localization and expression in different tissues were obtained from publicly available datasets.
- Fisher's exact test (FDR<0.1) was used to identify significantly enriched functional groups.
Figure A: Venn diagram - Intracellular 152; Membranal 29; Secreted 84; overlaps 52, 48, 14, 9
Figure B: protein network (legend: Angiogenesis; Blood vessel; Blood vessel morphogenesis; Endothelium development; HIF-1 signaling pathway; PDGF/VEGF domain; Regulation of angiogenesis; Signaling by PDGF; Signaling by VEGF; VEGFA-VEGFR2 signaling; VEGF ligand-receptor interactions; Cell adhesion; Cell-cell signaling; Extracellular matrix; Immune system process; Inflammatory response)
Figure C: enrichment terms - Prognostic unfavorable in RCC; HoC: Inducing angiogenesis; NMF2 (angiogenesis; FA oxidation); Secreted; Extracellular region part; ECM core; NMF5 (cell cycle; FA synthesis); HoC: Tumor promoting inflammation; NMF3 (Complement; O oxidation); HoC: Replicative immortality; NMF1 (angiogenesis; stroma); Lipid transport; NMF7 (snoRNA)
Figure A. Protein localization Venn diagram based on Human Protein Atlas data; B. Protein network of angiogenesis-related proteins; C. Enrichment analysis of the core proteins in the model
Results
- TKI-POS model is comprised of 416 proteins (393 non-redundant proteins). 169 proteins are considered as core predictive proteins, as they had higher weight in the model (i.e., they were selected >=10 times during model development).
- Protein localization analyses support a composite circulating signal derived from tumor, immune and host stromal compartments (Figure A).
- Among the 416 model proteins, 82 were associated with angiogenesis and vascular remodeling.
- Additional proteins associated with TKI response were linked to tumor plasticity (e.g., B-catenin), inflammation (e.g., IL-8 and IL6), endothelial biology (e.g., PLXDC1 and PLXND1), and extracellular matrix remodeling (e.g., THSB2 and THSB4); Figure B.
- Enrichment analysis further demonstrated significant overrepresentation of pathways related to angiogenesis, tumor-promoting inflammation, extracellular matrix remodeling, lipid transport, and poor prognosis in RCC (Figure C).
Conclusions
Integrative bioinformatic an[...] circulating proteomic model[...] response elucidates the [...] of TKI sensitivity in m[...] strategies to o[...] Prospective val[...] independe[...] [partly obscured by presenter]
Liliana Ascione, MD | liliana.ascione@ieo.it; Toni K. Choueiri | toni_choueiri@dfci.harvard.edu; Wenxin (Vincent) Xu | wenxin_xu1@dfci.harvard.edu
*Liliana Ascione has no conflicts of interest to declare.
[Logos: Dana-Farber Cancer Institute, Gustave Roussy, OncoHost]
[Slide 3]
[Photo of two presenters (badges: Paloma Cejas; Joaquim Bellmunt) in front of poster; board 4743; much of poster obscured]
Functional epigenomic liquid biopsy to guide treatment at EV/P resistance in metastatic urothelial carcinoma (mUC): Emerging role of ERBB3
Bellmunt J1, Li R2, El Sarout S1, Xie Y2, Gulati G1, Epstein IB1, Kukreja S2, Rodriguez L2, Berg SA1, Mantia Ch1, McGregor B1, Kaymakcalan1, Nawfal R1, Baca SC1,2, Choueiri TK1, Freedman ML1, Long HW1,2, Cejas P1,2,3
1. Dana-Farber Cancer Institute, Brigham and Women's Hospital, Boston, MA, USA. 2. Center for Functional Cancer Epigenetics, Dana-Farber Cancer Institute, Boston, MA 02215, USA. 3. Translational Oncology Laboratory, Hospital La Paz Institute for Health Research (IdiPAZ), Madrid, Spain
BACKGROUND
- There is no validated strategy to guide personalized treatment selection following 1st line EV/P failure in mUC
- Liquid biopsy approaches enable real-time functional tumor profiling and may identify emerging actionable targets to inform rational treatment sequencing
- We developed an epigenomic chromatin-based liquid biopsy platform interrogating tumor-derived circulating chromatin using H3K4me2 to capture active enhancer[s] and promoters
METHODS
48 Patients: 7 CR; 20 PR; 11 SD; 10 PD
Baseline (Pre-treatment); Mid (During treatment); Post (After treatment) - Liquid Biopsy
Step 1 Liquid Biopsy; Step 2 Chromatin IP; Step 3 Library prep; Step 4 Sequencing; Step [5] An[alysis]
Fig 1. Study design and w[orkflow]
RESULTS
- Forty-eight pts contributed 96 longitudinal plasma samples.
- Best responses included: CR 7 pts, PR 22, SD 9, and PD 10
- No baseline chromatin features significantly correlated with response, although responders showed a trend toward higher [...]
[...]reme phenotypes (CR vs PD) demonstrated [...] of cancer-specific regulatory elements at PD, [...]B3, which was consistently upregulated at PD [...]atory activity was not enriched in refractory [...]
[...]ts included ERCC2 and CD276, while [...] of FGFR3 and ERBB2 regulatory activity [...]ding known somatic alterations [...]TD2, WEE1, and PPARG [...]
[Figure 2b ERBB3 normalized RPM Pre vs Post by patient (P37, P38, P18, P22, P48, P32, P4...); radar plots Patient P48 (PR) and Patient P26 (PD) with ERCC2, ERBB3, CD276, WEE1, BRCA2 axes; heatmap of actionable genes - partly obscured]
[...]emodeling and emergent therapeutic vulnerabilities during EV/P [...]-fraction-corrected signal increase in 4/5 patients with PD
Abstract #4743P ESMO 2026
[Slide 4]
[Photo of two presenters beside poster; board 2265P]
FPN: 2265P ESMO Congress 2026
Baseline and dynamic changes in circulating tumor DNA (ctDNA) as correlates of intrinsic and acquired resistance to 177Lu-PSMA-617 (LuPSMA) in metastatic castration-resistant prostate cancer (mCRPC)
Praful Ravi1, Guanglong Jiang2, Chao Dai2, Brady James1, Megan Lee1, Hailey A. Stoltenberg1, Gwo-Shu Mary Lee1, Heather Jacene1, Jacob E. Berchuck3, Sylvan Baca1, Yong Huang2, Pan Du2, Shidong Jia2, Alok K. Tewari1
1Dana-Farber Cancer Institute, Boston, MA, USA; 2Predicine Inc., Hayward, CA, USA; 3Winship Cancer Institute of Emory University, Atlanta, GA, USA
[Logos: Dana-Farber Cancer Institute; Harvard Medical School]
Background
- Intrinsic or acquired resistance to LuPSMA is seen in nearly all patients (pts) with mCRPC.
- Biomarkers to select pts for LuPSMA monotherapy, combination strategies or alternative therapies are lacking.
- Serial ctDNA profiling before, during and at progression (PD) on LuPSMA may build on prior publications to elucidate genomic and epigenomic associations with resistance.
Methods
- mCRPC pts treated with >=2 cycles of LuPSMA at Dana-Farber Cancer Institute (Jul 2022 - Aug 2024) with research plasma at cycle 1 (C1D1) and at C3D1 and/or PD.
[LuPSMA treatment cycles C1-C6; C1D1 (n=63); C3D1 (n=50); PD (n=41); PredicineCARE: Targeted NGS: SNVs, CNVs, fusions; PredicineSCORE: LP-WGS: CNB score, tumor fraction (TF), ARBS nucleosome profiling]
[Clinical outcome definitions table partly obscured: ...response Best PSA decline >90% 17/72; ...tional response PSA90 or OS >18 mo 24/72; ...c resistance Clinical/radiographic PD <=3 mo or OS <=9 mo 25/72; ...d resistance PD after 3 mo 54/72]
[Stat tiles: 72 treated LuPSMA; 63 with baseline ctDNA NGS; 154 LP-WGS samples (52 pts); 35% intrinsic resistance]
Median age 71 yrs; median PSA 41 ng/mL; visceral metastases 33%. Self-reported Race: 60 White, 6 Black, 4 Hispanic, 1 Asian, 1 N/A
Results: Tumor Fraction & ARBS
Baseline ctDNA tumor fraction is prognostic
[KM: p < 0.0001; table Continuous TF: OS HR 25.6 P 2.6x10^-x; CR-PFS 6.5, 2.3x10^-x; PSA-PFS 6.4, 5.3x10^-x - exponents illegible]
Figure 2. (Left) OS by baseline TF >2% vs <=2%. (Right) Baseline combo TF by response group (Wilcoxon). *Cox HR per unit TF (0-1).
- TF >2% (n=46) vs <=2% (n=17): shorter OS (log-rank p<0.0001).
- Mean TF lower in exceptional responders (0.08 vs 0.33; P=1.3x10^-x) and higher with intrinsic resistance (0.41 vs 0.15; P=1.7x10^-x).
Integrated Analysis of PSA, tumor fraction and AR binding sites during LuPSMA treatment
Figure 3. (A) ARBS abnormality score vs CNV-inferred TF (R=0.81); ... 105/154 samples (68%) CNB-positive; 78/154 (51%) AR-positive by ARBS profiling. In pts 54 and 55, TF and ARBS abnormality fell at C3D1 and rebounded at PD; in pt 54, PSA remained below baseline.
Results: Intrinsic Resistance
Baseline alterations in the 9p21 locus (MTAP, CDKN2A/B), the PI3K/AKT pathway, AR gain, MDM2 gain and BRCA2 were enriched in pts with intrinsic resistance.
[Forest table, Gene | Resistant (n=25) | Non-resist. (n=38) | OR (95% CI) | FDR - e.g. MTAP 11 (44%) | 1 (3%) | 27.5 (3.4->400) | 0.007; CDKN2B 11 (44%) | 2 (5%) | 13.5 (2.5-140) | 0.007; remaining rows small, partially legible]
Figure 4. Baseline gene alterations (SNV/CNV/fusion) associated with intrinsic resistance (all FDR <0.025; n=63).
- PTEN alteration (OR 0.08, FDR 0.034) and MYC gain (OR 0.09, FDR 0.040) were less frequent in exceptional responders.
- Associations are univariable and not adjusted for TF; many CNV associations may reflect higher tumor burden.
Results: Acquired Resistance
Of 41 pts with PD samples, 18 had treatment-emergent or clonally enriched alterations, spanning TP53, DNA repair, PI3K/RAS/MAPK, WNT and AR-axis genes.
Figure 5. Alterations emergent or enriched (VAF increase >10%) at PD vs [...] patient.
- Emergent AR L702H; BRCA2, POLE, MRE11 and P[...] alterations in 5 pts; TP53 in 6 pts.
- 4 clones declined >10% at PD (TP53 x2, RB1, RA[...])
Conclusions
- Baseline ctDNA tumor fraction is strongly prognostic o[...] identifies pts with markedly shorter OS.
- Baseline 9p21 (MTAP/CDKN2A/B) loss, PI3K/AKT alte[...] MDM2 gain and BRCA2 alterations are associated wi[th intrinsic] resistance.
- Acquired resistance is genomically heterogeneous, wi[...] suggests AR signaling is retained at PD in most patie[nts].
- Integrating ctDNA with clinical features may help sele[ct ...] combinations or alternative therapies; validation in la[rger cohorts is] warranted.
- Longitudinal ctDNA tumor fraction dynamics and AR [...] molecular insights beyond PSA alone during prosta[...]
- Plasma cfRNA analysis is ongoing.
Acknowledgements: Study sponsored in part by Predicine Inc. Disclosure: The presenting author has no relevant disclosures
Dana-Farber@DanaFarber
Slide: KEYNOTE-564 final analysis background slide (Toni Choueiri)
.@DrChoueiri presents the final protocol-prespecified analysis of the phase 3 KEYNOTE-564 trial, evaluating adjuvant pembrolizumab versus placebo in patients with clear cell renal cell carcinoma (ccRCC). #ESMO26 https://t.co/YQIWCdd48V
Background
• Adjuvant pembrolizumab is a standard of care for patients with clear cell renal cell carcinoma (ccRCC) at increased risk of recurrence postsurgery based on significantly improved disease-free survival (DFS) and overall survival (OS) versus placebo in the primary results of the KEYNOTE-564 trial (NCT03142334)1
• With a minimum of 5 years of follow-up, adjuvant pembrolizumab continued to show improved DFS and OS versus placebo; this benefit was also observed across key protocol-defined risk subgroups2
• We present updated data from the final protocol-prespecified analysis of KEYNOTE-564 with 7 years of follow-up
1. Choueiri TK et al. N Engl J Med. 2021;385:683-694. 2. Haas NB et al. J Clin Oncol. 2025;43:4514.
UroToday.com@urotoday
Kaplan-Meier survival data: CRPC-free survival and overall survival by deep vs non-deep PSA response
PSA Nadir >0.2 ng/mL Defines a Biologically Aggressive Subgroup in Metastatic Hormone-Sensitive #ProstateCancer. Presented by Dr. Nely Mercy Diaz Mejia. #ESMO26 written coverage by @chavarriagaj > https://t.co/BNiD6K0RAd #mHSPC #PrecisionOncology @myESMO https://t.co/0wRgE2lZxN
CRPC-FS
Deep PSA response 88m
Non-deep response 13.3m
p<0.001
Survival probability
Time (months)
Number at risk
CRPC-FS Multivariate analysis
PSA<0.2 p<0.001
Stage IV at diagnosis
High volume p 0.009
ADT + D vs ADT p 0.03
ADT + ARPI vs ADT p 0.02
Triplet vs ADT p 0.036
Hazard Ratio (95% CI)
OS
Deep PSA response 83.5m
Non-deep response 31.5m
p<0.001
OS Multivariate analysis
PSA<0.2 p<0.001
Stage IV at diagnosis
High volume p<0.001
ADT + D vs ADT
ADT + ARPI vs ADT
Triplet vs ADT
Hazard Ratio (95% CI)
Survival table
Endpoint: CRPC-free survival and overall survival by PSA response
Deep PSA response (CRPC-FS) | 390 | 88m
Non-deep response (CRPC-FS) | 211 | 13.3m
Deep PSA response (OS) | 392 | 83.5m
Non-deep response (OS) | 211 | 31.5m
P: p<0.001 (both CRPC-FS and OS)
UroToday.com@urotoday
1) Slide: ESMO guideline treatment algorithm for low-, intermediate- and high-risk localised prostate · 2) Trial design schema: ESMO guideline treatment algorithm for very high-risk localised or cN1 · 3) Kaplan-Meier survival data: Event-free survival curves: apalutamide plus ADT vs radical · 4) Slide: The PACE umbrella trials in localised prostate cancer: PACE A, B and C designs and patient numbers
Optimizing Therapy for Locally Advanced #ProstateCancer. Presented by @BarbaraJereczek. #ESMO26 written coverage by @zklaassen_md > https://t.co/b8Ifd6LDXn #RadOnc #GUOnc @myESMO https://t.co/rSo2C0Vptk
[Slide 1]
Low-, intermediate- or high-risk localised prostate cancer
Unsuitable (or unwilling) for radical treatment or active surveillance → WW with delayed ADT [I, A]
Low risk → Active surveillance [I, A]
Favourable intermediate risk → Active surveillance [II, A] | RP [I, B] | SBRT [I, A] Brachytherapy [I, B] EBRT [I, B]
Unfavourable intermediate risk → RP [I, B] | EBRT ± brachytherapy [I, B] → ADT for 4-6 months [I, A]
High-risk localised or locally advanced disease → RP [I, B] RP + PLND [III, B] | EBRT ± brachytherapy [I, B] → ADT for 18-36 months [I, A]
Monitor PSA levels [II, A]
Undetectable PSA → Surveillance [I, A] | pN1 → If unfavourable or high-risk: RT ± ADT [II, B]
Confirmed persistent PSA → M0 at restaging → Salvage RT ± ADT for 6-24 months [II, B]
Ann Oncol. 2026 Apr;37(4):453-469.
[Slide 2]
Very high-risk or cN1 prostate cancer
Very high-risk localised disease → WW with delayed ADT [I, A] | EBRT ± brachytherapy to prostate + ADT (3 years) + abiraterone (2 years) [I, A] | RP [I, B] RP + PLND [III, B]
cN1 disease (by conventional imaging) → EBRT ± brachytherapy to prostate + ADT (3 years) + abiraterone (2 years) [I, A]
Monitor PSA levels [II, A]
Undetectable PSA → Surveillance [I, A] | pN1 → Surveillance [I, A] | RT ± ADT [IV, C]
Confirmed persistent PSA → M0 at restaging → Salvage RT ± ADT for 6-24 months [II, B]
Ann Oncol. 2026 Apr;37(4):453-469.
STAMPEDE pts
[Slide 3]
T recovery to ≥200 ng/dL: Median 20.7 months (~9 months from EOT)
APA + ADT Median not reached
RP + PLND alone Median 19.1 months
63.0% (95% CI, 52.2-71.9)
41.4% (95% CI, 35.6-47.1)
HR, 0.38a 95% CI, 0.26-0.55 p<0.0001b
Event-Free Survival (%)
Months from Randomization
No. at risk
APA + ADT 102 99 96 91 82 71 38 10
RP + PLND alone 306 195 169 146 131 121 74 15
Survival table
Endpoint: Event-free survival
APA + ADT | 102 | NR
RP + PLND alone | 306 | 19.1
HR: 0.38
HR CI: 0.26-0.55
P: <0.0001
36 mo: 63.0% (95% CI, 52.2-71.9) APA + ADT vs 41.4% (95% CI, 35.6-47.1) RP + PLND alone
[Slide 4]
The PACE umbrella
Localised prostate cancer
CI Dr Nick van As
The Royal Marsden Cancer Charity
PACE A 234 → Surgery | 5 days SBRT
PACE B 874 → 4 weeks | 5 days
PACE C 1182 patients → 4 weeks and ADT | 5 days and ADT
PACE C CI Alison Tree
Dana-Farber@DanaFarber
Trial design schema: KIM-1-guided precision medicine trial emulation: hypothetical design and COSMIC-313
Can a biomarker help guide treatment selection for advanced kidney cancer?
New findings from the phase 3 COSMIC-313 trial, presented by @VincentWenxinXu, MD, support the potential of KIM-1 to identify patients with advanced clear cell renal cell carcinoma who may benefit from immunotherapy alone versus immunotherapy plus cabozantinib.
These findings advance efforts to use biomarkers to guide more personalized treatment strategies for kidney cancer. #ESMO26
Can We Emulate a KIM-1-Guided Precision Medicine Trial Testing the Benefit of Adding a TKI in Patients With IO-Resistant ccRCC?
Hypothetical Trial Design
Metastatic ccRCC -> Biomarker sampling (baseline) -> Nivolumab + ipilimumab -> Biomarker sampling (Day 21)
KIM-1 ≤30% decrease (~70% of patients) -> R -> Zanzalintinib* + nivolumab / Nivolumab + ipilimumab (Improved outcomes?); mPFS <8 months
KIM-1 >30% decrease (~30% of patients) -> Nivolumab + ipilimumab; mPFS >70 months
COSMIC-313 In Silico Data
Metastatic ccRCC -> Predict KIM-1 nivolumab + ipilimumab suboptimal decrease based on transcriptomic model -> R -> Cabozantinib + nivolumab + ipilimumab / Nivolumab + ipilimumab
Can we predict the benefit of adding TKI to IO among patients who are unlikely to have a ≤30% decrease in KIM-1 on ipi/nivo?
• What is the biology of KIM-1 decreasers?
• Can predictive modeling be used to predict patients who will have IO-based KIM-1 decrease across treatment arms in COSMIC-313?
*Zanzalintinib is a novel, oral small-molecule inhibitor of multiple kinases, including the TAM kinases (TYRO3, AXL, and MER), MET, and VEGF receptors, which are involved in oncogenic processes including tumor cell proliferation, metastasis, angiogenesis, drug resistance, and evasion of antitumor immunity.
ccRCC, clear cell renal cell carcinoma; KIM-1, kidney injury molecule-1; IO, immuno-oncology; mPFS, median progression-free survival; R, randomized; TKI, tyrosine kinase inhibitor.
UroToday.com@urotoday
1) Kaplan-Meier survival data: EFS and OS in the reTURBT group (N=53), San Raffaele MIBC cohort · 2) Kaplan-Meier survival data: EFS and OS by pathological response: reTURBT vs radical cystectomy · 3) Kaplan-Meier survival data: Swimmer plot of the reTURBT group (N=53) by ypT0 status and events
Outcomes of Patients with #MIBC Who Declined Radical Cystectomy in Perioperative Therapy Trials Conducted at San Raffaele Comprehensive Cancer Center. Presented by @CMercinelli @SanRaffaeleMI. #ESMO26 written coverage by @rksayyid @UAUrology > https://t.co/e0SB3MklYI #BladderCancer #GUOnc @myESMO
[Slide 2]
Figure 1A EFS, reTURBT group (N = 53)
Figure 1B OS, reTURBT group (N = 53)
TURBT only
Event-free survival (%) / Overall survival (%)
Time from therapy (months)
Number at risk
Cumulative number of censoring
36-mo EFS 66.7% (95% CI 54.5–81.7); MFS 65.9% (50.9–85.4)
36-mo OS 82.7% (95% CI 72.4–94.6)
Survival table
Endpoint: EFS, MFS and OS (reTURBT group)
reTURBT (TURBT only) | 53
36-mo EFS 66.7% (95% CI 54.5–81.7)
36-mo MFS 65.9% (50.9–85.4)
36-mo OS 82.7% (95% CI 72.4–94.6)
[Slide 3]
Figure 2A EFS by pathological response
Figure 2B OS by pathological response
TURBT no RD, TURBT RD, RC pCR, RC no pCR
Event-free survival (%) / Overall survival (%)
Time from therapy (months)
Number at risk
Cumulative number of censoring
24-mo EFS, reTURBT vs RC: pCR 87.6% vs HR 1.96 (0.53–7.27); non-pCR 19.3% vs 67.8%
24-mo OS, reTURBT vs RC: pCR 96.7%, HR 0.90 (0.10–8.40); non-pCR 50.4% vs 82.5%
TURBT no RD / RD: ypT0Nx / residual disease at reTURBT; RC pCR: ypT0N0. Log-rank p<0.001 across the four groups for EFS, MFS and OS.
Survival table
Endpoint: EFS and OS by pathological response
TURBT no RD | 35
TURBT RD | 18
RC pCR | 72
RC no pCR | 141
HR: pCR reTURBT vs RC: EFS HR 1.96; OS HR 0.90
HR CI: EFS 0.53–7.27; OS 0.10–8.40
P: Log-rank p<0.001 across the four groups
24-mo EFS pCR reTURBT 87.6%; non-pCR 19.3% vs 67.8%
24-mo OS pCR reTURBT 96.7%; non-pCR 50.4% vs 82.5%
[Slide 4]
Figure 2C Swimmer plot, reTURBT group (N = 53)
Patient ID
Time (months)
ypT0 status: Non-ypT0, ypT0
Events: TURBT, Delayed RC, Delayed RT, Relapse, Maintenance therapy, Death
UroToday.com@urotoday
1) Slide: Slide: hypervascularity and heterogeneous perfusion as a barrier to uniform ADC delivery in ccRCC · 2) Slide: Slide: ADC delivery as a balance between tumour perfusion and vessel-wall permeability in ccRCC
Novel ADC Therapies: Why Has ADC Development Struggled in RCC? Presented by @YujiMiura5. #ESMO26 written coverage by @chavarriagaj > https://t.co/DoHTzjmxbv #KidneyCancer #RCC #GUOnc @myESMO https://t.co/Y17Cc7V5hC
[Slide 2]
Potential barriers in ccRCC
Mosele et al. Nat Med (32)2774-2785, 2026
1. Hypervascularity Ü uniform ADC delivery
Yuan Q. et al. Clin Genitourin Cancer 14(6); e585-e594, 2016
• Intratumoral perfusion is spatially heterogeneous even in hypervascular ccRCC.
• Heterogenous perfusion may result in spatially uneven ADC delivery to tumor cells.
[Slide 4]
BARRIER 1: Delivery
Can the ADC reach the tumor cell?
Pharmacokinetics | Tumor penetration | Target recognition | Intracellular trafficking | Payload | TME modulation
Mosele et al. Nat Med (32)2774-2785, 2026
Potential barriers in ccRCC
ADC delivery = Balance between Perfusion and Permeability
Antibody Drug Conjugates tumor [g]
Tumor Vascular density [1/cm]
Vessel wall pore radius [nm]
×10^-8
Harkos C. et al. J Immunother Cancer 2026;14:e015357
Functional vascular density
Amount of perfused, functional vessels
High functional density
Low functional density
• Determines how much ADC can be delivered to the tumor.
• Heterogeneous and inefficient perfusion in ccRCC.
Vessel wall pore radius
Vascular permeability for macromolecules
Large pore radius (≥ ~40 nm)
Small pore radius (< ~40 nm)
• Controls ADC extravasation across the vessel wall.
• Excessive normalization may reduce permeability.
Optimal ADC delivery requires both sufficient functional vessel density and adequate vascular pore size.
UroToday.com@urotoday
1) Trial design schema: NIAGARA study design: perioperative durvalumab plus gemcitabine-cisplatin · 2) Slide: Histologic subtypes in NIAGARA: UC with divergent differentiation or histologic subtypes · 3) Kaplan-Meier survival data: NIAGARA UC with DDHS subgroup: pCR rate, EFS and OS · 4) Kaplan-Meier survival data: NIAGARA UC with DDHS subgroup: MFS, DSS and DFS
Outcomes in Patients With #MIBC With Divergent Differentiation or Histologic Subtypes From NIAGARA. Presented by @ZakhariaYousef @MayoClinic. #ESMO26 written coverage by @chavarriagaj @PSH_Urology > https://t.co/Oy35FpLLfG #BladderCancer #Immunotherapy @myESMO https://t.co/Nuz7JgdHvp
[Slide 1]
Perioperative
Study population
• Adults
• Cisplatin-eligible patients with MIBC (cT2–T4aN0/1M0)
• UC or UC with DDHS
• Evaluated and confirmed for RC
• CrCl of ≥40 mL/min
R 1:1
Neoadjuvant Q3W, 4 cycles; Adjuvant Q4W, 8 cycles
D arm N=533: D 1500 mg IV + Gemcitabine + cisplatin → RC → D 1500 mg IV
C arm N=530: Gemcitabine + cisplatin → RC → No treatment
Dual primary endpoints
• pCR and EFS
Key secondary endpoint
• OS
Secondary endpoints
• MFS, DSS, and DFS
• Safety
First patient enrolled: Nov 2018
Last patient enrolled: Jul 2021
Last RC: Nov 2021
Full study design details have been previously published and are available at ClinicalTrials.gov, NCT03732677; EudraCT number, 2018-001811-59. C, comparator; CrCl, creatinine clearance; D, durvalumab; DFS, disease-free survival; DSS, disease-specific survival; IV, intravenously; MFS, metastasis-free survival; Q3W, every 3 weeks; Q4W, every 4 weeks; R, randomised; RC, radical cystectomy.
[Slide 2]
Figure 1. Histologic subtypes in NIAGARA
UC with DDHS = 16% of ITT^6
84% Invasive UC, not otherwise specified
8% UC with squamous differentiation
2% UC with glandular differentiation
5% UC with other histologic subtype
N=1063
Squamous differentiation, n=87; glandular differentiation, n=25; other histologic subtype, n=53.
[Slide 3]
Figure 2. pCR, EFS, and OS in patients with UC with DDHS
A pCR rate^6
Odds ratio, 1.43 (95% CI, 0.75–2.70)
D arm n=76: 41% (31/76); C arm n=89: 33% (29/89)
ITT^6,13 | D arm N=533 | C arm N=530 | Odds ratio (95% CI)
pCR rate, n | 199 (37%) | 146 (28%) | 1.60 (1.23–2.08)
B EFS^6
Probability of EFS / Time from randomisation (months); D arm, C arm
| UC with DDHS D arm n=76 | C arm n=89 | ITT^6 D arm N=533 | C arm N=530
EFS events, n (%) | 24 (32) | 49 (55) | 187 (35) | 246 (46)
Median EFS (95% CI), months | NR (NR–NR) | 32.2 (16.1–NR) | NR (NR–NR) | 46.1 (32.2–NR)
HR (95% CI) | 0.52 (0.32–0.84) | 0.68 (0.56–0.82)
C OS^6
Probability of OS
| UC with DDHS D arm n=76 | C arm n=89 | ITT^6 D arm N=533 | C arm N=530
Deaths, n (%) | 19 (25) | 39 (44) | 136 (26) | 169 (32)
Median OS (95% CI), months | NR (NR–NR) | NR (35.8–NR) | NR (NR–NR) | NR (NR–NR)
HR (95% CI) | 0.53 (0.30–0.91) | 0.75 (0.59–0.93)
Data cutoff: 29 April 2024. pCR results assessed by central pathology review are presented as odds ratio with corresponding CIs obtained using logistic regression (adjusted for stratification factors in the ITT and in the subgroup stratified by treatment and UC with DDHS only). EFS was assessed by BICR, or by central pathology review when a biopsy was required to evaluate a suspected new lesion. Median EFS and OS and corresponding 95% CIs were estimated using the Kaplan–Meier method. For the subgroup analyses, HR was based on an unstratified Cox proportional hazards model with ties handled by the Efron approach. BICR, blinded independent central review; CI, confidence interval; HR, hazard ratio; NR, not reached.
Survival table
Endpoint: EFS (UC with DDHS subgroup)
Arm | N | Median | Median CI
D arm (durvalumab + gem/cis) | 76 | NR | NR-NR
C arm (gem/cis) | 89 | 32.2 | 16.1-NR
HR: 0.52
HR CI: 0.32-0.84
[Slide 4]
Figure 3. Additional efficacy outcomes in patients with UC with DDHS
A MFS B DSS C DFS (RC + disease-free)
Probability of MFS / DSS / DFS; Time from randomisation (months); Time from radical cystectomy (months); D arm, C arm
MFS | UC with DDHS D arm n=76 | C arm n=89 | ITT D arm N=533 | C arm N=530
MFS events, n (%) | 23 (30) | 41 (46) | 152 (29) | 201 (38)
Median MFS (95% CI), months | NR (NR–NR) | 43.8 (30.6–NR) | NR (NR–NR) | NR (48.0–NR)
HR (95% CI) | 0.63 (0.37–1.04) | 0.67 (0.54–0.83)
DSS | UC with DDHS D arm n=76 | C arm n=89 | ITT D arm N=533 | C arm N=530
Death due to bladder cancer, n (%) | 9 (12) | 25 (28) | 85 (16) | 114 (22)
Median DSS (95% CI), months | NR (NR–NR) | NR (NR–NR) | NR (NR–NR) | NR (NR–NR)
HR (95% CI) | 0.39 (0.17–0.81) | 0.69 (0.52–0.91)
DFS | UC with DDHS D arm n=49 | C arm n=54 | ITT D arm N=352 | C arm N=337
DFS events, n (%) | 8 (16) | 19 (35) | 78 (22) | 102 (30)
Median DFS (95% CI), months | NR (NR–NR) | NR (32.6–NR) | NR (NR–NR) | NR (51.3–NR)
HR (95% CI) | 0.45 (0.19–0.99) | 0.69 (0.51–0.93)
Data cutoff: 29 April 2024. Median MFS, DSS, and DFS and corresponding 95% CIs were estimated using the Kaplan–Meier method. For the subgroup analyses, HR was based on an unstratified Cox proportional hazards model with ties handled by the Efron approach. For the ITT, HR was based on a stratified Cox proportional hazards model, and the stratification factors were tumour stage (T2N0 vs >T2N0), renal function (adequate vs borderline), and PD-L1 status (high vs low/negative) per interactive voice response system, with ties handled by the Efron approach.
Survival table
Endpoint: MFS (UC with DDHS subgroup)
Arm | N | Median | Median CI
D arm (durvalumab + gem/cis) | 76 | NR | NR-NR
C arm (gem/cis) | 89 | 43.8 | 30.6-NR
HR: 0.63
HR CI: 0.37-1.04
UroToday.com@urotoday
1) Slide: mCRPC progression patterns schematic: slowly rising PSA, oligoprogression, progression, rapid · 2) Biomarker data: ESMO prostate cancer living guideline algorithm for metastatic CRPC: bone · 3) Slide: REDUSE 96/12 trial summary: denosumab every 12 weeks vs every 4 weeks in bone metastases
Management of #mCRPC: Personalized Treatment Selection and Sequencing. Presented by Dr. Deborah Mukherji, MBBS, FRCP. #ESMO26 written coverage by @zklaassen_md > https://t.co/HZuRnnkilI #ProstateCancer #PrecisionOncology @myESMO https://t.co/YRwgdgGWkI
[Slide 2]
Arrival from prior therapy
mCRPC
Slowly rising PSA (Sustained response) | Indolent disease course Continue monitoring
Oligoprogressive disease | Consider SBRT while maintaining systemic control
Progression requiring change in therapy | Select next mechanism based on prior exposure and biomarkers
Rapid progression | Symptomatic/visceral disease Consider prompt systemic therapy
Aggressive variant / neuroendocrine transformation | Consider platinum-based therapy Clinical trials
[Slide 3]
CLINICAL PRACTICE GUIDELINES
ESMO Advanced and Metastatic Prostate Cancer Living Guideline
v1.0 June 2026
Metastatic CRPC
aBPAs are administered concomitantly with anticancer treatments.
Fizazi K, Attard G, Azad A et al
Advanced and metastatic prostate cancer: ESMO Clinical Practice Guideline for diagnosis, treatment and follow-up Annals of Oncology, 2026; 37, 590-607
mCRPC
1 First, think about bone protective agents in all patients with bone metastasesa
Patients with bone metastases
BPAa [I, A]
Biomarkers testing
Patient without detected genetic alterations
Presence of detected genetic alterations
[Slide 4]
REDUSE 96/12: Denosumab Q12w vs Q4w
Phase III, randomized, non-inferiority trial in patients with bone metastases from mBC or mCRPC
Trial design
N = 1,380
Patients with bone metastases from mBC or mCRPC
Randomised, phase III, double-blind
Denosumab 120 mg SC every 4 weeks (Q4w)
Denosumab 120 mg SC every 12 weeks (Q12w) after induction phase
All patients: 500 mg calcium + 400 IU vitamin D daily
Key efficacy result
Q12w non-inferior to Q4w for time to first symptomatic skeletal event (SSE)
HR 1.023 (90% CI 0.874–1.197)
Key safety results
Lower risk of hypocalcaemia significantly less with Q12w
Lower risk of ONJ/tooth infection less with Q12w
Economic impact
Drug costs reduced by 53% per patient with Q12w
UroToday.com@urotoday
1) Trial design schema: Study schema: first-in-human [89Zr]Zr-DFO-EV PET imaging · 2) Slide: PET imaging panels: [89Zr]Zr-DFO-EV PET vs [18F]FDG PET vs ceCT
First-in-Human PET Imaging with an Antibody-Drug Conjugate Using Radiolabeled Enfortumab Vedotin. Presented by Freba Grawe. #ESMO26 written coverage by @zklaassen_md > https://t.co/n2l06ajmbP #BladderCancer #UrothelialCancer #PrecisionOncology @myESMO https://t.co/rqmkt9kl1l
[Slide 1]
1 Patient cohort
9 patiens enrolled
7 male, 2 female
73.5 y median age
Tumor entities:
❖ 7 Urothelial cancer
❖ 1 Head and neck cancer
❖ 1 Cervical cancer
2 Baseline imaging
[89Zr]Zr-DFO-EV PET/CT Dose: [37 MBq]
[18F]FDG PET/CT Dose: [2 MBq/kg]
• EV PET scan 5-7 d post injection
• Additional FDG PET within 4 d prior to EV PET in 6 patients
3 Treatment
EV P
4 Follow-up imaging
[89Zr]Zr-DFO-EV PET/CT Dose: [37 MBq]
[18F]FDG PET/CT Dose: [2 MBq/kg]
Imaging analysis:
• Lesion detection rates (EV vs. FDG vs. ceCT)
• Tracer uptake (SUVmax)
• Tumor-to-background ratio
5 Response assessment
RECIST 1.1
Complete response
Partial response
Stable disease
Progressive disease
UroToday.com@urotoday
1) Biomarker data: COMRADE poster: baseline ctDNA tumor fraction distributions by prior docetaxel · 2) Biomarker data: COMRADE poster Table 1: baseline ctDNA detection and tumor fraction as prognostic · 3) Biomarker data: COMRADE poster: ctDNA tumor fraction trajectories in the radium-223 monotherapy · 4) Biomarker data: COMRADE poster: genomic composition of persistent ctDNA alterations in radium-223
Longitudinal ctDNA Tumor Fraction in Bone-Dominant #mCRPC Treated with Radium-223 ± Olaparib: Results from the Phase 2 COMRADE Trial. Presented by @DrRanaMcKay @UCSanDiego. #ESMO26 written coverage by @rksayyid @UAUrology > https://t.co/J07SmDIzPK #ProstateCancer #PrecisionOncology @myESMO
[Slide 1]
RESULTS: Baseline tumor fraction distributions
Figure 1: Baseline ctDNA TF Captures Disease Burden Across Key Subgroups
A
P = 0.047
13% (n=50) No | 30% (n=49) Yes
Prior Docetaxel
B
P < 0.001
12% (n=54) ≤20 | 33% (n=45) >20
Bone Lesions
C
P = 0.003
8% (n=34) 0 | 28% (n=65) 1+
ECOG Performance Status
D
P < 0.001
5% (n=49) <Median | 33% (n=50) ≥Median
PSA (Median split)
Tumor Fraction (%)
Wilcoxon rank-sum test | Significant p-values (< 0.05) shown in red bold
Continuous tumor fraction values correlate with adverse clinical events previously demonstrated to associate to lack of response to combination Arm A (>20 bone lesions, prior docetaxel).
[Slide 2]
Table 1: Baseline ctDNA detection and TF magnitude as prognostic factors for rPFS, adjusted for clinical variables, by arm. Detection and TF ≤15% overlap and were therefore tested in separate adjusted models.
Arm | Covariate | n | Univariate HR (95% CI) | p | Multivariate Model 1: TF non-detected HR (95% CI) | p | Multivariate Model 2: TF <=15 HR (95% CI) | p
Arm A: Combo | ctDNA TF Not Detected | 47 | 0.37 (0.15-0.92) | 0.032 | 0.45 (0.17-1.19) | 0.107 | |
| ctDNA TF ≤15% | 47 | 0.12 (0.05-0.30) | <0.001 | | | 0.14 (0.04-0.46) | 0.001
| PSA ≥55.1 ng/mL | 47 | 3.07 (1.41-6.71) | 0.005 | 1.96 (0.83-4.63) | 0.124 | 1.02 (0.36-2.87) | 0.970
| Bone lesions >20 | 47 | 2.23 (1.08-4.62) | 0.031 | 1.79 (0.81-3.93) | 0.148 | 1.27 (0.54-3.00) | 0.579
| Prior docetaxel | 47 | 2.00 (0.94-4.29) | 0.074 | 1.65 (0.75-3.64) | 0.217 | 1.26 (0.52-3.04) | 0.604
Arm B: Monotherapy | ctDNA TF Not Detected | 46 | 0.36 (0.14-0.95) | 0.038 | 0.31 (0.12-0.85) | 0.023 | |
| ctDNA TF ≤15% | 43 | 0.46 (0.23-0.91) | 0.027 | | | 0.46 (0.22-0.99) | 0.047
| PSA ≥55.1 ng/mL | 46 | 2.34 (1.14-4.80) | 0.021 | 2.10 (0.97-4.56) | 0.059 | 1.93 (0.81-4.57) | 0.137
| Bone lesions >20 | 46 | 0.64 (0.33-1.26) | 0.195 | 0.47 (0.21-1.08) | 0.075 | 0.49 (0.21-1.13) | 0.096
| Prior docetaxel | 46 | 1.02 (0.53-1.94) | 0.955 | 1.23 (0.55-2.74) | 0.618 | 1.25 (0.53-2.94) | 0.615
PSA dichotomized at 55.1 ng/mL. TF dichotomized at 15% (TF >15% as reference). Multivariate models adjust for PSA, bone lesion burden, and prior docetaxel within each arm.
Cohort includes all patients with a ctDNA detection result (Detected or Not Detected). Univariate analyses use per-variable complete cases. Multivariate analyses use complete cases on all adjustment variables. Each multivariate model includes one TF covariate; blank cells indicate the covariate was not in that model
[Slide 3]
RESULTS: Tumor fraction trajectories restricted to the SOC Mono arm B
Figure 2. Early radiographic progression events clustered predominantly within the first 6 months from baseline (C1D1) and C2D1, supporting rPFS at 6 months, the scheduled duration of the radium-223 monotherapy course, as the classification endpoint for the concordance diagnostic analyses ctDNA trajectories at baseline and C2D1
ctDNA dynamics — Arm B: Radium-223 (Baseline + C2 union cohort, N = 45)
Timepoint: Cycle 1 (Baseline); Cycle 2
ctDNA TF: ≤ 15%; > 15%
ctDNA detection: Detected; Not Detected
PFS endpoint: Event ≤6 mo from anchor; Event >6 mo from anchor; Censored
Months from C1D1 (treatment start)
TABLE 3: TF magnitude at baseline and persistent on-treatment ctDNA TF detection, captures the patients with near-term progression within the radium-223 treatment window restricted to patients evaluable for 6-month status
Biomarker | Timepoint | N | Sens | Spec | PPV | NPV
TF > 15% | Baseline | 40 | 69.0% | 72.7% | 87.0% | 47.1%
| C2 | 41 | 60.7% | 92.3% | 94.4% | 52.2%
| C4 | 21 | 50.0% | 85.7% | 87.5% | 46.2%
ctDNA detection | Baseline | 43 | 96.6% | 42.9% | 77.8% | 85.7%
| C2 | 41 | 82.1% | 84.6% | 92.0% | 68.8%
| C4 | 21 | 78.6% | 85.7% | 91.7% | 66.7%
Patient-level ctDNA trajectories at baseline and C2D1, aligned to rPFS outcomes, supported rPFS at 6 months as the classification endpoint for the concordance diagnostic analyses. A baseline TF threshold of >15% identified patients at risk for 6-month progression with strong positive prognostic value but limited sensitivity (that did not improve substantially at C2D1 and at C4). In contrast, ctDNA detection status in Arm B was highly concordant with 6-month progression beginning at C2D1 and remained concordant at C4, with detection at C2D1 also outperforming the baseline detection call.
[Slide 4]
RESULTS: Genomic composition of persistent ctDNA in the SOC Arm B progressors.
Figure 4. Alteration dynamics at C2D1 in True-positive progressors on radium-223 monotherapy (Arm B, n=23). (A) Patient-by-gene heatmap showing baseline-to-C2D1 dynamics for genes altered in ≥2 patients. Each row represents one patient, each column one gene; tiles are colored by alteration dynamic (dark blue = persistent at both timepoints; orange = emergent at C2D1; gray = cleared at C2D1). Genes are grouped by pathway (AR axis, tumor suppressor, cell cycle, HRR, other). (B) Frequency of persistent alterations (present at both baseline and C2D1) among progressors, restricted to genes persistent in ≥2 patients; bars colored by pathway. Short variants with tumor-somatic probability >0.80 were retained regardless of functional annotation, including variants of uncertain significance (VUS), and the same criteria were applied at baseline and C2D1, so that all tumor-derived signal contributing to ctDNA persistence was captured.
A. Alteration dynamics in true-positive progressors (Arm B, n = 23)
AR axis | Tumor suppressor | Cell cycle | HRR | Other
Dynamic (baseline → C2D1): Persistent; Emergent; Cleared
B. Persistent alterations (baseline + C2D1) in TP progressors
Genes persistent in ≥2 of 23 patients
AR 15/23 (65%)
TMPRSS2 12/23 (52%)
PTEN 9/23 (39%)
TP53 6/23 (26%)
CTNNB1 3/23 (13%)
FAS 3/23 (13%)
MLL2 3/23 (13%)
MYC 3/23 (13%)
NBN 3/23 (13%)
RAD21 3/23 (13%)
AKT1 2/23 (9%)
AXIN1 2/23 (9%)
BRAF 2/23 (9%)
BRCA2 2/23 (9%)
CARD11 2/23 (9%)
CCNE1 2/23 (9%)
CDKN1B 2/23 (9%)
CIC 2/23 (9%)
EPHB1 2/23 (9%)
HGF 2/23 (9%)
IRS2 2/23 (9%)
PIK3CA 2/23 (9%)
RB1 2/23 (9%)
% of TP progressors with persistent alteration
UroToday.com@urotoday
1) Slide: Treatment options table for high-risk localised, hormone-sensitive (APMS/APMN) · 2) Kaplan-Meier survival data: Overall survival curves from landmark by PSA level · 3) Slide: Sankey diagram of migration between conventional imaging and PSMA PET disease-volume categories
Personalized Systemic Therapy for #mHSPC (APMS/APMN). Presented by @AOmlin. #ESMO26 written coverage by @zklaassen_md > https://t.co/e4yoWvtotg #ProstateCancer @myESMO https://t.co/KpDK8HnAXT
[Slide 2]
High-risk localised / locally advanced or node-positive prostate cancer
*RT + ADT (3 years) + abiraterone (2 yrs)
*RT + ADT + enzalutamide (2 yrs)
*ADT + apalutamide (6 mo) + surgery + ADT + apalutamide (6 mo)
*RT + ADT + darolutamide (24 mo)
Colour code: treatment modality
Hormonal / ARPI
Chemotherapy
Triplet: chemo + ARPI
PARP inhibitor
Radioligand / radium-223
Immunotherapy / targeted therapy
Radiotherapy
* Not EMA approved
Hormone-sensitive prostate cancer HSPC/Androgen pathway modulation-sensitive/naive APMS/APMN
High-risk nmHSPC (EMBARK): enzalutamide ± ADT
ADT + ARPI (abiraterone, apalutamide, darolutamide, enzalutamide)
ADT + docetaxel
ADT + docetaxel + abiraterone or darolutamide
ADT + abiraterone + niraparib (BRCA alteration)
ADT + RT to primary tumour
*ADT + enzalutamide + talazoparib (HRR alteration)
*ADT + ARPI + 177Lu-PSMA-617
*ADT + abiraterone + capivasertib (PTEN deficiency)
Castration-resistant prostate cancer CRPC/Androgen pathway modulation-resistant APMR
High-risk nmCRPC: ADT + enzalutamide, apalutamide or darolutamide
ADT + abiraterone or enzalutamide
ADT + docetaxel or cabazitaxel
ADT + radium-223 (± enzalutamide)
ADT + 177Lu-PSMA-617 or 177Lu-PSMA-I&T
ADT + abiraterone + olaparib or niraparib (BRCA1/2)
ADT + enzalutamide + talazoparib (HRR alteration)
*ADT + checkpoint inhibition (dMMR and/or MSI-high) or targeted therapy in case of a relevant alteration
*Sipuleucel-T (USA)
[Slide 3]
A PSA ≤0.2 ng/mL
B PSA >0.2 to 1.0 ng/mL
C PSA >1.0 to 3.0 ng/mL
D PSA >3.0 ng/mL
MON0 | MON+ | M1LV | M1HV
Overall survival (%)
Time from landmark (months)
Number at risk (censored)
Survival table
Endpoint: Overall survival from landmark
A (PSA ≤0.2): MON0 | 719
A (PSA ≤0.2): MON+ | 417
A (PSA ≤0.2): M1LV | 620
A (PSA ≤0.2): M1HV | 428
B (PSA >0.2–1.0): MON0 | 343
B (PSA >0.2–1.0): MON+ | 207
B (PSA >0.2–1.0): M1LV | 391
B (PSA >0.2–1.0): M1HV | 417
C (PSA >1.0–3.0): MON0 | 189
C (PSA >1.0–3.0): MON+ | 163
C (PSA >1.0–3.0): M1LV | 249
C (PSA >1.0–3.0): M1HV | 269
D (PSA >3.0): MON0 | 125
D (PSA >3.0): MON+ | 104
D (PSA >3.0): M1LV | 294
D (PSA >3.0): M1HV | 776
[Slide 4]
MIGRATION BETWEEN CONVENTIONAL IMAGING AND PSMA PET
Conventional imaging (CI) (CT/MRI + Bone Scan) → PSMA-PET
High-Volume Disease (HVD-CI) n = 17
Low-Volume Disease (LVD-CI) n = 50
94%
22%
48%
30%
High-Volume Disease (HVD-PET) n = 27
Low-Volume Disease (LVD-PET) n = 24
Non-Metastatic Disease (M0-PET) n = 16
UroToday.com@urotoday
1) Slide: ICECaP: conditional cumulative incidence of prostate cancer-specific and all-cause mortality · 2) Slide: ICECaP: conditional 5-year PCSM and ACM by clinical subgroup according to recurrence status at 3 · 3) Slide: ICECaP: trial-level surrogacy R² of RFS/TTR for OS/PCSM in overall, high-risk and age <70 · 4) Slide: ICECaP: trial-level bubble plots of 8-year OS vs 3-year RFS and 8-year PCSM vs 3-year TTR
Early Recurrence after RT as a Surrogate in Localized Prostate Cancer: An ICECaP Analysis. Presented by @ChrisSweens1. #ESMO26 written coverage by @rksayyid > https://t.co/BXTFc8C36S #ProstateCancer #RadOnc #ClinicalTrials @myESMO https://t.co/JPYdFznKVz
[Slide 1]
Figure 1: Conditional adjusted cumulative incidence of outcomes according to recurrence status at 3-years
(A) PCSM
Recurrence
No 5-year PCSM: 2.5% (2.2%,2.7%)
Yes 5-year PCSM: 18% (17%,20%)
PCSM (%)
Years post landmark timepoint
At Risk
(B) ACM
Recurrence
No 5-year ACM: 17% (16%,17%)
Yes 5-year ACM: 34% (32%,35%)
ACM (%)
Years post landmark timepoint
At Risk
Survival table
Endpoint: Prostate cancer-specific mortality (conditional cumulative incidence, landmark at 3 years)
No recurrence at 3 years | 14443
Recurrence at 3 years | 2818
5-year PCSM: No 2.5% (2.2%, 2.7%) vs Yes 18% (17%, 20%)
5-year ACM: No 17% (16%, 17%) vs Yes 34% (32%, 35%)
[Slide 2]
Table 2: Conditional adjusted 5-year PCSM and ACM rates in clinical subgroups, according to recurrence status at 3 years.
Recurrence at 3 years | N | Conditional 5-year PCSM (95% CI) | Conditional 5-year ACM (95% CI)
No. of NCCN high-risk factors
0 factor | No | 8515 | 1.3 (1.1, 1.5) | 15 (15,16)
0 factor | Yes | 1078 | 12 (9.7, 14) | 25 (23,27)
1 factor | No | 3916 | 3.0 (2.6, 3.5) | 17 (16,18)
1 factor | Yes | 851 | 22 (20, 25) | 37 (34,40)
2-3 factors | No | 1959 | 5.3 (4.5, 6.1) | 20 (19,22)
2-3 factors | Yes | 879 | 31 (28, 35) | 46 (43,49)
Planned ADT duration for high-risk disease
None | No | 315 | 2.8 (1.5, 4.5) | 19 (14,23)
None | Yes | 197 | 25 (19, 32) | 40 (33,48)
3-8 months | No | 3233 | 3.4 (2.9,3.9) | 18 (17,20)
3-8 months | Yes | 1152 | 26 (23,28) | 40 (37,43)
≥24 months | No | 2375 | 4.6 (3.9,5.3) | 18 (16,19)
≥24 months | Yes | 391 | 26 (22,30) | 43 (39,48)
Age at randomization
<70 years | No | 7511 | 2.7 (2.4,3.0) | 12 (12,13)
<70 years | Yes | 1558 | 20 (18,22) | 29 (27,32)
≥70 years | No | 6930 | 2.2 (1.8,2.5) | 21 (20,22)
≥70 years | Yes | 1260 | 17 (15,20) | 38 (36,40)
[Slide 3]
Table 3: Summary of trial-level surrogacy in the overall population (25 treatment comparisons), as well as in patients with high-risk disease (22 treatment comparisons, excluding trials with fewer than 50 high-risk patients), and age under 70 years old (24 treatment comparisons, excluding trials with fewer than 50 patients under the age of 70)
Overall population: No. of trials | R2 (95% CI) || High-risk population: No. of trials | R2 (95% CI) || Age <70 years: No. of trials | R2 (95% CI)
A. Non-prostate cancer death as an event
Δ (5-yr OS) on Δ (2-yr RFS) | 25 | 0.09 (0.00,0.33) | 22 | 0.03 (0.00,0.25) | 24 | 0.02 (0.00,0.21)
Δ (8-yr OS) on Δ (3-yr RFS) | 21A | 0.29 (0.02,0.53) | 18A | 0.22 (0.00,0.49) | 20 | 0.06 (0.00,0.31)
Δ (10-yr OS) on Δ (5-yr RFS) | 19B | 0.27 (0.00,0.53) | 16B | 0.12 (0.00,0.42) | 18 | 0.13 (0.00,0.41)
Log (OS HR) on Log (RFS HR) | 25 | 0.30 (0.03,0.53) | 22 | 0.16 (0.00,0.42) | 24 | 0.28 (0.02,0.52)
B. Non-prostate cancer death as a competing risk
Δ (5-yr PCSM) on Δ (2-yr TTR) | 23C | 0.45 (0.12,0.64) | 21C | 0.52 (0.17,0.69) | 23C | 0.39 (0.08,0.60)
Δ (8-yr PCSM) on Δ (3-yr TTR) | 20AC | 0.56 (0.21,0.73) | 18A | 0.51 (0.13,0.70) | 20AC | 0.53 (0.17,0.70)
Δ (10-yr PCSM) on Δ (5-yr TTR) | 18BC | 0. 52 (0.14,0.70) | 16B | 0.48 (0.08,0.69) | 18BC | 0.42 (0.06,0.64)
Log (PCSM HR) on Log (TTR HR) | 23C | 0.38 (0.07,0.60) | 21C | 0.08 (0.00,0.33) | 23C | 0.38 (0.07,0.59)
RFS – relapse-free survival; OS – overall survival; TTR – time to recurrence; PCSM – prostate cancer-specific mortality
A Excluding studies with median follow-up < 6 years; B Excluding studies with median follow-up < 8 years;
C Excluding studies with number of prostate cancer death < 3
[Slide 4]
Figure 2: Bubble plots and regression at the trial level
(A) Difference in 8-year OS on difference in 3-year RFS (Positive value means better outcome in the exp arm)
Difference in 8-year OS
Difference in 3-year RFS
R2 =0.29(95%CI:0.02-0.53)
(B) Difference in 8-year PCSM on difference in 3-year TTR (Negative value means better outcome in the exp arm.
Difference in 8-year PCSM
Difference in 3-year TTR
R2 =0.56(95%CI:0.21-0.73)
UroToday.com@urotoday
1) Trial design schema: ctDNA vs tissue concordance study schema in unselected mCRPC (Edmond Kwan) · 2) Response data: Plasma ctDNA fraction waterfall by tissue biopsy type (fresh vs archival) in mCRPC · 3) Biomarker data: Tissue vs plasma concordance for BRCA1/2 and non-BRCA HRR alterations in mCRPC
Signal, Noise, and Silence – Interpreting Plasma ctDNA in Metastatic #ProstateCancer. Presented by @EdmondMKwan. #ESMO26 written coverage by @zklaassen_md > https://t.co/3XY7mXlYwy #mCRPC #PrecisionOncology https://t.co/rtpCFFZhiR
[Slide 1]
1 unselected mCRPC
Prior to 1L or 2L therapy
2 NGS
Archival tissue
Fresh biopsy
TruSightOncology 500 with TC of >30%
Cell-free DNA
White-blood cells
Custom ctDNA Prostate Panel
Chip-corrected ctDNA
3 Concordance
[Slide 2]
ctDNA ≥20% = 56/174 (32%)
FRESH (n=102)
ARCHIVAL (n=72)
ctDNA fraction %
biopsy
174 (58%) pts with HRR/PI3K pathway alterations
Median ctDNA = 5%
ctDNA <2% = 52/174 (30%)
[Slide 4]
BRCA1/2 mutations | 14 of 15 detected by plasma | +3 (plasma only)
BRCA1/2 biallelic loss | 3 of 6 detected by plasma
Non-BRCA HRR mutations | 29 of 36 detected by plasma | +1 (plasma only)
Legend: Detected in tissue and plasma | Tissue only (plasma miss) | Plasma only (tissue miss)
What proportion of patients with unsuccessful tissue NGS or no tissue could be salvaged with ctDNA?
UroToday.com@urotoday
1) Trial design schema: LuCAB trial design: 177Lu-PSMA plus cabazitaxel phase I dose escalation · 2) Slide: LuCAB results: safety and efficacy of 177Lu-PSMA plus cabazitaxel in mCRPC · 3) Slide: LuCAB poster central graphic: cabazitaxel plus 177Lu-PSMA mechanism and key conclusion in mCRPC
LuCAB: Phase I/II Trial of Cabazitaxel + 177Lu-PSMA in mCRPC. Presented by @LouiseKostos @PeterMacCC. #ESMO26 written coverage by @rksayyid > https://t.co/i8Hsrxm9jd #ProstateCancer #mCRPC #ClinicalTrials @myESMO https://t.co/C8nbD07G8n
[Slide 1]
TRIAL DESIGN
35 patients treated in total
Key eligibility
• Progressive mCRPC
• PSMA-PET positive disease (SUVmax ≥15) with no discordance on FDG-PET
• Prior exposure to docetaxel and ≥1 androgen receptor pathway inhibitor
• Adequate bone marrow, renal and hepatic function
• ECOG performance status 0-1
Phase I | 15 patients | 3+3 design Dose escalation
Up to 6 cycles
177Lu-PSMA 7.4 GBq IV 6 weekly
+ cabazitaxel Up to 12 doses IV 3-weekly
Prophylactic G-CSF given after each dose
First dose of cabazitaxel one day after 177Lu-PSMA
4 planned dose levels: 12.5 mg/m² (n=3); 15 mg/m² (n=3); 17.5 mg/m² (n=3); 20 mg/m² (n=6)
No dose-limiting toxicity
cabazitaxel RP2D: 20 mg/m²
Phase II | 20 patients | Dose expansion
Recruitment completed: Feb. 2025
Up to 6 cycles
177Lu-PSMA 7.4 GBq IV 6 weekly
+ cabazitaxel IV 3-weekly 20 mg/m²
Prophylactic G-CSF given after each dose
[Slide 2]
RESULTS
Median follow-up: 20.4 months
Safety analysis: n=34 • Efficacy analysis: n=26 (RP2D cohort)
71% had de novo metastatic disease
29% had M1c disease at baseline
No dose-limiting toxicities
24% experienced clinically significant Grade ≥3 treatment-related adverse events
• neutropaenia (n=2)
• anaemia (n=2)
• weight loss (n=1)
• diarrhoea (n=1)
• fatigue (n=1)
• urinary tract infection (n=1)
• No deaths
PSA50-RR 73% [95% CI 54 – 86]
PSA90-RR 42% [95% CI 26 – 61]
Median PSA-PFS 8.5 months [95% CI 4.8 – 12.1]
Radiographic PFS 10.9 months [95% CI 10.2 – 13.4]
Overall Survival 16.5 months [95% CI 13.4 – 21.8]
[Slide 3]
The combination of cabazitaxel and 177Lu-PSMA is feasible and safe in heavily pre-treated patients with mCRPC, with encouraging anti-tumour activity.
Cabazitaxel
treats both PSMA-positive and PSMA-negative cells
radiosensitises cells
177Lu-PSMA
β- particles
Cell cycle: G0 phase (resting), G1, S, G2, M
The findings support further evaluation in a randomised clinical trial.
Sponsor: Pet[er MacCallum Cancer Centre]
PSMA-617 was supplied by [...]
UroToday.com@urotoday
Trial design schema: ARASEC vs CHAARTED propensity-matched study design (darolutamide + ADT in mHSPC)
Darolutamide + ADT in Patients with #mHSPC by Disease Volume: Subgroup Analyses from the Phase 2 #ARASEC Study. Presented by Neal Shore, MD, FACS @TheSTARTCenter. #ESMO26 written coverage by @zklaassen_md > https://t.co/wMGlr1xJto @myESMO https://t.co/ozKHqimDrt
Darolutamide 600 mg BID + ADT
ARASEC match-eligible population (N=223)
ADT
CHAARTED match-eligible population (N=393)*
Key eligibility
- mHSPC
- ECOG performance status 0-2
- ADT started <=120 days before enrollment
- No prior chemotherapy or hormone therapy
1:1 propensity score matching with a caliper (maximum difference between scores) of 0.1
[Illustration: score pairs 0.25 vs 0.52 (rejected, X); 0.10 vs 0.12 (matched, check)]
Propensity scores calculated from prognostic baseline variables
- Age (<68 years, >=68 years)
- ECOG performance status (0, >0)
- Extent of disease (high volume with visceral metastases, high volume without visceral metastases, low volume)
- Prior local therapy (yes/no, proxy for recurrent vs de novo disease)
- Gleason score (<8, >=8, unknown)
- Baseline PSA (<=10 ng/mL, >10 ng/mL)
ARASEC matched population (n=160)
CHAARTED matched population (n=160)
Outcomes
Primary endpoint
- PFS
Secondary endpoints
- OS
- Time to mCRPC
- rPFS
- PSA <0.2 ng/mL response rate
- Safety(dagger)
Median follow-up
Darolutamide arm: 26 months
CHAARTED-matched arm: 28 months
UroToday.com@urotoday
1) Trial design schema: Comparison table of 177Lu-PSMA vs radium-223 in bone-dominant mCRPC · 2) Slide: Baseline characteristics table, 177Lu-PSMA vs radium-223 real-world cohort, unweighted · 3) Kaplan-Meier survival data: Overall survival before and after sIPTW weighting, 177Lu-PSMA
Bone-dominant #mCRPC: OS after 177Lu-PSMA vs Radium-223 in a Real-World Cohort. Presented by Dr. Jacqueline van Hees, MD. #ESMO26 written coverage by @chavarriagaj > https://t.co/fReE2PsHun #ProstateCancer @myESMO https://t.co/BljJ82qVMv
[Slide 1]
[177Lu]Lu-PSMA | [223Ra]RaCl2
Target | All PSMA-positive metastasis | Bone metastasis only
Treatment | 4-6 cycles of 6 weeks | 6 cycles of 4 weeks
Patient impact | ↑ | ↓
Cost | ↑ | ↓
Phase III studies (median OS in months) | VISION (2021) After taxane and ARPI 11.3 → 15.3 | ALSYMPCA (2013) Pre-ARPI, pre-PSMA PET era 11.3 → 14.9
OS = overall survival
[177Lu]Lu-PSMA
[223Ra]RaCl2
[Slide 2]
Unweighted | Weighted
Characteristic | [177Lu]Lu-PSMA | [223Ra]RaCl2 | SMD | SMD
Age, years | 72.6 ± 8.0 | 71.9 ± 8.3 | 0.08 | 0.14
ECOG performance status ≥2 | 28.3% | 8.5% | 0.58 | 0.23
Gleason score ≥9 | 48.3% | 34.9% | 0.37 | 0.19
>6 bone metastases | 81.5% | 89.2% | 0.49 | 0.08
Lymphadenopathy (≥1cm) | 51.1% | 26.9% | 0.51 | 0.07
PSA (µg/L) | 606.8 ± 1023.8 | 245.8 ± 556.9 | 0.44 | 0.04
ALP (U/L) | 293.4 ± 457.7 | 225.2 ± 277.5 | 0.18 | 0.16
Haemoglobin (mmol/L) | 7.4 ± 1.0 | 7.7 ± 1.0 | 0.38 | 0.06
LDH (U/L) | 339.7 ± 429.1 | 283.2 ± 218.5 | 0.166 | 0.05
Previous treatments ≥4 | 16.3% | 5.9% | 0.88 | 0.37
SMD = standardised mean difference, ECOG = Eastern Cooperative Oncology Group, PSA = prostate specific antigen, ALP = alkaline phosphatase, LDH = lactate dehydrogenase
[Slide 3]
Overall survival before and after sIPTW weighting:
Left panel: Median (months) [177Lu]Lu-PSMA 8.9; [223Ra]RaCl2 12.9; HR = 1.27 (95% CI 0.95 - 1.70); p = 0.11
Right panel: Median (months) [177Lu]Lu-PSMA 12.6; [223Ra]RaCl2 11.2; HR = 0.97 (95% CI 0.66 - 1.44); p = 0.89
Overall survival probability (%)
Time (months)
Number at risk
Weighed number at risk
CONCLUSIONS
Survival table
Endpoint: Overall survival (real-world, before and after sIPTW weighting)
[177Lu]Lu-PSMA (unweighted) | 92 | 8.9 months
[223Ra]RaCl2 (unweighted) | 323 | 12.9 months
[177Lu]Lu-PSMA (sIPTW-weighted) | 75.4 (weighted) | 12.6 months
[223Ra]RaCl2 (sIPTW-weighted) | 315 (weighted) | 11.2 months
HR: Unweighted 1.27; weighted 0.97
HR CI: Unweighted 0.95 - 1.70; weighted 0.66 - 1.44
P: Unweighted 0.11; weighted 0.89
UroToday.com@urotoday
1) Kaplan-Meier survival data: CCTG PR21: Primary endpoint rPFS (ITT), 177Lu-PSMA-617 vs docetaxel · 2) Slide: CCTG PR21: FACT-P domain numerical scores, Lu-PSMA vs docetaxel (bar chart) · 3) Slide: CCTG PR21: Mean change from baseline in FACT-G and Physical Well Being over 36 weeks
Patient Reported QoL for Docetaxel vs 177Lu-617-PSMA for #mCRPC: Results from the Canadian Cancer Trials Group PR21 Trial. Presented by @DKhalafMD. #ESMO26 written coverage by @zklaassen_md > https://t.co/9HfEysej0x #ProstateCancer #ClinicalTrials @myESMO https://t.co/Y6KqtcRT4S
[Slide 1]
Primary Endpoint: rPFS (ITT)
HR: 1.01 (90% CI: 0.77, 1.31); 1-sided p = 0.51
177Lu-PSMA-617: median 8.6 months (90% CI: 7.1, 10.6)
Docetaxel: median 10.7 months (90% CI: 7.8, 11.1)
rPFS Probability
Time in Months
Number at risk (months 0, 6, 12, 18, 24, 30)
Docetaxel: 99 59 27 7 3 1
177Lu-PSMA-617: 100 56 25 10 2 2
Survival table
Endpoint: rPFS (ITT), primary endpoint
Arm | N | Median | Median CI
177Lu-PSMA-617 | 100 | 8.6 months | 90% CI 7.1-10.6
Docetaxel | 99 | 10.7 months | 90% CI 7.8-11.1
HR: 1.01
HR CI: 90% CI 0.77-1.31
P: 1-sided p = 0.51
[Slide 4]
FACT-G
* Indicates p<0.05
Mean change from baseline
Weeks: 6 12 18 24 30 36
Legend: LuP | Doc
[* markers at weeks 12, 24, 30, 36]
Physical Well Being
Weeks: 6 12 18 24 30 36
Legend: LuP | Doc
[* markers at weeks 24, 30]
UroToday.com@urotoday
1) Mechanism of action: Ixotatug vedotin (Ixo-V) CLDN6-targeted ADC mechanism of action schematic · 2) Slide: CLDN6 mRNA expression across tumor types (TORL-1-23 background, ESMO 2026)
TORL-1-23: Safety and Efficacy of Ixotatug Vedotin, a Claudin 6-Targeted ADC, as Monotherapy in Germ Cell Tumors. Presented by @DrDarrenFeldman @MSKCancerCenter. #ESMO26 written coverage by @zklaassen_md > https://t.co/HKosJjJFti #TesticularCancer #GermCellTumors #ClinicalTrials @myESMO
[Slide 1]
Ixo-V
CLDN6
endocytosis
MMAE payload released
CANCER CELL
Apoptosis
[Slide 2]
CLDN6 mRNA Expression Across Tumor Types^2
Log(FKPM)-RNA-seq
AML n=173 | Large B-cell lymphoma n=48 | Prostate cancer n=550 | Melanoma n=474 | Colon cancer n=329 | Rectal cancer n=105 | Bladder cancer n=426 | Liver cancer n=423 | Kidney clear cell carcinoma n=606 | Breast cancer n=1218 | Cervical squamous cell carcinoma n=308 | Head and neck cancer n=566 | Kidney chromophobe n=91 | Sarcoma n=265 | Lower grade glioma n=530 | Adrenocortical carcinoma n=92 | Glioblastoma n=172 | Kidney papillary cell carcinoma n=323 | Lung squamous cell carcinoma n=533 | Esophageal cancer n=198 | Thymoma n=122 | Stomach adenocarcinoma n=450 | Cholangiocarcinoma n=45 | Thyroid carcinoma n=572 | Lung adenocarcinoma n=576 | Pancreatic cancer n=183 | Endometrioid cancer n=201 | Uterine carcinosarcoma n=57 | Ovarian cancer n=308 | Testicular cancer n=156 (highlighted)
UroToday.com@urotoday
1) Slide: Patient flow: LuPSMA-treated mCRPC patients included for retreatment vs other subsequent therapy · 2) Slide: Pie chart of other subsequent therapies following initial LuPSMA in mCRPC · 3) Slide: Outcomes of LuPSMA retreatment vs other subsequent systemic therapy after progression on LuPSMA
LuPSMA Retreatment and Other Subsequent Therapies After Progression on LuPSMA in #mCRPC. Presented by @SpainLavinia @PeterMacCC. #ESMO26 written coverage by @rksayyid @UAUrology > https://t.co/FAjZQtgzsH #ProstateCancer @myESMO https://t.co/8wTzWEcfxe
Baseline Characteristics
• As of July 14, 2026, a total of 26 patients with untreated IMDC Favorable-Risk advanced RCC were enrolled
Characteristic | Patients, N=26 (%)
Age, median(range), years | 56.5 (44-80)
Male | 23 (88.5%)
ECOG PS |
0 | 25 (96.2%)
1 | 1 (3.8%)
IMDC risk category |
Favorable | 26 (100.0%)
PD-L1 expression (CPS) |
CPS ≥1 | 4 (15.4%)
CPS <1 | 11 (42.3%)
Unknown | 11 (42.3%)
Number of metastatic sites, n (%) |
≥2 metastatic sites | 11 (42.3%)
History of Prior Nephrectomy |
Yes | 26 (100.0%)
[Jun] Guo, MD
UroToday.com@urotoday
Slide: Survival proportion in ADGC phase 1 by polygenic hazard score (PHS) quartile - AFT-47 background figure
Genetic Dementia Risk and AR Therapy-Associated Cognitive Effects: AFT-47 Darolutamide vs Enzalutamide. Presented by @charlesryanmd @MSKCancerCenter. #ESMO26 written coverage by @zklaassen_md > https://t.co/Ov7TYSL4SU @myESMO #ProstateCancer #GUOnc https://t.co/Z61JZIxcge
1) Slide: mCRPC genomic profiling cohort: patient and sample overview, ethnicity distribution and NGS · 2) Slide: mCRPC alteration prevalence by ethnicity: TP53, PTEN, RB1, AVPC-m and BRCA1/2 · 3) Slide: mCRPC HRD (non-BRCA) alterations by ethnicity: ATM, CDK12, CHEK2, PALB2, RAD54L, BRIP1
Actionable Genomic Alterations, TMB, and ctDNA Fraction by Ethnicity and Tissue–ctDNA Concordance in #mCRPC. Presented by Dr. Virginia Yuk-Chun Lam @GSTTnhs. #ESMO26 written coverage by @rksayyid @UAUrology > https://t.co/CkRsyFP9Yd #ProstateCancer #PrecisionOncology @myESMO https://t.co/OxIAva2QHx
[Slide 1]
PATIENT AND SAMPLE OVERVIEW
349 patients
553 NGS reports
69 Median age
22.6% Tissue failure rate
5.3% ctDNA failure rate
Ethnicity distribution
White 235 (67%)
Black 67 (19%)
†Other / mixed / not specified 47 (14%)
†Includes South Asian, East Asian, mixed, other ethnic group, and not specifie[illegible]
NGS reports by assay platform
ctDNA (N = 319)
FoundationOne Liquid AB1 159 (50%)
FoundationOne Liquid CDx 131 (41%)
Guardant360 29 (9%)
Tissue (N = 234)
FoundationOne CDx 182 (78%)
OncoPlex 52 (22%)
FoundationOne Liquid AB1: TRITON3. FoundationOne Liquid CDx: TRITON2, GSTT ctDNA Pilot Project, TARGET. Guardant360: free kits/self-payers. FoundationOne CDx: TRITON3, TRITON2. OncoPlex: NEPTUNES.
[Slide 2]
Alteration prevalence (%) by ethnicity
White Black Others
% of patients
TP53: White 103 (43.8%) | Black 23 (34.3%) | Others 19 (40.4%)
PTEN: White 47 (20.0%) | Black 13 (19.4%) | Others 6 (12.8%)
RB1: White 13 (5.5%) | Black 4 (5.9%) | Others 6 (12.8%)
AVPC-m: White 24 (10.2%) | Black 11 (16.4%) | Others 8 (17.0%)
BRCA1/2: White 16 (6.8%) | Black 8 (11.8%) | Others 4 (8.5%)
Labels show n and %. Patient-level, tissue/ctDNA combined (White n=235, Black n=67, Others n=47).
[Slide 3]
HRD (non-BRCA) alterations breakdown by ethnicity
White Black Others
% of patients
ATM: White 29 (12%) | Black 5 (7%) | Others 5 (11%)
CDK12: White 9 (4%) | Black 6 (9%) | Others 4 (9%)
CHEK2: White 14 (6%) | Black 2 (3%) | Others 1 (2%)
PALB2: White 0 (0%) | Black 1 (1.5%) | Others 1 (2%)
RAD54L: White 1 (0.4%) | Black 1 (1.5%) | Others 0 (0%)
BRIP1: White 0 (0%) | Black 1 (1.5%) | Others 0 (0%)
Labels show n and %. Patient-level, tissue/ctDNA combined (White n=235, Black n=67, Others n=47).
UroToday.com@urotoday
1) Trial design schema: ctDNA correlates of resistance to 177Lu-PSMA-617: study schema and endpoint · 2) Biomarker data: Baseline ctDNA tumor fraction is prognostic (OS by TF >2%; Figure 2) · 3) Slide: Integrated analysis of PSA, tumor fraction and AR binding sites during LuPSMA treatment (Figure 3) · 4) Slide: Genomic alterations associated with resistance to LuPSMA: odds-ratio forest table
ctDNA as Correlates of Intrinsic and Acquired Resistance to 177Lu-PSMA-617 in #mCRPC. Presented by @aloktewar @DanaFarber. #ESMO26 written coverage by @chavarriagaj @PSH_Urology > https://t.co/lt2DzN2gAl @myESMO #ProstateCancer #PrecisionOncology https://t.co/DVVVruWdC5
[Slide 1]
LuPSMA treatment cycles
C1 C2 C3 C4 C5 C6
C1D1 (n=63) C3D1 (n=50) PD (n=41)
PredicineCARE: Targeted NGS: SNVs, CNVs, fusions
PredicineSCORE: LP-WGS: CNB score, tumor fraction (TF), ARBS nucleosome profiling
Figure 1. Study schema and ctDNA assays.
Endpoint | Definition | n / N
PSA90 response | Best PSA decline >90% | 17 / 72
Exceptional response | PSA90 or OS >18 mo | 24 / 72
Intrinsic resistance | Clinical/radiographic PD ≤3 mo or OS ≤9 mo | 25 / 72
Acquired resistance | PD after 3 mo | 54 / 72
[caption below table cut off]
[Slide 2]
Baseline ctDNA tumor fraction is prognostic
Combo TF > 2%: High / Low
[KM curve: Survival probability vs Months]
p < 0.0001
Number at risk (TF > 2%) (0, 12, 24 months)
High 46 15 2
Low 17 9 5
Exceptional Responder — Combo TF — Wilcoxon P = 0.000127; FALSE mean = 0.334 [partially obscured]; TRUE mean = 0.0753 [partially obscured]
Intrinsic Resistance — Combo TF — Wilcoxon P = 1.66e-05; FALSE mean = 0.151; TRUE mean = 0.406
Continuous TF | HR* | P
OS | 25.6 | 2.6×10^-6
CR-PFS | 6.5 | 2.3×10^-4
PSA-PFS | 6.4 | 5.3×10^-4
Figure 2. (Left) OS by baseline TF >2% vs ≤2%. (Right) Baseline combo TF by response group (Wilcoxon). *Cox HR per unit TF (0–1).
Survival table
Endpoint: OS by baseline ctDNA tumor fraction (>2% vs ≤2%)
TF >2% (High) | 46
TF ≤2% (Low) | 17
P: <0.0001
[Slide 3]
Integrated Analysis of PSA, tumor fraction and AR binding sites during LuPSMA treatment
A All samples (n=154) — High risk / Low risk
R = 0.81
CNV-inferred TF vs ARBS abnormality score
B Patient 54 / C Patient 55 — C1D1, C3D1, Normal cfDNA, PD
Fragment coverage vs Distance from ARBS (bp)
D PSA | Tumor fraction | ARBS abnormality score — Pt 54 (C1D1–C6D1; C1D1, C3D1, PD), Pt 55 (C1D1–C4D1; C1D1, C3D1, PD)
Figure 3. (A) ARBS abnormality score vs CNV-inferred TF (R=0.81); samples classified by copy number burden. (B, C) ARBS nucleosome depletion at C1D1, reduced at C3D1, regained at PD. (D) PSA, TF and ARBS over time.
Pablo Sanchis@PblSanchis
Slide: Poster 394P: Transcriptomic characterization of baseline immune programs in BCG-treated NMIBC (Sanchis)
#ESMO26 poster session on basic science has kicked off! Happy to share our transcriptomics data charcaterizing the immunological profile during #BCG failure in #NMIBC @iquibicen @HospItalBA @FedericoCayol @ggueron https://t.co/eERlsPCpsM
394P
TRANSCRIPTOMIC CHARACTERIZATION OF BASELINE IMMUNE PROGRAMS IN BCG-TREATED NON-MUSCLE INVASIVE BLADDER CANCER
Pablo Sanchis1,2*, Rocío Solberg2, Ivan Macharashvili3, Agustina Sabater2,4, Hernán García Rivello5, Geraldine Gueron1, Federico Cayol3
1 Department of Biological Chemistry, IQUIBICEN (UBA-CONICET), Buenos Aires, Argentina; 2 Universidad Argentina de la Empresa (UADE), Instituto de Tecnología (INTEC), Buenos Aires, Argentina; 3 Department of Oncology, Hospital Italiano de Buenos Aires, Buenos Aires, Argentina; 4 Department of Genitourinary Medical Oncology, MD Anderson Cancer Center, Houston, United States of America; 5 Department of Pathology, Hospital Italiano de Buenos Aires, Buenos Aires, Argentina. *Contact: pabloasanchis@gmail.com
[Logos: IQUIBICEN, Hospital Italiano de Buenos Aires, UADE, International Cancer Foundation, ESMO]
1. BACKGROUND & RATIONALE
High Clinical Burden of BCG Failure:
Intravesical Bacillus Calmette–Guérin (BCG) immunotherapy is the established standard-of-care for high-risk non–muscle invasive bladder cancer (NMIBC). However, up to 50% of patients experience recurrence or progression, frequently requiring radical cystectomy.
Unmet Need for Predictive Biomarkers:
There are currently no validated baseline biomarkers to identify tumors inherently resistant to BCG prior to treatment initiation.
Study Hypothesis & Objective:
We hypothesized that baseline primary NMIBC tumors harbor pre-existing transcriptomic and immunological rewiring that dictates therapeutic failure prior to BCG exposure.
2. METHODOLOGICAL WORKFLOW
Phase 1: Multi-Cohort Harmonization & Quality Control
Transcriptomics datasets (GSE13507, GSE176178, GSE224248) were downloaded from Gene Expression Omnibus. Patient clinical annotations were standardized for recurrence, progression, and BCG response.
Phase 2: Differential Expression & Pathway Scoring (GSVA & GSEA)
Differential gene expression was performed. Gene Set Variation Analysis (GSVA) and GSEA evaluated functional activity across 10,488 GO Biological Processes, KEGG, and HALLMARK pathways.
Phase 3: Immune Microenvironment Deconvolution & Subtyping
xCell algorithms quantified 64 immune and stroma cell types. Unsupervised hierarchical clustering and PCA identified distinct pre-treatment resistance phenotypes among BCG non-responders.
3. SUMMARY TABLE OF ANALYZED COHORTS
Dataset | Total (n) | BCG (n) | Recur. | Prog. | BCG Resp. | RFS | PFS | OS
GSE13507 | 256 | 56 | Yes | Yes | No | No | No | Yes
GSE176178 | 44 | 44 | No | No | Yes | No | No | No
GSE224248 | 49 | 49 | No | Yes | No | No | Yes | No
E-MTAB | 476 | 88 | No | Yes | No | Yes | Yes | Yes
BRS Cohort | 327 | 132 | Yes | Yes | No | [illegible] | [illegible] | [illegible]
The presenting author declares no conflict of interest related to this work. | ESMO 2026 Congress, Madrid, Spain
4. BASELINE TRANSCRIPTIONAL DYSREGULATION
[Volcano plot: Baseline Differential Gene Expression (BCG Recurrent vs Non-Recurrent); Venn diagram, overlap 45; functional category table - small text largely illegible]
Figure 1. Baseline transcriptional dysregulation in BCG-recurrent tumors. (A) Baseline Differential Gene Expression (Volcano Plot): Differential gene expression in pre-treatment primary NMIBC tumors comparing patients who subsequently recurred following BCG vs. non-recurrent controls in GSE13507 (n = 56). (B) Venn's diagram showcasing common genes significantly deregulated in the GSE13507 and GSE176178 datasets. Significant upregulation of key inflammatory, hypoxia, and metabolic mediators (including MARCO, CSF1, VEGFA, S100A12, HMOX1, HK2, and MTHFD2; P < 0.05, log2 fold change > 0.5) indicates coordinated baseline molecular rewiring in recurrent tumors at the time of diagnosis.
5. UNSUPERVISED PATHWAY SUBTYPING (GSVA)
[Heatmap; GSVA boxplots: Antigen processing and presentation of peptide antigen via MHC class I; Natural Killer cell activation involved in immune response; GSEA T cell activation pathway NES = -1.49, p = 0.00229 (small, partly legible)]
Figure 2. Baseline immune suppression in BCG-recurrent tumors. (A) Heatmap showcasing an unsupervised clustering analysis based on the enrichment levels of biological pathways profiled using GSVA. (B) Normalized GSVA enrichment scores in non-recurrent and recurrent tumors from the GSE13507 dataset. (C) GSEA plot illustrating significant downregulation of the T Cell Activation Pathway prior to BCG treatment in patients that subsequently recurred (NES = [illegible] normalized enrichment score). * P < 0.05.
6. BIOLOGICAL HETEROGENEITY [partly obscured by presenter]
[PCA plot and heatmap, obscured]
[Presenter Pablo Sanchis standing beside poster, ESMO badge 'Poster Presenter']
UroToday.com@urotoday
1) Trial design schema: POTOMAC study design and primary endpoint DFS (ITT), De Santis · 2) Kaplan-Meier survival data: POTOMAC DFS in papillary-only and T1 subsets · 3) Kaplan-Meier survival data: POTOMAC cystectomy-free survival, papillary only and T1
Durvalumab + BCG in BCG-Naïve High-Risk NMIBC: Recurrence and Cystectomy-Free Survival in Papillary-Only Tumours From POTOMAC. Presented by Dr. Maria De Santis, #ESMO26 written coverage by @chavarriagaj > https://t.co/vAbuqZFcBf #BladderCancer #NMIBC #Immunotherapy https://t.co/GeRDD0LFEL
[Slide 1]
POTOMAC: Study Design and Primary Endpoint
Durvalumab + BCG (I+M) reduced the risk of high-risk disease recurrence or death by 32% in the ITT population1
1018 patients with BCG-naive, high-risk NMIBC -> R 1:1:1
D+BCG (I+M) N=339: Durvalumab 1500 mg IV (Q4W × 13 cycles); BCG Induction Weekly × 6 weeks; BCG Maintenance 3 weekly doses at 3m 6m 12m 18m 24m
D+BCG (I only) N=339: Durvalumab 1500 mg IV (Q4W × 13 cycles); BCG Induction Weekly × 6 weeks
BCG (I+M) N=340: BCG Induction Weekly × 6 weeks; BCG Maintenance 3 weekly doses at 3m 6m 12m 18m 24m
First patient enrolled: June 2018 | Last patient enrolled: October 2020 | Last D dose: January 2022 | Last BCG dose: January 2023 | Data cutoff: 03 April 2025
Primary endpoint: Disease-free survival
D+BCG (I+M) N=339 | BCG (I+M) N=340
Events, n (%): 67 (20) | 98 (29)
Median DFS, months (95% CI): NR (NR–NR) | NR (74.0–NR)
Landmarks (12/24/36/48 months): D+BCG 92% / 87% / 82% / 80%; BCG 87% / 82% / 77% / 75%
HR 0.68 (95% CI, 0.50–0.93)
Stratified log-rank P value = 0.0154
No. of patients at risk: [illegible at this resolution]
Median follow-up: 60.7 months
For additional information, please refer to: De Santis M, et al. Lancet. 2025;406:2221–2234.
Survival table
Endpoint: Disease-free survival (primary), ITT
Arm | N | Median | Median CI
D+BCG (I+M) | 339 | NR | NR–NR
BCG (I+M) | 340 | NR | 74.0–NR
HR: 0.68
HR CI: 0.50–0.93
P: 0.0154 (stratified log-rank)
Landmark rates:
12 months: D+BCG (I+M) 92% | BCG (I+M) 87%
24 months: D+BCG (I+M) 87% | BCG (I+M) 82%
36 months: D+BCG (I+M) 82% | BCG (I+M) 77%
48 months: D+BCG (I+M) 80% | BCG (I+M) 75%
[Slide 2]
POTOMAC: Disease-Free Survival in Patients With Papillary Only and With T1 Tumours
D+BCG (I+M) showed a consistent benefit across papillary only and T1 subgroups
Papillary only (64%–65% of ITT population)a,b,1
D+BCG (I+M) N=217 | BCG (I+M) N=220
Number of events, n (%): 37 (17) | 65 (30)
Median DFS, months (95% CI): NR (NR–NR) | NR (74.0–NR)
Median follow-up in censored patients: 60.7 months
Landmarks (24/36/48 months): D+BCG 87% / 84% / 84%; BCG 81% / 76% / 74%
HR 0.56 (95% CI, 0.37–0.84)
T1 subset of papillary only (40%–43% of ITT population)c,d
D+BCG (I+M) N=137 | BCG (I+M) N=145
Number of events, n (%): 22 (16) | 45 (31)
Median DFS, months (95% CI): NR (NR–NR) | NR (69.3–NR)
Median follow-up in censored patients: 60.7 months
Landmarks (24/36/48 months): D+BCG 88% / 85% / 85%; BCG 79% / 75% / 73%
HR 0.48 (95% CI, 0.28–0.79)
No. of patients at risk: [illegible at this resolution]
Survival table
Endpoint: DFS, papillary-only and T1 subsets
Arm | N | Median | Median CI
D+BCG (I+M) papillary only | 217 | NR | NR–NR
BCG (I+M) papillary only | 220 | NR | 74.0–NR
D+BCG (I+M) T1 | 137 | NR | NR–NR
BCG (I+M) T1 | 145 | NR | 69.3–NR
HR: 0.56 (papillary only); 0.48 (T1)
HR CI: 0.37–0.84; 0.28–0.79
Landmark rates:
24 months: D+BCG papillary only 87% | BCG papillary only 81% | D+BCG T1 88% | BCG T1 79%
36 months: D+BCG papillary only 84% | BCG papillary only 76% | D+BCG T1 85% | BCG T1 75%
48 months: D+BCG papillary only 84% | BCG papillary only 74% | D+BCG T1 85% | BCG T1 73%
[Slide 4]
POTOMAC: Cystectomy-Free Survival in Patients With Papillary Only and With T1 Tumours
Cystectomy-free survival showed a favourable trend for D+BCG (I+M) vs BCG (I+M)a
Papillary only
D+BCG (I+M) N=217 | BCG (I+M) N=220
Total events, n (%): 31 (14) | 52 (24)
Median CFS, months (95% CI): NR (NR–NR) | NR (78.3–NR)
HR 0.59 (95% CI, 0.38–0.92)
T1
D+BCG (I+M) N=137 | BCG (I+M) N=145
Total events, n (%): 18 (13) | 39 (27)
Median CFS, months (95% CI): NR (NR–NR) | 78.3 (78.3–NR)
HR 0.45 (95% CI, 0.25–0.78)
No. of patients at risk: [illegible at this resolution]
Survival table
Endpoint: Cystectomy-free survival, papillary-only and T1 subsets
Arm | N | Median | Median CI
D+BCG (I+M) papillary only | 217 | NR | NR–NR
BCG (I+M) papillary only | 220 | NR | 78.3–NR
D+BCG (I+M) T1 | 137 | NR | NR–NR
BCG (I+M) T1 | 145 | 78.3 | 78.3–NR
HR: 0.59 (papillary only); 0.45 (T1)
HR CI: 0.38–0.92; 0.25–0.78
UroToday.com@urotoday
1) Response data: Nectin-4 [68Ga]-N188 vs FDG PET: SUVmax and TBR correlation scatter plots · 2) Slide: Nectin-4 [68Ga]-N188 vs FDG PET: sensitivity, specificity, PPV and NPV for T, N and M staging · 3) Slide: Case presentation: [18F]-FDG PET/CT vs [68Ga]-N188 PET/CT images in urothelial carcinoma
Nectin-4-Targeted [68Ga]-N188-PET/CT vs [18F]-FDG-PET/CT for Staging Locally Advanced and Metastatic Urothelial Carcinoma. Presented by @E_Laukhtina @MedUni_Wien. #ESMO26 written coverage by @rksayyid @UAUrology > https://t.co/7pJEdsVWQp #UrothelialCancer #BladderCancer @myESMO https://t.co/b45ocAuiLe
[Slide 1]
Figure 1. SUVmax: N188 vs FDG by lesion site
T (Primary tumor)
Spearman r=-0.096
p=0.695, n=19
95% CI [-0.53, 0.37]
N (Lymph nodes)
Spearman r=0.657
p<0.001, n=76
95% CI [0.51, 0.77]
M (Visceral)
Spearman r=0.210
p=0.148, n=49
95% CI [-0.08, 0.46]
Bone (Osseous)
Spearman r=-0.001
p=0.994, n=33
95% CI [-0.34, 0.34]
Axes: Nectin4 SUVmax / FDG SUVmax
Figure 2. TBR (SUVmax/BP): N188 vs FDG by lesion site
T (Primary tumor)
Spearman r=0.058
p=0.820, n=18
95% CI [-0.42, 0.51]
N (Lymph nodes)
Spearman r=0.635
p<0.001, n=76
95% CI [0.48, 0.75]
M (Visceral)
Spearman r=0.466
p<0.001, n=49
95% CI [0.21, 0.66]
Bone (Osseous)
Spearman r=0.298
p=0.092, n=33
95% CI [-0.05, 0.58]
Axes: Nectin4 TBR (SUVmax/BP) / FDG TBR (SUVmax/BP)
Lines: OLS fit with 95% CI band, for visualisation only; statistics are Spearman rank-based.
[Slide 3]
Figure 4. Case presentation: [18F]-FDG (a-c) vs [68Ga]-N188 (d-f)
[18F]-FDG-PET/CT
[68Ga]-N188-PET/CT
a b c d e f
SWOG S2200: Cabozantinib with or Without Atezolizumab in Metastatic Papillary RCC. Presented by @maughanonc @huntsmancancer. #ESMO26 written coverage by @rksayyid @UAUrology > https://t.co/pKI9b5a6iH #KidneyCancer #RCC #Immunotherapy @myESMO @SWOG https://t.co/zZlN5nKuRX
Response data: TheraPb waterfall plots: best PSA response (N=22) and best target-lesion change by BICR
Updated Results from the TheraPb Trial Defining the Recommended Phase 2 Dose of 212Pb-ADVC001 in PSMA-Positive #mCRPC. Presented by Aaron Hansen, MBBS, FRACP. #ESMO26 written coverage by @zklaassen_md > https://t.co/byxKjjmoHk #mCRPC #ClinicalTrials @myESMO https://t.co/nPAjdCCcJs
Figure 3a: Best PSA response as percentage change from baseline in all pts (N = 22)
Best percentage change from baseline PSA
PSA50
60 MBq (Q6W) | 120 MBq (Q4W) | 160 MBq (Q4W, Q2W) | 200 MBq (Q4W, Q2W, Q1W)
Figure 3b: Best percentage change in target lesion sum of diameters from baseline in RECIST-evaluable pts (n = 6), by BICR
cPR -42% | cPR -67% | cPR -77% | uCR -82% | cCR -100% | uCR [a]
Best percentage change in SOD from baseline
PD
PR
CR
200 MBq (Q4W, Q2W, Q1W) | 160 MBq (Q4W, Q2W) | 120 MBq (Q4W)
UroToday.com@urotoday
Slide: EV-309 poster: map of active and planned study sites
EV-309: An Open-Label, Randomized, Phase 3 Study of Enfortumab Vedotin + Pembrolizumab for Bladder Preservation in Patients with #MIBC. Presented by @MattGalsky @TischCancer. #ESMO26 written coverage by @zklaassen_md > https://t.co/gIMbygQUww @myESMO https://t.co/MANK5Vu3by
[World map of study sites] Legend: Active (dark blue) - United States, Canada, South Korea; Planned (light blue) - Brazil, Argentina, United Kingdom, France, Spain, Italy, Germany/central Europe, Turkey, China, Japan [country shading approximate, read from map]
Active
Planned
UroToday.com@urotoday
1) Slide: DLL3 PET case: Patient 9 intrapatient DLL3 heterogeneity (DLL3, FDG, PSMA PET) · 2) Slide: DLL3 PET case: Patient 13 DLL3 PET-guided biopsy in prostate adenocarcinoma
DLL3 PET Identifies Neuroendocrine Differentiation and Tumor Heterogeneity in Advanced #ProstateCancer. Presented by @Tendler_S @MSKCancerCenter. #ESMO26 written coverage by @chavarriagaj @PSH_Urology > https://t.co/KsUTM7w1Mt #mCRPC #PrecisionOncology https://t.co/jQIYOkIyFU
[Slide 1]
PATIENT 9 | INTRAPATIENT DLL3 HETEROGENEITY
Strong DLL3 expression on IHC (H-score 280) contrasted with limited PET uptake, with only 10/41 lesions (24%) DLL3-avid, highlighting marked intrapatient heterogeneity. Osseous metastases involving the ribs with soft tissue component showing FDG and DLL3 positivity (red arrow) while lung metastasis shows FDG avidity without DLL3 avidity (green arrow).
DLL3
FDG
PSMA
DLL3
FDG
[Slide 2]
PATIENT 13 | DLL3 PET-GUIDED BIOPSY
After multiple lines of systemic therapy for prostate adenocarcinoma, DLL3 PET revealed a heterogeneous pattern of target expression, with only 4 of 40 assessed lesions (10%) demonstrating detectable DLL3 uptake. A DLL3-avid lesion was subsequently selected for biopsy, which confirmed neuroendocrine differentiation and high DLL3 expression by immunohistochemistry (H-score 170). The concordance between imaging and tissue illustrates how DLL3 PET may help identify lesions that provide clinically meaningful information about tumor biology. This case supports the potential role of whole-body DLL3 imaging in complementing conventional tissue sampling by directing biopsy toward lesions with evidence of the target of interest.
DLL3
FDG
UroToday.com@urotoday
Slide: CH vs tumor HRR in liquid biopsy (Antonarakis): patient flow diagram, F1LCDx prostate cohort
Distinguishing Clonal Hematopoiesis from Tumor HRR Alterations in Liquid Biopsy: Implications for PARP Inhibitor Use in #mCRPC. Presented by @EAntonarakis @UMNCancer, #ESMO26 written coverage by @zklaassen_md > https://t.co/25zUQeZXbm #ProstateCancer #PrecisionOncology @myESMO https://t.co/A6U3MJxMju
Aim 1.
Patients with prostate cancer and F1LCDx N = 18,691
Filtering: 15,766 no clinical data
Clinical data available N = 2,925
Filtering: 1,846 did not receive PARPi
Received PARPi N = 430
Filtering 7 missing sample collection date
Aim 3.
Sample before PARPi N = 366
Sample after PARPi N = 66*
*9 patients had paired samples
Filtering: 20 mHSPC; 61 missing information; 3 entered after PARPi therapy; 194 with no BRCA1/2, PALB2, RAD51C/D, BARD1 alteration**; 27 PARPi combo
Aim 2.
PARPi monotherapy and mCRPC with HRR alteration N = 61
UroToday.com@urotoday
1) Slide: UroCCR 267 neoadjuvant IO in localized ccRCC: reasons neoadjuvant therapy was given · 2) Slide: UroCCR 267 neoadjuvant IO in ccRCC: surgical outcomes table and R0 resection rate · 3) Response data: UroCCR 267 neoadjuvant IO in ccRCC: tumor response, ORR 68% in 16 evaluable · 4) Slide: UroCCR 267 neoadjuvant IO in ccRCC: pathological stage after neoadjuvant treatment
Neoadjuvant Immunotherapy in High-Risk Localized Clear Cell Renal Cell Carcinoma: Multicenter Retrospective Study (UroCCR n°267). Presented by Fabien Moinard-Butot. #ESMO26 written coverage by @rksayyid > https://t.co/sc73jJz1vW #KidneyCancer #RCC #Immunotherapy @myESMO https://t.co/XjIMZ3G7aG
[Slide 1]
WHY WAS NEOADJUVANT THERAPY GIVEN ?
Downstage vena cava thrombus
41%
Facilitate resecability
47%
Facilitate nephron-sparing surgery
12%
[Slide 2]
SURGICAL OUTCOMES
Type of surgery | Number of patients (N = 17)
Radical nephrectomy | 10
Partial nephrectomy | 5
Radical nephrectomy + controlateral partial nephrectomy | 1
Cryotherapy | 1
R0 resection
93%
2 postoperative complications (12.5%) : Urinary fistula, Pseudoaneurysm
[Slide 3]
TUMOR RESPONSE (16 patients evaluable)
ORR
68%
Best response (RECIST v1.1), n
PR 11
SD 5
CR 0
[Slide 4]
PATHOLOGICAL OUTCOMES AFTER NEOADJUVANT
Figure 1 : Pathological stage after neoadjuvant treatment
Number of patients
Pathological stage
pT0 pT1a pT1b pT2a pT3a pTx
Pathological features, n (%)
Tumor necrosis | 9 (53)
Venous tumor thrombus | 7 (41)
Sarcomatoid component | 3 (17)
UroToday.com@urotoday
1) Slide: CheckMate 214 nivolumab + ipilimumab vs sunitinib 9-year OS and PFS (discussant slide) · 2) Slide: Discussant slide: why most RCC patients still progress on checkpoint inhibitors · 3) Kaplan-Meier survival data: LAG-3 as the only new checkpoint with a phase 3 win: RELATIVITY-047 · 4) Response data: Bar chart of confirmed ORR in KEYMAKER-U03 substudy 03A first-line ccRCC showing
Novel Immunotherapy; CAR-T, Bispecific Antibodies, New ICIs. Presented by @KoenvdMijn @NKI_nl. #ESMO26 written coverage by @chavarriagaj @PSH_Urology > https://t.co/cTaTOwS0aq #KidneyCancer #RCC #Immunotherapy @myESMO https://t.co/T2JXCsQ2gK
[Slide 1]
CURRENT STANDARD
Dual checkpoint blockade: a durable tail at 9 years
Anti-CTLA-4
Ipilimumab: releases T-cell priming in the lymph node
Anti-PD-1
Nivolumab: restores effector function in the tumour
CheckMate 214
N = 1,096 · first-line aRCC
NIVO + IPI ×4 → NIVO vs sunitinib
Median follow-up 9.3 years
31.4% vs 19.5%
OS at 9 years · HR 0.71 (0.62–0.82)
22.7% vs 9.0%
PFS at 8 years: the plateau
But: ORR 39.5% and median PFS 12.4 vs 12.3 mo: the tail is a minority. ~70–75% relapse on combination therapy.
A Overall survival
B Progression-free survival per IRRC
NIVO + IPI
SUN
Months
Choueiri TK et al. Ann Oncol 2026;37:960. Burgers FH, van der Mijn JCK et al. Nat Rev Nephrol 2025.
Survival table
Endpoint: OS (CheckMate 214, ITT)
NIVO + IPI
Sunitinib
HR: 0.71
HR CI: 0.62–0.82
9-year OS 31.4% vs 19.5%
8-year PFS 22.7% vs 9.0%
[Slide 2]
RESISTANCE
Why most patients still progress on checkpoint inhibitors
Cancer cell characteristics
Intratumoural heterogeneity
Low tumour mutational burden
Tumour microenvironment
Few B cells and TLS
Dysfunctional DCs outside TLS
B cell
T cell
Immature DC
High infiltration of dysfunctional T cells
↑PD-1
↑LAG-3
↑CTLA-4
↑TIM-3
Immunosuppressive cell subsets
M2-likeTAMs
MDSCs
Treg cell
IL-10, TGFβ
NEW: HYPOXIA
VEGFR TKI/IO responders
ccRCC
↑VEGF
Vhl-/- pseudohypoxia
VEGFR TKI
chronic VEGFR TKI
SPP1 TAM
True TME hypoxia
metastasis
• VHL loss = pseudohypoxia; normoxic HIF signaling
• High pretreatment hypoxia signatures predict worse IO/TKI outcome (JAVELIN Renal 101, IMmotion150)
• TKI-induced hypoxia recruits SPP1+ TAMs
[Slide 3]
NEW CHECKPOINTS
LAG-3: the only new checkpoint with a phase 3 win
RELATIVITY-047 · PFS · 1L melanoma · n = 714
Progression-free Survival (%)
Relatlimab–nivolumab
Nivolumab
Months
No. at Risk
PFS 10.1 vs 4.6 mo, HR 0.75 (0.62–0.92)
OS 51.0 vs 34.1 mo, HR 0.80
LAG-3 agents beyond relatlimab
Agent | Latest result
Fianlimab | Phase 3 1L melanoma (+ cemiplimab vs pembro): PFS 11.5 vs 6.4 mo, HR 0.85, not significant (May 2026); head-to-head vs nivo/rela ongoing
Favezelimab | KEYFORM-007 (MSS CRC) stopped for futility (2024)
Eftilagimod alfa
Soluble LAG-3, APC agonist | TACTI-002 NSCLC ORR 48%; phase 3 TACTI-004 stopped for futility (Mar 2026)
TIGIT
PHASE 3 FAILURES
Tiragolumab, vibostolimab, belrestotug, domvanalimab: all negative or futile (2024–26)
TIM-3
PHASE 3 FAILURE
Cobolimab: COSTAR Lung missed OS (2025); sabatolimab stopped in MDS
VISTA
PHASE 1
KVA12123, SNS-101: tolerable, stable disease only
Tawbi HA et al. NEJM 2022;386:24. Fianlimab NCT05352672. KEYFORM-007. TACTI-004 (Mar 2026). TIGIT/TIM-3: Clinical Trials Arena 2025; ApexOnco 2026.
Survival table
Endpoint: PFS (RELATIVITY-047, 1L melanoma)
Relatlimab–nivolumab | 355 | 10.1 mo
Nivolumab | 359 | 4.6 mo
HR: 0.75
HR CI: 0.62–0.92
[Slide 4]
In RCC, LAG-3 and TIGIT have not improved on the backbone
Confirmed ORR (%) · KEYMAKER-U03 substudy 03A, first-line ccRCC
Pembrolizumab + lenvatinib (reference) 80.6
Belzutifan + pembro + lenvatinib 77.5
Quavonlimab (CTLA-4)/pembro + lenvatinib 71.3
Favezelimab (LAG-3)/pembro + lenvatinib 62.7
Vibostolimab (TIGIT)/pembro + belzutifan 42.5
Substudy 03B · previously treated
Favezelimab (LAG-3) + pembrolizumab: no objective responses (6 arms, n = 263)
VISTA · KVA12123 ± pembrolizumab
Phase 1: one ICI-refractory RCC patient with stable disease (−24%)
TIM-3
Strong rationale (TIM-3+ dysfunctional CD8+ TILs), but no RCC efficacy data reported
Suárez C et al. Ann Oncol 2026. KVA12123: Kineta, Mar 2024. Burgers FH, van der Mijn JCK et al. Nat Rev Nephrol 2025.
UroToday.com@urotoday
1) Slide: Discussant (Syed Hussain): Is precision medicine possible based on TCGA gene expression subtypes? · 2) Slide: Discussant (Syed Hussain): molecular subtypes and response to cisplatin-based NAC in MIBC · 3) Slide: Discussant (Syed Hussain): Molecular types and I-O (Rosenberg Lancet 2016 IMvigor210 figures)
Invited Discussant: NIAGARA Molecular Subtypes and GDFATHER-NEO in #MIBC. Presented by @ProfSyedHussain @sheffielduni. #ESMO26 written coverage by @chavarriagaj @PSH_Urology > https://t.co/bJN2j6AhaA #BladderCancer #Immunotherapy @myESMO https://t.co/arsgiDdYe4
[Slide 2]
IS PRECISION MEDICINE POSSIBLE BASED ON TCGA GENE EXPRESSION SUBTYPES?
Lerner,…Kwiatkowski; TCGA (N=412), ASCO 2017, CELL 2017
Luminal: KRT20+, GATA3+, FOXA1+
Basal/Squamous: KRT5,6,14+, GATA3-, FOXA1-
Luminal-papillary: FGFR3 mut, fusion, amp; Papillary histology; SHH+; Low CIS → Low risk; NAC*; FGFR3 inhibitors
* Low predicted likelihood of response, based on preliminary data
Luminal-infiltrated: Low purity; EMT markers (TWIST1, ZEB1); miR-200 family; Medium CD274 (PD-L1), CTLA-4; Myofibroblast markers; Wild type p53 → Anti-PD-L1, PD-1, CTLA-4; Cisplatin-based NAC**
** Low response rate
Luminal: UPKs; KRT20; SNX31 → Targeted therapy?
Basal/Squamous: Female; Squamous differentiation; Basal keratin markers; High CD274 (PD-L1), CTLA4; Immune infiltrates → Anti-PD-L1, PD-1, CTLA-4; Cisplatin-based NAC
Neuronal: SOX2; DLX6; MSI1; PLEKHG4B; E2F3/SOX4 amp; High cell cycle → Etoposide/Cisplatin NAC
[Slide 3]
There is a relationship between molecular subtypes and response to cisplatin based Neo-adjuvant in MIBC.
Non-NAC TCGA dataset (n = 397) | Discovery NAC dataset (n = 200)
UNC: p = 0.009 | p = 0.014 (legend: Claudin, Basal, Luminal) → Basal ↑
Lund: p = 0.038 | p = 0.3 → Urobasal B ↑
TCGA: p < 0.0001 | p = 0.09 (legend: Cluster IV, Cluster III, Cluster II, Cluster I)
Time (mo)
Seiler et al. European Urology 2017
Survival table
Endpoint: Survival by molecular subtype (Seiler et al. Eur Urol 2017; endpoint not labelled)
P: UNC 0.009 / 0.014; Lund 0.038 / 0.3; TCGA <0.0001 / 0.09 (non-NAC / NAC datasets)
[Slide 4]
Molecular types and I-O
B T-effector gene expression vs response (Progressive disease, Stable disease, Partial response, Complete response)
CXCL9 p=0·0057; CXCL10 p=0·0079
Log2 gene expression
Interferon-γ-inducible T-helper-1-type chemokines
D CD8 infiltration vs response p=0·0265
% CD8 in tumour area: Stable/progressive disease vs Complete/partial response
CD8+ T-cell infiltration
E IC score by TCGA subtype (IC0, IC1, IC2, IC3): Cluster I n=72, Cluster II n=50 (Luminal); Cluster III n=38, Cluster IV n=35 (Basal)
G Response by TCGA subtype (Progressive disease, Stable disease, Partial response, Complete response): Cluster I n=72, Cluster II n=50, Cluster III n=38, Cluster IV n=35
Discussant : Prof. Syed A Hussain, University of Sheffield
Rosenberg et al. Lancet 2016; 387: 1909–20
UroToday.com@urotoday
Slide: Himalayas-1 global study footprint map
Himalayas-1: Rinzimetostat, an Allosteric PRC2 Inhibitor Combined with Darolutamide: A Global Phase 3 Study in #mCRPC Patients Previously Treated With Abiraterone Acetate. Presented by @quimmateo @VHIO, #ESMO26 written coverage by @zklaassen_md > https://t.co/XcjtPxp6wM #ProstateCancer #ClinicalTrials @myESMO
Figure 2. Global Himalayas-1 Study Footprint
[World map with participating countries shaded, including North America, Mexico, Brazil, Argentina, Western Europe, Turkey, India, China, Japan, South Korea, Southeast Asia, Australia]
himalayasprostatestudy.com
Exploratory Analysis of Molecular Subtypes and Association With Treatment Outcomes in Patients With Muscle-Invasive #BladderCancer #MIBC From #NIAGARA. Presented by @MattGalsky @TischCancer. #ESMO26 written coverage by @chavarriagaj @PSH_Urology > https://t.co/jPVKBdjHIa @myESMO https://t.co/hZ1xH6joKU
[Slide 1]
NIAGARA: Study Design
Study population
• Adults
• Cisplatin-eligible MIBC (cT2–T4aN0/1M0)
• UC or UC with divergent differentiation or histological subtypes
• Evaluated and confirmed for RC
• CrCl of ≥40 mL/min
R 1:1
BEPs: WES n=407; RNA-seq n=402
Durvalumab arm N=533
Neoadjuvant Q3W, 4 cycles: Durvalumab 1500 mg IV + Gemcitabine + cisplatin
RC
Adjuvant Q4W, 8 cycles: Durvalumab 1500 mg IV
Comparator arm N=530: Gemcitabine + cisplatin → No treatment
Primary endpoints • EFS • pCR
Key secondary endpoint • OS
Exploratory analyses • MIBC molecular drivers and subtypes in relation to treatment benefit
• Dual DNA/RNA was extracted from baseline tumours for WES and RNA-seq analysis by Natera Inc. (Austin, TX, USA)a
• Exploratory, non-alpha controlled assessment of molecular drivers and outcomes was conducted
[Slide 2]
NIAGARA: Biomarker-Evaluable Population Baseline Characteristics
Baseline characteristics were generally similar between the BEPs and the ITT
Baseline characteristicsa | WES BEP (n=407) | RNA-seq BEP (n=402) | ITT (N=1063)1
Treatment arm D+NAC | 51% | 52% | 50%
Treatment arm NAC | 49% | 48% | 50%
Age, years Median (range) | 66 (32–84) | 66 (32–84) | 65 (32–84)
Sex Male | 82% | 83% | 82%
Tumour stage >T2N0 | 60% | 60% | 57%
Tumour stage T2N0 | 40% | 40% | 43%
Renal function Adequate renal function | 81% | 81% | 81%
Renal function Borderline renal function | 19% | 19% | 19%
Regional lymph nodes N0 | 94% | 94% | 95%
Regional lymph nodes N1 | 6% | 6% | 5%
Histology UC | 84% | 85% | 85%
Histology UC with divergent differentiation or histological subtypes | 16% | 15% | 15%
PD-L1 expressionb High | 70% | 68% | 73%
PD-L1 expressionb Low | 30% | 32% | 27%
Cystectomyc Yes | 95% | 95% | 86%
Cystectomyc No | 5% | 5% | 14%
• Matched baseline WES and RNA-seq samples were available for n=352 patients
[Slide 4]
NIAGARA: EFS Benefit in Mutation-Defined Subgroups
Addition of perioperative durvalumab to NAC consistently improved EFS across mutation-defined subgroups, with numerical increase of benefit for TMB-high and TP53- and FGFR3-mutated subgroups
Population/subgroup | D arm | C arm | HR (95% CI)
ITT (N=1063) | 533 | 530 | 0.68 (0.56–0.82)
BEP (n=407) | 209 | 198 | 0.64 (0.45–0.89)
TMB-high | 84 | 77 | 0.44 (0.25–0.76)
TMB-low | 125 | 121 | 0.82 (0.53–1.26)
TP53 mutated | 107 | 97 | 0.51 (0.32–0.81)
TP53 WT | 102 | 101 | 0.81 (0.49–1.31)
FGFR3 mutated | 20 | 24 | 0.24 (0.07–0.87)
FGFR3 WT | 189 | 174 | 0.70 (0.49–0.99)
TP53CC mutated (pathway) | 129 | 125 | 0.58 (0.38–0.88)
RTK mutated (pathway) | 86 | 82 | 0.49 (0.28–0.85)
DDR mutated (pathway) | 50 | 48 | 0.72 (0.36–1.43)
Histone-mod mutated (pathway) | 83 | 85 | 0.63 (0.37–1.08)
Chromatin remodelling (pathway) | 54 | 44 | 0.48 (0.23–0.98)
EFS HR (log scale) Favours D arm | Favours C arm
Graph depicts EFS HR (square) and 95% confidence intervals (lines), and was assessed by the Cox proportional hazards model, with treatment as the only covariate and ties handled by the Efron approach.
BEP, biomarker-evaluable population; C, comparator; CC, cell cycle; CI, confidence interval; D, durvalumab; DDR, DNA damage response; EFS, event-free survival; HR, hazard ratio; ITT, intention-to-treat population; NAC, neoadjuvant chemotherapy; RTK, receptor tyrosine kinase; TMB, tumour mutational burden; WT, wild-type.
Vall d’Hebron Institute of Oncology (VHIO)@VHIO
Slide: BioChiP phase II carboplatin in pretreated mCRPC - Best Poster award, VHIO
🏆 Congratulations to @pablo_cresta, researcher in #VHIO’s Prostate Cancer Translational Research Group, on winning the Best Poster Award at #ESMO2026!
His poster highlights BioChiP, an academic trial investigating carboplatin in metastatic castration-resistant #prostatecancer.
👏 Well deserved, Pablo!
[Best Poster rosette]
BioChiP: A phase II, open-label, biomarker-guided study of carboplatin efficacy in pretreated metastatic castration resistant prostate cancer
Background [illegible]
Design [illegible]
Key elegibility criteria [illegible]
Procedures [illegible]
Biomarker analyses [illegible]
Endpoints [illegible]
Statistical analysis [illegible]
Conclusions [illegible]
Acknowledgments
Personal information
TAKE HOME MESSAGES
• Without biomarker selection, carboplatin showed a combined response rate of 21.5%.
• Higher response rates were associated with a RAD51-defined HRD phenotype and with BRCA1/2 alterations.
Genomic landscape of study population
Primary endpoint · Response Rate
21.5% 95% CI 12.3 - 33.5
BIOCHEMICAL RESPONSE RATE 16.9% 95% CI 8.3 - 28.3
RADIOGRAPHIC RESPONSE RATE 22.7% 95% CI 11.5 - 37.8
Key secondary endpoint
RESPONSE RATE BY RAD51 [small table - largely illegible]
Patients characteristics [illegible table]
Secondary endpoints
OVERALL POPULATION
rPFS
CLINICAL PFS
OVERALL SURVIVAL
Exploratory [illegible]
UroToday.com@urotoday
1) Kaplan-Meier survival data: ENZAMET: cumulative incidence of treatment-emergent SCNEPC · 2) Kaplan-Meier survival data: ENZAMET: overall survival from SCNEPC diagnosis by treatment group
Treatment-Emergent SCNEPC in #mHSPC in ENZAMET (ANZUP 1304). Presented by @MartinStockler. #ESMO26 written coverage by @chavarriagaj > https://t.co/9MhyAvq1TX #ProstateCancer @myESMO https://t.co/oYEchEkYZ5
[Slide 1]
Fig 1: Cumulative incidence of SCNEPC, by treatment group
Cumulative Incidence of SCNEPC in ENZAMET (%)
Enzalutamide
Conventional NSAA
Years
Number at risk (event)
Enzalutamide
Conventional NSAA
Survival table
Endpoint: Cumulative incidence of SCNEPC
Enzalutamide | 563
Conventional NSAA | 562
[Slide 2]
Median OS (IQR) from SCNEPC diagnosis in
ALL 19 pts 9 months (2-18),
ENZA vs NSAA 9 vs 7, p=0.3 (see Fig 2)
Fig 2: OS from diagnosis of SCNEPC, by treatment group
Proportion Alive
NSAA
ENZA
Months since SCNEPC diagnosis
Number at risk (number of events)
Survival table
Endpoint: OS from SCNEPC diagnosis
ENZA | 15 | 9 months
NSAA | 4 | 7 months
P: 0.3
UroToday.com@urotoday
1) Trial design schema: BARCODE2 study schema (open-label single-arm phase II, mCRPC carboplatin) · 2) Trial design schema: BARCODE2 screening and enrolment flow · 3) Response data: BARCODE2 stage 1 response rates by genetic group
Targeted Treatment of #mCRPC Based on Genetic Profiling: Results from the BARCODE2 Trial. Presented by Dr. Ann-Britt Jones, #ESMO26 written coverage by @zklaassen_md > https://t.co/CX1X7piptl #ProstateCancer #PrecisionOncology @myESMO https://t.co/wsiQOOQxBW
[Slide 1]
BARCODE2: Open-label, single arm phase II study
Part 1: Genetic screening for actionable DRG PGV
- Cohort: mCRPC with prior/ongoing treatment of docetaxel and/or abiraterone/enzalutamide
- Screen using DRG panel (n=115) based on known associations of germline variants with mCRPC* → PGV absent: standard of care off study
- PGV present: monitor until qualifying progression
Part 2: Treatment with 3-weekly carboplatin (AUC5)
- Progression after treatment of docetaxel and abiraterone/enzalutamide ← Direct entrants: mCRPC with eligible treatment history and prior confirmed PGV
- Enter part 2 and start carboplatin
- Follow-up including RECIST, PSA, bone scans and adverse events → Discontinue carboplatin after maximum 10 cycles or disease progression if occurring first
[Slide 2]
From May 2017 to June 2025: genetic profiling of 301/303 (99.3%) part 1 entrants
- 7/301 (2.3%) part 2 ineligible mutation
- 249/301 (82.7%) with no mutation
- 45/301 (15.0%) with part 2 eligible variant
Group 1 (BRCA): 9/301 (3.0%) [95% CI 1.4-5.6] → 9* entered trial; 2 did not → 6/9 (66.7%) started carboplatin
Group 2 (Lynch syndrome): 3/301 (1.0%) [95% CI 0.2-2.9] → 1 entered trial; 2 did not → 1/1 (100%) started carboplatin
Group 3 (other DRG): 33/301 (11.0%) [95% CI 7.7-15.1] → 14 entered trial; 19 did not → 12/14 started carboplatin (85.7%)
[Slide 3]
| | Group 1 (BRCA) (N=9) | Group 2 (Lynch syndrome) (N=1) | Group 3 (other DRG) (N=14) |
| Target response in stage 1 & 2 | ≥1/6; ≥3/11 | ≥1/6; ≥3/11 | ≥2/12; ≥5/18 |
| Stage 1 response rate (%) | 2/6 (33.3) [82% CI 8.7-67.7] | 0/1 (0) [91% 1-sided CI 0-91.0] | 0/11 (0) [95% 1-sided CI 0-23.8] |
| Outcome | Target met; recruitment closed due to new treatment pathway | Insufficient data for analysis; recruitment closed | Target not met; recruitment closed |
UroToday.com@urotoday
1) Slide: Decipher genomic classifier risk-group distribution: STAMPEDE vs commercial testing in NCCN very · 2) Kaplan-Meier survival data: STAMPEDE: prostate cancer-specific mortality by Decipher risk group · 3) Slide: Transcriptomic signatures: STAMPEDE vs real-world data standardized sHR for distant metastasis
Transcriptome Classifier Risk Stratification and Intensification with ARPIs for Clinically Very High-Risk #ProstateCancer. Presented by Sarah Howlett, MBBS @ucl. #ESMO26 written coverage by @zklaassen_md > https://t.co/aeEyaFw17o #PrecisionOncology #GUOnc @myESMO https://t.co/Y39PcHhxCe
1) Slide: TALAPRO-2 China cohort Table 2: HRR gene alteration frequencies among patients with informative · 2) Slide: TALAPRO-2 China cohort Figure 2: rPFS by BICR forest plot for HRR single-gene alterations and gene · 3) Biomarker data: TALAPRO-2 China cohort Figure 3: heatmap of tumour mutations by response category · 4) Slide: TALAPRO-2 China cohort Figure 4: exploratory associations between non-HRR gene alterations
TALAPRO-2 China Cohort Biomarker Analysis: First-line talazoparib + enzalutamide in #mCRPC. Presented by Dingwei Ye. #ESMO26 written coverage by @rksayyid @UAUrology > https://t.co/YT6OjrxQh8 #ProstateCancer #PrecisionOncology @myESMO https://t.co/LoRGIArlbx
[Slide 1]
Table 2. HRR Gene Alteration Frequencies* Among Patients With Informative NGS Results in the TALAPRO-2 China Cohort
| TALA + ENZA (n=31) | PBO + ENZA (n=32) | Total (N=63)
ATM | 5 (16.1) | 2 (6.3) | 7 (11.1)
ATR | 1 (3.2) | 1 (3.1) | 2 (3.2)
BRCA1 | 1 (3.2) | 0 | 1 (1.6)
BRCA2 | 5 (16.1) | 3 (9.4) | 8 (12.7)
CDK12 | 3 (9.7) | 8 (25.0) | 11 (17.5)
CHEK2 | 1 (3.2) | 1 (3.1) | 2 (3.2)
FANCA | 1 (3.2) | 0 | 1 (1.6)
MLH1 | 0 | 1 (3.1) | 1 (1.6)
MRE11A | 0 | 0 | 0
NBN | 0 | 0 | 0
PALB2 | 0 | 1 (3.1) | 1 (1.6)
RAD51C | 0 | 0 | 0
Data are presented as n (%), with percentages calculated using the number of patients with informative NGS results as the denominator. Analyses included all informative tumor tissue NGS results available for the China cohort, including prospectively available results and retrospectively analyzed results obtained after randomization.
*Mutations detected in one or more genes from the 12-gene HRR panel, alone or in combination with mutations in other genes, among patients with informative NGS results in the TALAPRO-2 China cohort. Patients with alterations in more than one HRR gene were counted once for each affected gene; therefore, counts across genes were not mutually exclusive and should not be summed.
ENZA=enzalutamide; HRR=homologous recombination repair; NGS=next-generation sequencing; PBO=placebo; TALA=talazoparib.
[Slide 2]
Figure 2. rPFS by BICR for Selected 12-Panel HRR Single-Gene Alterations Groups and Gene Alteration Clusters Based on Prospective Testing of Patients in the TALAPRO-2 China Cohort*
Subgroup | TALA + ENZA No. of events/No. of patients | PBO + ENZA | TALA + ENZA Median (months) | PBO + ENZA | HR (95% CI) | p-value
All HRR-deficient | 8/14 | 9/12 | 15.7 | 4.0 | 0.20 (0.07–0.61) | 0.0023
Only CHEK2† | 0/1 | 0/1 | NR | NR | NR | NR
Only ATM† | 2/3 | 0/1 | 13.8 | NR | NR | NR
Only BRCA2† | 2/4 | 0 | 27.7 | NR | NR | NR
Only CDK12 | 2/3 | 5/6 | 15.7 | 4.0 | 0.14 (0.02–1.31) | 0.0513
BRCA cluster | 4/6 | 2/3 | 19.4 | 8.3 | 0.35 (0.05–2.62) | 0.2872
CDK12 cluster | 2/3 | 7/8 | 15.7 | 3.8 | 0.13 (0.02–1.10) | 0.0324
ATM cluster† | 2/4 | 0/1 | 13.8 | NR | NR | NR
Other gene cluster† | 0/1 | 0 | NR | NR | NR | NR
Hierarchy
Favors TALA + ENZA | Favors PBO + ENZA
HRs for all subgroups were based on an unstratified Cox model with treatment as the only covariate; p-values are 2-sided.
For the single gene groupings, only patients bearing alteration(s) in the designated HRR gene and no other HRR genes are displayed.
*HRR gene alteration status was based on prospective tumor tissue testing results available at or before randomization; †HR (95% CI) cannot be calculated.
BICR=blinded independent central review; CI=confidence interval; ENZA=enzalutamide; HR=hazard ratio; HRR=homologous recombination repair; NR=not reached; PBO=placebo; rPFS=radiographic progression-free survival; TALA=talazoparib.
[Slide 3]
Figure 3. Heatmap of Tumor Mutations by Response Category in the Evaluable Biomarker Analysis Population of the TALAPRO-2 China Cohort (n=54)
Treatment
Response
PTEN (29.6%)
TP53 (29.6%)
MLL2 (27.8%)
ATM (24.1%)
BRCA2 (18.5%)
CDK12 (18.5%)
APC (16.7%)
PTCH1 (16.7%)
IRS2 (14.8%)
TET2 (14.8%)
TMPRSS2 (14.8%)
ATR (13.0%)
FGFR3 (13.0%)
LTK (13.0%)
MSH3 (13.0%)
RAD21 (13.0%)
STK11 (13.0%)
TSC2 (13.0%)
ZNF217 (13.0%)
BRAF (11.1%)
KDM6A (11.1%)
SPEN (11.1%)
SPOP (11.1%)
Treatment: PBO + ENZA; TALA + ENZA
Response: CR; NCR/NPD; NE; PD; PR; SD
Alterations: None; CN-Amplification; CN-Loss; Deletion; Insertion; RE-Deletion; RE-Fusion; RE-Other; RE-Truncation; SV; Multiple alterations
[Slide 4]
Figure 4. Exploratory Analysis of Associations Between Non-HRR Gene Alterations and rPFS in the TALAPRO-2 China Cohort
TP53
MLL2
TET2
PTEN
P-value (log scale)
HR (log scale)
UroToday.com@urotoday
Biomarker data: CHHiP trial: MMAI AI biomarker reclassification of NCCN and CPG risk groups
Prognostic Value of a Multimodal AI Biomarker in Contemporary MRI-Staged #ProstateCancer Patients in the CHHiP Trial. Presented by Isabel Syndikus, MD @CCCNHS. #ESMO26 written coverage by @chavarriagaj @PSH_Urology > https://t.co/h7D9cEVH74 #PrecisionOncology #RadOnc @myESMO https://t.co/LuDkqgYYWR
KEY TAKEAWAY
Despite clinical risk group reassignment by MRI T staging, MMAI still reclassified NCCN risk in 602 pts (549 down) and CPG risk in 630 pts (539 down)
MMAI Risk Group: High, Intermediate, Low
NCCN risk group → MMAI risk group
Number of Patients
NCCN Low: 0% High; 31.2% Intermediate; 68.8% Low
NCCN Intermediate: 5.0% High; 62.6% Intermediate; 32.4% Low
NCCN High: 18.7% High; 78.9% Intermediate; 2.4% Low
CPG → MMAI risk group
CPG 1: 1.0% High; 52.5% Intermediate; 46.5% Low
CPG 2: 1.1% High; 58.5% Intermediate; 40.4% Low
CPG 3: 9.0% High; 65.8% Intermediate; 25.3% Low
CPG 4: 15.8% High; 81.6% Intermediate; 2.6% Low
CPG 5: 31.0% High; 67.6% Intermediate; 1.4% Low
UroToday.com@urotoday
1) Slide: Meta-analysis of abiraterone and enzalutamide by ethnicity in mCRPC: 42 studies, 30,463 patients · 2) Slide: Bar charts of PSA50, median PFS and median OS by ethnicity for abiraterone vs enzalutamide in mCRPC · 3) Slide: Figure 1 table: PSA50, median PFS and median OS by ethnicity for abiraterone vs enzalutamide
Ethnicity-Based Analysis of Abiraterone and Enzalutamide Outcomes in 30,000 #mCRPC Patients. Presented by Jocelyn Tan, MD. #ESMO26 written coverage by @chavarriagaj > https://t.co/0qyvKhZZ0G #ProstateCancer @myESMO https://t.co/KfJB6dUgIe
[Slide 1]
42
included studies
30,463
mCRPC patients
Asian 2,427
Black 2,324
White 22,015
Mixed 3,697
[Slide 2]
PSA50 (%)
mPFS (mo)
mOS (mo)
Asian Black White Mixed
[Slide 3]
Figure 1. Matrix with Ethnicities, ARPI and Treatment Endpoints.
Subgroup | Abiraterone (AA) | Enzalutamide (ENZA)
PSA50 (%)
Asian | 55.4 (95% CI: 44.7-65.7) | 73.0 (95% CI: 67-79)
Black | 74.0 (95% CI: 60-85) | 63.0 (95% CI: 56-70)
White | 62.1 (95% CI: 57-67) | 77.0 (95% CI: 60-88)
Mixed | 50.0 (95% CI: 48-51) | N/A
mPFS (mo)
Asian | 9.9 (95% CI: 6.9-14.4) | 13.2 (95% CI: 7.7-22.5)
Black | 14.4 (95% CI: 12.7-16.4) | 9.5 (95% CI: 9.5-9.5)
White | 15.5 (95% CI: 11.7-20.3) | 11.1 (95% CI: 8.3-14.9)
Mixed | N/A | N/A
mOS (mo)
Asian | 25.6 (95% CI: 15.4-42.7) | 27.2 (95% CI: 14.3-52.0)
Black | 22.8 (95% CI: 20.1-26.0) | N/A
White | 25.7 (95% CI: 22.3-29.6) | 25.2 (95% CI: 19.8-32.2)
Mixed | 23.4 (95% CI: 23.4-23.4) | N/A
UroToday.com@urotoday
1) Slide: [18F]PSMA-1007 PET and serial [211At]PSMA-5 SPECT images at 1, 3 and 24 hours after first cycle · 2) Slide: PSMA PET before and 3 months after three cycles of [211At]PSMA-5 in a patient with mCRPC
First-in-Human Evaluation of 211At-PSMA-5 as a Novel Targeted Alpha Therapy in Patients with #mCRPC: Alpha-PS1 Trial. Presented by Tadashi Watabe, MD, PhD, #ESMO26 written coverage by @zklaassen_md > https://t.co/RPGmeGWek7 #ProstateCancer #Theranostics @myESMO https://t.co/5QdhhlD4av
[Slide 3]
[211At]PSMA-5 SPECT (1st cycle)
[18F]PSMA-1007 PET
1hr
3hr
24hr
SUV 0–8
[Slide 4]
Pre-treatment
3 months
[211At]PSMA-5 3 cycles
Pre PSMA-PET (PSA 25.14)
3months (PSA 1.34)
UroToday.com@urotoday
1) Slide: Survival curves by NAC vs control and NID vs non-NID status in muscle-invasive bladder cancer · 2) Biomarker data: Liquid biopsy sources in bladder cancer: blood ctDNA and urine utDNA analytes · 3) Biomarker data: Recurrence-free survival by ctDNA status after cystectomy · 4) Biomarker data: Disease-free survival with atezolizumab vs placebo among ctDNA-positive patients
How to Determine Response and Treatment Choice in Muscle-Invasive Bladder Cancer. Presented by Dr. Jorgen Jensen, #ESMO26 written coverage by @zklaassen_md > https://t.co/jgAzr8euwB #BladderCancer #MIBC #PrecisionOncology @myESMO https://t.co/AWx2PkrJ45
[Slide 1]
Cum Survival
Survival Years
NAC NID
Ctrl NID
NAC non-NID
Ctrl non-NID
Survival table
Endpoint: Cum Survival (survival years)
NAC NID
Ctrl NID
NAC non-NID
Ctrl non-NID
[Slide 2]
1 Blood
Circulating Tumour DNA (ctDNA)
Circulating Tumour Micro RNA (miRNA)
Circulating Tumour Cells (CTCs)
Exosomes
Proteomics and Metabolomics
ctDNA
2 Urine
Urinary Tumour DNA (utDNA)
Urinary Tumour Micro RNA (U-miRNA)
Exosomes
Proteomics and Metabolomics
utDNA
[Slide 3]
ctDNA After Cystectomy
RFS (probability)
Time Since Cystectomy (days)
P < .001
Survival table
Endpoint: RFS after cystectomy by ctDNA status
P: <.001
[Slide 4]
Disease-free Survival among All Patients with ctDNA-Positive Status
Percentage of Patients
Months since Randomization
No. of Events (%)
Median Disease-free Survival (95% CI) mo
Atezolizumab (N=167) 112 (67) 9.9 (7.2–12.7)
Placebo (N=83) 66 (80) 4.8 (4.1–8.3)
Stratified hazard ratio for first disease recurrence or death, 0.64 (95% CI, 0.47–0.87)
P=0.005
Atezolizumab
Placebo
No. at Risk
Survival table
Endpoint: Disease-free survival (ctDNA-positive)
Arm | N | Median | Median CI
Atezolizumab | 167 | 9.9 mo | 7.2–12.7
Placebo | 83 | 4.8 mo | 4.1–8.3
HR: 0.64
HR CI: 0.47–0.87
P: 0.005
UroToday.com@urotoday
1) Slide: Bar chart of xerostomia incidence by 225Ac-PSMA-Trillium dose (PAnTHA) · 2) Slide: Bar chart of improvement in grade 2 xerostomia by 225Ac-PSMA-Trillium dose (PAnTHA) · 3) Slide: Swimmer plot of xerostomia grade over time by 225Ac-PSMA-Trillium dose (PAnTHA) · 4) Slide: Line chart of median Xerostomia Inventory scores over time by dose (PAnTHA)
Xerostomia Following 225Ac-PSMA-Trillium in #mCRPC: Phase 1 PAnTHA Study. Presented by @sebastienhotte. #ESMO26 written coverage by @chavarriagaj > https://t.co/vi5IgXOWku #ProstateCancer #RadOnc @myESMO https://t.co/OoXnsUITrD
[Slide 1]
Figure 1. Xerostomia incidence
Dose (kBq/kg) | Grade 1 | Grade 2
150 | 31 | 62
125 | 58 | 25
100 | 77 | 15
75 | 50 | 25
Participants (%)
Grade 1
Grade 2
[Slide 2]
Figure 2. Improvement in grade 2 xerostomia
150 kBq/kg 13% (1/8)
125 kBq/kg 100% (3/3)
100 kBq/kg 50% (1/2)
75 kBq/kg 100% (3/3)
[Slide 3]
Figure 3. Xerostomia over time
EOT
225Ac-PSMA-Trillium dose
150 kBq/kg
125 kBq/kg
100 kBq/kg
75 kBq/kg
Grade 0
Grade 1
Grade 2
Dosing
Study days
The plot depicts xerostomia adverse events as they occurred during the study period.
[Slide 4]
Figure 4. Changes in median Xerostomia Inventory Questionnaire scores over time
Median XI xerostomia score
Study visit
SCN (n=47)
C2D1 (n=46)
C3D1 (n=47)
C4D1 (n=38)
EOT (n=38)
12W FU (n=24)
24W FU (n=17)
75 kBq/kg
100 kBq/kg
125 kBq/kg
150 kBq/kg
UroToday.com@urotoday
1) Biomarker data: PROMPT plasma ctDNA vs matched tissue HRR/PI3K-AKT oncoprint (Mehra, ESMO 2026) · 2) Biomarker data: PROMPT ctDNA vs tissue concordance PPV/PPA table by alteration class · 3) Biomarker data: PROMPT BRCA1/2 + HRRm tissue NGS vs plasma ctDNA Venn diagram (Mehra, ESMO 2026)
Plasma ctDNA as Standalone or Adjunct to Tumor Tissue for HRR and PI3K/AKT Genotyping in mCRPC: PROMPT. Presented by @NivenMehra @radboudumc. #ESMO26 written coverage by @zklaassen_md > https://t.co/tgiUh9WoVm #ProstateCancer #mCRPC #PrecisionOncology https://t.co/bLCNdWsgP0
[Slide 2]
HRR mutations concordant; PTEN loss graded, not absent
HRR / BRCA and PI3K-AKT alterations: plasma ctDNA vs matched tissue
FRESH (n=102) | ARCHIVAL (n=72)
ctDNA fraction %
biopsy
Gene rows: BRCA2, BRCA1, ATM, CDK12, CHEK2, PALB2, NBN, RAD51B, RAD51C, RAD51D, PIK3CA, PIK3R1, AKT1
PTEN tissue
PTEN ctDNA
per-gene rows (black = CHIP, excluded on matched leukocyte DNA - a false plasma call)
concordant | tissue-only | ctDNA-only | clonal haematopoiesis
PTEN block - resolved by depth
tissue biallelic loss (called) | ctDNA clonal biallelic | not evaluable (ctDNA fraction < 20%)
tissue loss below the biallelic call | ctDNA subclonal / single-copy | excluded, coverage dropout
[Slide 3]
| SNV / indel | Biallelic loss
BRCA1/2 | PPV 82% - PPA 93% (14/15) - 95% CI 70-99% | PPV 100% - PPA 50% (3/6) - 95% CI 19-81%
HRR (non-BRCA) | PPV 97% - PPA 81% (29/36) - 95% CI 65-90% | n/a - n = 1 - not evaluable
PI3K / AKT | PPV 65% - PPA 57% (13/23) - 95% CI 37-74% | PPV 50% - PPA 14% (8/58) - 95% CI 7-25%
[Slide 4]
BRCA1/2 + HRRm
Tissue NGS | Plasma ctDNA
11 tissue only | 46 both | 4 plasma only
n = 61 altered patients - circle and overlap areas proportional to patient numbers
why discordant
11 tissue-only: 7 | 4
4 plasma-only: 2 | 1 | 1
not evaluable - ctDNA fraction below the class floor | technical - coverage / SNP filter or annotation
assessable, still discordant - biology | no explanation identified
UroToday.com@urotoday
1) Slide: Scatter plot: tumour content concordance between NEMO and PCF_SELECT liquid biopsy methods in mCRPC · 2) Biomarker data: Violin plots of ctDNA tumour content over time in 225Ac-J591 and 177Lu-PSMA-617 · 3) Slide: Allele-specific ploidy across 225Ac-J591, 177Lu-PSMA-617 and SU2C-PCF cohorts and treatment · 4) Kaplan-Meier survival data: Survival curves: biochemical PFS and overall survival
Integrated Liquid Biopsy Profiling Using PCF_SELECT, NEMO, and CTCs in mAPMR #ProstateCancer Treated with PSMA-Targeted Radionuclide Therapy. Presented by @DrScottTagawa @WeillCornell. #ESMO26 written coverage by @zklaassen_md > https://t.co/iKALpuozK8 #PrecisionOncology @myESMO https://t.co/cdsYhi3Z7M
[Slide 1]
1. NEMO and PCF_SELECT Show Strong TC Concordance
R = 0.92, p < 2.2e-16
TC PCF_SELECT
TC NEMO
13/32 (40.6%) flat samples were TC positive by NEMO
Figure 1. TC estimates were highly concordant between PCF_SELECT and NEMO (R=0.92, p<2.2e-16). Inset highlights low-TC samples.
[Slide 2]
2. TC Declined at First Assessment (12 weeks) in 225Ac-J591
A
0.91
225Ac – J591 | 177Lu – PSMA – 617
Trial
B 225Ac – J591
Baseline (n=30) | 12 weeks (n=19) | Progression (n=4)
* ns ns
C 177Lu – PSMA – 617
Baseline (n=50) | 12 weeks (n=37) | Progression (n=10)
ns ns ns
Timepoint
Figure 2. TC was comparable across trials overall. TC declined at first assessment (12 weeks) in the 225Ac-J591 cohort, whereas no significant change was observed in the 177Lu-PSMA-617 cohort.
[Slide 3]
3. Allele-specific ploidy across cohorts and treatment timepoints
A
225Ac – J591
177Lu – PSMA – 617
SU2C–PCF
asP
B Ploidy status: Diploid / Polyploid
225Ac – J591: Diploid 58% (n=15); Polyploid 42% (n=11)
177Lu – PSMA – 617: Diploid 21% (n=8); Polyploid 79% (n=31)
SU2C–PCF: Diploid 44% (n=148); Polyploid 56% (n=191)
Frequency (%)
C 225Ac – J591
Baseline (n=14) | 12 weeks (n=8) | Progression (n=4)
ns ns ns
D 177Lu – PSMA – 617
Baseline (n=14) | 12 weeks (n=20) | Progression (n=5)
* ns ns
Timepoint
[Slide 4]
6. High asP and AR Gain Predicted Poorer PFS and OS
A Biochemical Progression-Free Survival by asP
B Biochemical Progression-Free Survival by AR copy-number status
C Overall Survival by asP
D Overall Survival by AR copy-number status
Survival probability
Time (Months)
Number at risk
n.d. / Diploid / High asP
n.d. / WT / Gain
Survival table
Endpoint: Biochemical PFS by asP (panel A); also bPFS by AR CN (B, p=0.00031), OS by asP (C, p=0.029), OS by AR CN (D, p=0.0018)
n.d. | 19
Diploid | 20
High asP | 40
P: 0.0066
UroToday.com@urotoday
1) Kaplan-Meier survival data: Robert Jones discussant: Prior hypothesis 1 - findings in MIBC · 2) Kaplan-Meier survival data: Robert Jones discussant: Prior hypothesis 2 - JAVELIN Bladder 100 OS · 3) Kaplan-Meier survival data: Robert Jones discussant: Prior hypothesis 2 - KEYNOTE-361 cisplatin · 4) Kaplan-Meier survival data: Robert Jones discussant: Prior hypothesis 3 - findings from NIAGARA
Evolving Systemic Therapy in #BladderCancer. Presented by Robert Jones, MD, PhD. #ESMO26 written coverage by @chavarriagaj > https://t.co/xWTNHHl6c9 #MIBC #UrothelialCancer @myESMO https://t.co/8sTXqymbEz
[Slide 1]
Patient with metastatic disease
• histologically confirmed chRCC
• ECOG PS 0-3
• measurable disease per RECIST 1.1
• any IMDC risk
• ≥18 years old
INCLUSION
no previous systemic therapy → PEMBROLIZUMAB + LENVATINIB n=20
progression on systemic therapy, lenvatinib-naïve → LENVATINIB + EVEROLIMUS n=20
Primary endpoint: objective response rate
Secondary endpoints: progression-free survival, overall survival, duration of response, safety
[Slide 2]
Duration of Tumor Control in ChromoKey Cohort A
Patient (top to bottom): 15, 4, 13, 2, 10, 17, 6, 16, 5, 1, 18, 11, 7, 3, 20, 9, 19, 8, 12, 14
Legend: Partial response (PR); Stable disease (SD); Progression; Ongoing / censored
X-axis: Duration of response or stable disease (months), 0–18
UroToday.com@urotoday
Kaplan-Meier survival data: EV-103 Cohorts DE/A/K: PFS by investigator, pooled EV+P vs EV monotherapy
Long-Term Follow-up of First-Line Enfortumab Vedotin + Pembrolizumab in Cisplatin-Ineligible la/mUC: EV-103 Cohorts DE/A and K. Presented by Dr. Jose Pablo Maroto Rey, #ESMO26 written coverage by @chavarriagaj > https://t.co/hAKipHFJui #BladderCancer #UrothelialCancer @myESMO https://t.co/oXmR4JU7UH
Median PFS by INV was 10.4 months in the pooled DE/A/K EV+P cohort
Pooled DE/A/K EV+P cohort
Events/n | Median PFS (95% CI), mo
77/121 | 10.4 (8.2, 20.9)
Landmark labels: 39.9% (30.6, 49.1); 29.1% (20.1, 38.6); 24.3% (15.1, 34.7); 20.2% (10.6, 32.1)
No. at risk: 121 102 79 55 49 42 38 35 34 32 28 23 23 22 21 20 19 17 15 11 9 7 6 6 5 4 2 1 1 0
EV monotherapy cohort
Events/n | Median PFS (95% CI), mo
50/73 | 6.4 (6.1, 8.4)
Landmark labels: 13.7% (5.6, 25.5); 13.7% (5.6, 25.5); 13.7% (5.6, 25.5)
No. at risk: 73 57 40 20 15 13 9 7 5 5 5 5 5 5 4 4 1 1 1 1 1 1 1 0
PFS, %; Time, mo
Survival table
Endpoint: PFS by investigator
Arm | N | Median | Median CI
Pooled DE/A/K EV+P | 121 | 10.4 mo | 8.2, 20.9
EV monotherapy | 73 | 6.4 mo | 6.1, 8.4
Landmark rates:
24 mo (dotted line position): Pooled DE/A/K EV+P 39.9% (CI 30.6, 49.1) | EV monotherapy 13.7% (CI 5.6, 25.5)
48 mo (dotted line position): Pooled DE/A/K EV+P 29.1% (CI 20.1, 38.6) | EV monotherapy 13.7% (CI 5.6, 25.5)
60 mo (dotted line position): Pooled DE/A/K EV+P 24.3% (CI 15.1, 34.7) | EV monotherapy 13.7% (CI 5.6, 25.5)
84 mo (dotted line position): Pooled DE/A/K EV+P 20.2% (CI 10.6, 32.1)
UroToday.com@urotoday
1) Slide: INDIBLADE Table 1: baseline characteristics and HRQoL · 2) Slide: INDIBLADE HRQoL change from baseline: global health status, physical, role and social functioning · 3) Slide: INDIBLADE HRQoL change from baseline: emotional functioning, cognitive functioning, fatigue · 4) Slide: INDIBLADE HRQoL change from baseline: urinary symptoms, sexual functioning, body image
HRQoL After Induction Ipilimumab + Nivolumab and Bladder-Sparing Chemoradiotherapy in #MIBC: Phase 2 INDIBLADE Trial. Presented by Jan-Jaap Mellema @NKI_nl. #ESMO26 written coverage by @zklaassen_md > https://t.co/VfIU1oPPqg #BladderCancer #Immunotherapy @myESMO https://t.co/bEbv0cQIyK
HIF–VHL-VEGF PATHWAY
[Journal figure, panel A] Clear-cell renal carcinoma cells; Increased HIF-α; TGF-α; VEGF; TGF-β; PDGF-B; Capillary; Red cells; Endothelial cell; Increased nutrients and oxygen
[Panel B] Normoxia: Proline hydroxylase + Oxygen; Asparagine hydroxylase + Oxygen; HIF-α; Normal VHL protein; Mutated VHL protein; Elongin C; Elongin B; VHL protein; cul2; Rbx1; Ub; HIF-α ubiquitination by VHL protein SCF complex; Proteasome; Destruction of HIF-α; Cytoplasm
Hypoxia: No hydroxylation of HIF-α; HIF-α; HIF-β; Translocation of HIF to nucleus; Nucleus; p300; HRE; VEGF; HIF-mediated transcriptional activation
UroToday.com@urotoday
1) Slide: Discussant session overview (Britt Suelmann): EV-103, SKB264-II-06, WUTSUP-02 in urothelial cancer · 2) Slide: Discussant slide: EV-103 durable benefit establishes the benchmark · 3) Trial design schema: Discussant slide: EV + pembrolizumab durable survival in a frail population · 4) Slide: Discussant slide: SKB264-II-06 (NCT05642780) sacituzumab tirumotecan + pembrolizumab in UC
ADCs Across the Urothelial Cancer Continuum: EV-103, SKB264-II-06, and WUTSUP-02 Discussed. Presented by Britt Suelmann, MD. #ESMO26 written coverage by @chavarriagaj > https://t.co/Acj8TkHZuj #BladderCancer #UrothelialCancer #GUOnc @myESMO https://t.co/0YajVgmSwd
[Slide 1]
Session Overview
From EV-103 to the next ADC–immunotherapy era
1 Durability — EV-103: setting the long-term benchmark
2 Differentiation — SKB264-II-06: selecting the next treatment option
3 Expansion — WUTSUP-02: a HER2-directed ADC in curative-intent UTUC
4 Clinical implications — Patient selection, target choice and treatment sequence
“ Can next-generation ADC–immunotherapy combinations surpass EV + pembrolizumab?
[Slide 2]
EV-103: durable benefit establishes the benchmark
Long-term follow-up in cisplatin-ineligible La/mUC locally advanced or metastatic urothelial carcinoma
[Embedded EV-103 cohort schematic - small print; legible: EV-103 dose escalation and expansion cohorts A and K (1L cisplatin-ineligible la/mUC); This analysis: Pooled EV+P DE/A/K (N=121); EV monotherapy Cohort K (N=73)]
• Pooled: dose escalation + cohorts A and K (EV+P, n=121)
• Longest EV+P follow-up in la/mUC (median 64.2 months)
[Embedded DOR KM panels reproduced from the EV-103 presentation (Pooled DE/A/K EV+P cohort; EV monotherapy cohort) - embedded numbers too small to read reliably here; see 2114401677000245524_s2 for the source slide]
Callouts: Long-term disease control beyond 5 years | Long-term durability is markedly lower with EV monotherapy
“ Responses persist beyond 5 years. Superior DOR versus EV monotherapy suggests durable ADC-IO synergy
[Slide 3]
EV + pembrolizumab: durable survival in a frail population
What >5 years of EV-103 follow-up adds to phase III EV-302
EV-103: overall survival, pooled analysis
[Embedded OS KM panels: Pooled DE/A/K EV+P cohort — Events/n 83/121, Median OS (95% CI), mo 27.7 (20.9, 39.6); EV monotherapy cohort — Events/n 54/73, Median OS 22.8 (16.3, 28.4); remaining embedded numbers too small to read]
EV-302: OS, cisplatin-ineligible subgroup (ASCO 2025, Powles et al) [embedded KM, values illegible]
EV-302: DOR, cisplatin-ineligible (van der Heijden et al. 2024) [embedded KM, values illegible]
• Small phase Ib/II study, yet the basis for EV in earlier lines
• Phase III EV-302 confirmed EV-103, incl. cisplatin-ineligible patients
• Long-term survival is attainable in a traditionally frail population
“ Long-term benefit makes EVP the current benchmark.
[Slide 4]
SKB264-II-06: a next-generation TROP2-directed option
Activity is encouraging, but the clinical value lies in differentiation
Enfortumab vedotin — Target: Nectin-4; Payload: MMAE microtubule inhibitor
Sacituzumab tirumotecan — Target: TROP2; Payload: belotecan-derived topoisomerase I inhibitor; Bifunctional linker for maximal payload delivery
Combined with pembrolizumab — ADC cytotoxicity + immune activation: potential synergy
Phase 2 Study 2870-002/SKB264-II-06 (NCT05642780)
[Embedded schematic - small print: Key Eligibility Criteria for UC Cohort (largely illegible); Sac-TMT [illegible dose] + Pembrolizumab 400 mg IV Q6W; N = 40; Endpoints — Primary: Safety including AEs and AEs leading to treatment discontinuation; ORR per RECIST v1.1 by investigator; Secondary: DCR, DOR, PFS per RECIST v1.1 by investigator; OS]
PFS by TROP2 and PD-L1 [embedded KM panels; values illegible]
• In the overall cohort, median PFS was 11.2 (95% CI, 5.8–NR) months and median OS was NR (95% CI, 17.2 mo to NR)
Caution: N=40, 60% upper tract, 93% Asian; comparison with EVP requires phase III.
UroToday.com@urotoday
1) Trial design schema: Study schema: 3+3 dose escalation of CBM588 with nivolumab/ipilimumab · 2) Slide: Best overall response by CBM588 dose level with nivolumab/ipilimumab in mRCC · 3) Kaplan-Meier survival data: Progression-free survival with CBM588 plus nivolumab/ipilimumab · 4) Slide: CBM588 + nivolumab/ipilimumab in metastatic RCC: baseline and on-treatment sMAdCAM-1 levels
CBM588 + Nivolumab/Ipilimumab in Metastatic RCC: First Results of a Dose-Escalation Study. Presented by Dr. Ali Moradi @cityofhope. #ESMO26 written coverage by @rksayyid @UAUrology > https://t.co/9rkk0K3Xx3 #KidneyCancer #RCC #Immunotherapy @myESMO https://t.co/gk4dmSRHok
[Slide 1]
STUDY SCHEMA
3+3 Dose-Escalation of CBM588 With Nivo/Ipi in mRCC
Population: Patients with treatment-naïve metastatic clear cell RCC, with or without sarcomatoid features, across all IMDC risk groups, with measurable disease per RECIST 1.1, initiating first-line systemic therapy.
• Nivolumab: 3 mg/kg q3w ×4 → 480 mg q4w
• Ipilimumab: 1 mg/kg q3w ×4
• Correlative Studies
○ Stool: Baseline, Week 13
○ Peripheral blood cytokines + MADCAM-1: Baseline, on-treatment (Luminex)
DL1: 4 x 10^8 CFU bid 0/3 DLT
DL2: 1.2 x 10^9 CFU bid 0/3 DLT
DL3: 4 x 10^9 CFU bid 0/6 DLT
[Slide 2]
Figure 1. Best overall response by CBM588 dose level
Number of patients
DL1: PR 1, SD 2 33.3% ORR (1/3)
DL2: SD 3 0% ORR (0/3)
DL3: CR 1, PR 6, SD 4, PD 5 43.8% ORR (7/16)
CR PR SD PD
Overall ORR: 36.4% (8/22)
[Slide 3]
Figure 2. Progression-free survival
A Overall cohort (n=22)
Median PFS: 5.5 months
95% CI: 2.6 - NE
Median follow-up: 15.9 months
Progressions: 12/22
B Dose level 3 (n=16)
Median PFS: 5.5 months
95% CI: 2.6 - NE
Median follow-up: 12.3 months
Progressions: 8/16
Progression-free Survival Probability
Time (months)
Number at risk
Survival table
Endpoint: PFS
Arm | N | Median | Median CI
Overall cohort | 22 | 5.5 months | 2.6 - NE
Dose level 3 | 16 | 5.5 months | 2.6 - NE
[Slide 4]
Figure 3. Baseline and on-treatment sMAdCAM-1 levels in responders and non-responders
Responders
Non-responders
sMAdCAM-1 (ng/mL)
Timepoint
C1D1 C3D1 C5D1
Responders table:
ng/mL | C1D1 | C3D1 | C5D1
Mean | 234 | 231 | 269
Median | 205 | 217 | 252
Non-responders table:
ng/mL | C1D1 | C3D1 | C5D1
Mean | 215 | 209 | 243
Median | 209 | 234 | 279
Legend: Baseline and on-treatment plasma sMAdCAM-1 levels by response status. Serial measurements at C1D1, C3D1 and C5D1 in responders (n=6; blue) and nonresponders (n=12; gray). Lines connect measurements from individual patients. Dashed horizontal lines indicate the 180 ng/mL reference level. Mean and median concentrations (ng/mL) are shown below each panel.
UroToday.com@urotoday
1) Response data: [68Ga]Ga-DPI-4452 PET/CT Cohort A: correlation of tumor uptake with CAIX · 2) Slide: [68Ga]Ga-DPI-4452 vs FDG Cohort B: patient characteristics and lesion distribution
Diagnostic and Staging Performance of CAIX-Targeted [68Ga]Ga-DPI-4452 PET/CT in Clear Cell Renal Cell Carcinoma: A Prospective Trial. Presented by Liangyou Gu, MD. #ESMO26 written coverage by @rksayyid > https://t.co/8D8yHKY3KI #KidneyCancer #RCC #PrecisionOncology @myESMO https://t.co/WGzX6LnwGp
[Slide 2]
Results: Cohort A
Correlation Between Tumor Uptake and CAIX Expression
Pearson r = 0.83
R2 = 0.68
P < 0.0001
Total n = 21
SUVmax value
CAIX expression (IHC H-score)
Samples / Fitted line / 95% CI
r = 0.83, P < 0.0001, n = 21
Exploratory case: Response Monitoring
SUV
After 3 months of treatment, SUVmax decreased from 32.27 to 4.12
Postoperative histopathology also showed nearly absent CAIX expression.
[Slide 3]
Results: Cohort B DPI-4452 VS FDG
TABLE1
Patient Characteristics (n = 41)
Characteristics | Value
Age (mean ± SD, years) | 62.15 ± 10.75
Gender
Male, n (%) | 27 (65.9)
Female, n (%) | 14 (34.1)
Primary/recurrence, n (%) | 21 (51.2)/20 (48.8)
Primary staging status (n=21)
T stage, n (%)
T1a/b | 2 (9.5)/3 (14.3)
T2a/b | 1 (4.8)/2 (9.5)
T3a/b/c | 6 (28.6)/2 (9.5)/1 (4.8)
T4 | 4 (19.0)
N stage, n (%)
N0 | 16 (76.2)
N1 | 5 (23.8)
M stage, n (%)
M0 | 9 (42.9)
M1 | 12 (57.1)
AJCC staging, n (%)
I | 3 (14.3)
II | 2 (9.5)
III | 4 (19.0)
IV | 12 (57.1)
Lesion distribution
Total = 612
Kidney (n=34)
Lung (n=330)
Bone (n=123)
Lymph node (n=69)
Muscle (n=18)
Adrenal gland (n=15)
Pancreas (n=14)
Tumor thrombus (n=9)
UroToday.com@urotoday
1) Mechanism of action: SYNC-T SV-102 Figure 1: proposed mechanism of action · 2) Kaplan-Meier survival data: SYNC-T SV-102 phase 1: overall survival KM, all patients (N=15) · 3) Kaplan-Meier survival data: SYNC-T SV-102 phase 1: OS KM by HS vs CRPC · 4) Safety data: SYNC-T SV-102 phase 1: adverse events bar chart (N=15)
Long-term follow-up of Overall Survival in Patients with Metastatic #ProstateCancer from the Phase 1 Trial of SYNC-T SV-102 #Immunotherapy. Presented by Dr. Carlos Vargas. #ESMO26 written coverage by @zklaassen_md > https://t.co/3320QQSTbH #mCRPC @myESMO https://t.co/yE3xlFGKqU
[Slide 1]
Figure 1. Proposed mechanism of action of SYNC-T Therapy SV-102
PATIENT-SPECIFIC TUMOR ANTIGENS RELEASED
TUMOR
+
DRUG AND TUMOR ANTIGENS SYNCHRONIZE LOCATION AND ACTIVATE THE IMMUNE SYSTEM
TUMOR
=
Created in BioRender
1 Partial cryolysis of a single target tumor to release a heterogeneous population of patient-specific tumor antigens
2 Through same device, a multi-target drug is infused into the same tumor. Antigens & drug drain into TDLNs, synchronizing location with immune cells
3 Co-localization can create conditions for T cell activation and systemic anti-tumor response while minimizing systemic drug exposure & toxicity
[Slide 2]
Overall survival probability (%) / Time (months)
Number of patients: 15
Number of events: 6
Median (95% CI): NA (27.9, NA)
n: 15 13 12 3 0 (at 0, 10, 20, 30, 40 months)
Survival table
Endpoint: Overall survival
Arm | N | Median | Median CI
All patients | 15 | NA (not reached) | 27.9, NA
[Slide 3]
Overall survival probability (%) / Time (months)
Number of patients: 5 [HS]; 10 [CRPC]
Number of events: 0 [HS]; 6 [CRPC]
Median (95% CI): NA (NA, NA) [HS]; 27.9 (17.1, NA) [CRPC]
Legend: HS | CRPC
n (CRPC): 10 8 7 2 0
n (HSPC): 5 5 5 1 0
(at 0, 10, 20, 30, 40 months)
Survival table
Endpoint: Overall survival by disease state
Arm | N | Median | Median CI
HS (hormone-sensitive) | 5 | NA | NA, NA
CRPC | 10 | 27.9 | 17.1, NA
[Slide 4]
Grade 1–2 | Grade 3
Hematuria 4 (26.7%)
Fever 3 (20.0%)
Diarrhea 2 (13.3%)
Vomiting 2 (13.3%)
Urinary tract infection 2 (13.3%)
Diaphoresis / hyperhidrosis 2 (13.3%)
Rash 2 (13.3%)
Urinary retention 2 (13.3%)
Spinal cord compression 1 (6.7%)
Patients with event, % (N=15)
OncoDaily@oncodaily
Slide: OncoDaily Grand Rounds Bladder Cancer Edition: audience poll on where to invest first
The Bladder Cancer Edition at ESMO26 has come to a close!
Thank you to our speakers and everyone who joined us for insightful discussions on recent advances and future directions in bladder cancer care.
@DrFelixGuerrero @DrUddiGoswami @JaviMolinaC https://t.co/DWqcsUnx2n
Active poll
If you could fund only one improvement this year, where would you invest first to improve bladder cancer outcomes?
Early diagnosis, staging and MDT referral | 47%
Perioperative systemic therapy access | 33%
Surgery / radiotherapy / bladder-preservation capacity | 13%
Modern metastatic therapy / maintenance / diagnostics | 7%
[respondent count icon: 15]
Gustave Roussy@GustaveRoussy
Slide: Novel AR-targeted therapies in mCRPC - 'Still Hooked on the Receptor' (Alice Bernard-Tessier)
🔹 Gustave Roussy at #ESMO26 🔹
Dr Alice Bernard-Tessier on Novel AR-targeted therapies at @myESMO.
#ESMO https://t.co/CpJlOJQzOE
Still Hooked on the Receptor
Androgen Receptor (AR) targeted therapies are the mainstay of prostate cancer
Resistance to 2nd generation AR pathway inhibitor (ARPI) is still driven by AR
What comes after abiraterone, enzalutamide, apalutamide, and darolutamide ?
[Diagram: Androgen synthesis: adrenal glands; Androgen activity: e.g. prostate; hypothalamus-pituitary-testes axis; small labels illegible]
All "-lutamide" ARPIs bind to the androgen receptor
[AR structure: Ligand-binding domain; DNA-binding domain; N-terminal domain]
Alice BERNARD-TESSIER, MD
Watson et al., Nat Rev Cancer 2015
UroToday.com@urotoday
Kaplan-Meier survival data: ProBio platform: niraparib vs physician's choice — time to no longer
Niraparib + Abiraterone and Prednisone in #mCRPC: Results from the ProBio Platform Trial. Presented by Alessio Crippa, PhD, #ESMO26 written coverage by @zklaassen_md > https://t.co/7yDe2BLfQZ #ProstateCancer #PrecisionOncology @myESMO https://t.co/F3Yu3s0REi
1) Trial design schema: Study design: native prompting vs multi-agent LangGraph pipeline for EAU · 2) Slide: Therapy-decision accuracy and Cohen's kappa by LLM: native prompting vs multi-agent pipeline · 3) Slide: Therapy-decision accuracy by therapy option: native vs agentic LLM pipelines (prostate cancer)
Multi-Agent vs Native LLM Pipelines for Guideline-Compliant #ProstateCancer Therapy: Benchmarking Six Open-Weight Models. Presented by Dr. Jonathan Jeutner, #ESMO26 written coverage by @zklaassen_md > https://t.co/uBeInnMlPu #AI #GUOnc @myESMO https://t.co/Jr4TsiQ6zU
[Slide 1]
127 synthetic localised PCa cases, all EAU 2025 risk groups (low → N1)
ground truth per case: 8 therapy options rated STANDARD / WEAK / NONE by 2 senior uro-oncologists (consensus)
Native prompting
one LLM call per case
full instructions + answer schema
no tools
answers from training knowledge
Multi-agent pipeline (LangGraph)
Agent 1 · Risk: PSA, cT, ISUP, cN → EAU risk group
Agent 2 · Section finder: guideline chapters
Agent 3 · Navigator: text + recommendation tables
Agent 4 · Classifier: STANDARD / WEAK / NONE
EAU 2025 guideline PDF
5 navigation tools:
– table of contents
– list subsections
– structure query
– full-text search
– read section
Same cases through both arms with 6 open-weight LLMs served on-premises
Qwen3.6-27B · DeepSeek-V4-Pro · Kimi-K2.5 · DeepSeek-V4-Flash · Qwen3-VL-8B · GPT-OSS-120B
Endpoint: accuracy over 1,016 binary therapy decisions per model (STANDARD vs not)
Cohen's κ · McNemar test agentic vs native, paired per decision
[Slide 2]
A by model (8 therapy decisions per case, 1,016 per model)
Native prompting | Multi-agent pipeline
Qwen3.6-27B | 83.3 % | 98.0 %
DeepSeek-V4-Pro | 78.1 % | 96.8 %
Kimi-K2.5 | 82.9 % | 96.4 %
DeepSeek-V4-Flash | 78.6 % | 94.8 %
Qwen3-VL-8B-Thinking | 80.0 % | 87.8 %
GPT-OSS-120B | 79.9 % | 87.6 %
Accuracy of the therapy decisions (%)
B agreement with the ground truth
Qwen3.6-27B | 0.61 | 0.95
DeepSeek-V4-Pro | 0.49 | 0.91
Kimi-K2.5 | 0.57 | 0.90
DeepSeek-V4-Flash | 0.48 | 0.86
Qwen3-VL-8B-Thinking | 0.54 | 0.68
GPT-OSS-120B | 0.53 | 0.67
Cohen's κ vs ground truth
[Slide 3]
C by therapy option
native → agentic, pooled over the six models | range across models, native | range across models, agentic
| native | agentic
WW (0/127) | 100.0 % | 95.7 %
AS (8/127) | 97.5 % | 97.2 %
RPE (92/127) | 92.2 % | 90.2 %
EBRT (0/127) | 11.6 % | 93.9 %
LDR-B (9/127) | 77.9 % | 90.8 %
ADT-M (0/127) | 99.9 % | 96.7 %
EBRT+ADT (119/127) | 77.9 % | 91.0 %
EBRT+ADT+APP (24/127) | 86.8 % | 92.6 %
Accuracy of the therapy decisions (%)
UroToday.com@urotoday
1) Trial design schema: SURE-02 study design: neoadjuvant sacituzumab govitecan + pembrolizumab · 2) Kaplan-Meier survival data: SURE-02 event-free and overall survival curves, ITT population · 3) Kaplan-Meier survival data: SURE-02 event-free and overall survival by clinical complete response · 4) Safety data: SURE-02 treatment-related and immune-related adverse events tables (N = 49)
SURE-02: Overall Survival and Mature Safety of Neoadjuvant Sacituzumab Govitecan + Pembrolizumab with Response-Adapted Bladder Sparing in #MIBC. Presented by Deborah Serafin @SanRaffaeleMI. #ESMO26 written coverage by @zklaassen_md > https://t.co/s13t0nQQlf #BladderCancer #MIBC @myESMO
Biomarker data: SunRISe-1 Cohort 2 Figure 2: swimmer plot of response to gem-iDRS monotherapy with utDNA
Baseline and On-Treatment utDNA Molecular Residual Disease and Response to Gemcitabine Intravesical System in SunRISe-1: Updated Analysis. Presented by @DrFelixGuerrero. #ESMO26 written coverage by @zklaassen_md > https://t.co/UjW3XPm0lD #BladderCancer #NMIBC @myESMO https://t.co/zZXmZkm4Ky
Figure 2: Response to gem-iDRS monotherapy in SunRISe-1 Cohort 2 among patients who had sequenced urine samples (N=58)
Best overall response
[Swimmer plot: one bar per patient, treatment time 0–39 months]
Best overall response
CR ≥12 months
CR <12 months
Non-CR
Not evaluable
Response assessment
CR
Non-CR
Not evaluable
utDNA MRD status
Positive
Negative
Status
On treatment
CR
Treatment time (months)
0 3 6 9 12 15 18 21 24 27 30 33 36 39
UroToday.com@urotoday
1) Trial design schema: SWOG S1937 methods schema: eribulin + gemcitabine vs standard of care · 2) Kaplan-Meier survival data: SWOG S1937 overall survival curve: physician choice chemo vs eribulin · 3) Kaplan-Meier survival data: SWOG S1937 progression-free survival curve: physician choice chemo · 4) Safety data: SWOG S1937 grade 3-4 treatment-related adverse events table, SOC vs eribulin +
Phase III SWOG S1937: Eribulin + Gemcitabine vs. Standard of Care in Refractory Metastatic #UrothelialCarcinoma. Presented by @SarmadSadeghi @USC. #ESMO26 written coverage by @rksayyid @UAUrology > https://t.co/MG7M7EwqGd #BladderCancer #ClinicalTrials @myESMO https://t.co/HVa2KqTMnm
Wearable-Derived Physical Activity and Patient-Reported Fatigue and Sleep Differ by Hot Flash Severity Levels During Initial Treatment Phase in LIBERTAS Trial. Presented by @CaPsurvivorship @DanaFarber. #ESMO26 written coverage by @zklaassen_md > https://t.co/yPCepnzfOB @myESMO #ProstateCancer #mCSPC #DigitalHealth
[Slide 3]
Figure 3: Daily life activity behavior in the ITP ADT-naïve subgroup.
Panels: Low HF severity | High HF severity
Top row Y-axis: Mean ± SEM awake sedentary time (min/d); Bottom row Y-axis: Mean ± SEM awake MVPA time (%)
X-axis timepoints: Baseline, C4D1, C7D1
[Line plots with error bars; no data values printed]
[Slide 4]
Figure 4: Daily life activity behavior in the ITP HF-emergent subgroup.
Panels: Low HF severity | High HF severity
Top row Y-axis: Mean ± SEM awake sedentary time (min/d); Bottom row Y-axis: Mean ± SEM awake MVPA time (%)
X-axis timepoints: Baseline, C4D1, C7D1
[Line plots with error bars; no data values printed]
UroToday.com@urotoday
1) Trial design schema: Study schema: epigenomic liquid biopsy (chromatin IP) in 48 patients on EV + · 2) Slide: ERBB3 promoter signal (normalized RPM) pre vs post EV + pembrolizumab in individual patients · 3) Slide: Heatmap of actionable gene promoter signals by response group (CR, PR, SD, PD) in metastatic
Functional Epigenomic Liquid Biopsy to Guide Treatment at EV + Pembrolizumab Resistance in Metastatic Urothelial Carcinoma: Emerging Role of ERBB3. Presented by @OncoBellmunt @DanaFarber_GU. #ESMO26 written coverage by @zklaassen_md > https://t.co/dLyV998gxq #BladderCancer #GUOnc @myESMO
Phase Ib/2 #KEYNOTE365: adding #pembrolizumab to carbo/etop in #NEPC showed encouraging efficacy (ORR 28% vs 15%; OS 10.2 vs 7.1 mo, HR 0.33). Promising signal in a challenging disease with limited treatment options. @OncoAlert #ESMO26 @TiansterZhang https://t.co/SP2imaem5P
1) Slide: VOLGA EFS/OS slide at OncoDaily Grand Rounds, partially occluded by speaker · 2) Slide: VOLGA EFS by BICR and OS (durvalumab + EV vs control) at OncoDaily Grand Rounds - wide shot
Happening now!
Dr Andrea Necchi (@AndreaNecchi) presenting at the OncoDaily Grand Rounds at ESMO 2026: Bladder Cancer Edition during ESMO26 annual meeting.
Dr Necchi discusses the current treatment, ongoing clinical trials and research opportunities in MIBC and NMIBC, real world applications and treatment deescalation strategies and interpretation of molecular markers and whether they should serve for clinical decision making during his state of the art lecture.
@myESMO
1) Slide: Case-based MIBC panel slide: 'Who sees the patient first — and when?' (OncoDaily session) · 2) Trial design schema: Audience poll during MIBC case panel: treatment strategy
Bladder Cancer Edition during ESMO26 panel discussion right now real world scenarios gaps in treatment access role of mdt and physician consensus finding the optimal option for patients from different socioeconomic backgrounds.
@DrFelixGuerrero @DrUddiGoswami @JaviMolinaC https://t.co/YhIw7UBSiK
[Slide 2]
[...]2 • MUSCLE-INVASIVE BLADDER CANCER
[...]o sees the patient first — and when?
[...]e patient
[...]-year-old man, cT2N0M0 muscle-invasive urothelial [c]arcinoma
[E]COG 1; eGFR 42 mL/min/1.73 m2
[N]o distant disease on staging
[Ci]splatin-ineligible based on renal function
[Po]tential candidate for radical local therapy
Start with Félix (Urology)
When is he referred to medical oncology?
Who discusses treatment first?
How does the MDT choose radical cystectomy versus bladder-preserving chemoradiation?
[Slide 4]
Active poll
For this patient, assuming all suitable options are available, wh[ich] strategy would you select?
EV + pembrolizumab [bar, percentage cut off]
Clinical trial / individualized alternative 13%
Platinum-based chemotherapy → maintenance if eligible 6%
Another guideline-supported strategy 0%
[...]349
[Slide 1]
WUTSUP-02: Background
• UTUC is frequently invasive at diagnosis with high recurrence risks, and its neoadjuvant chemotherapy pCR rate is generally lower than that of bladder cancer; Furthermore, Renal function impairment and cisplatin ineligibility limit treatment options for many UTUC patients, highlighting an urmet need for novel perioperative strategies
• This phase II study aimed to explore the efficacy and safety profile of neoadjuvant Disitamab vedotin (DV, a HER2-targeting ADC) combined with perioperative Tislelizumab (a PD-1 inhibitor) in high risk, non-metastatic UTUC with HER2 expression
Yige Bao
[Slide 4]
WUTSUP-02: Survival and Safety
• With a median follow-up of 24 months (IQR, 16–30), the 2-year OS rate was 87.1%, and 2-year MFS rate was 83.9%
• The most common TRAEs included ALT/AST increased, hypoesthesia, alopecia, pruritus, and hyperglycemia
| Any grade | Grade ≥ 3
Any TRAEs | 38 (90.5%) | 20 (47.6%)
ALT/AST increased | 21 (50.0%) | 2 (4.8%)
Hypoesthesia | 17 (40.5%) | 2 (4.8%)
Alopecia | 17 (40.5%) | 0 (0.0%)
Hyperglycemia | 13 (31.0%) | 2 (4.8%)
Pruritus | 13 (31.0%) | 1 (2.4%)
[Small KM plots: Overall Survival; Metastasis-free Survival; Survival Probability vs Time (Months) 0-30]
#EV103 long-term update: EV/pembro continues to show #durable #benefit in 1L #mUC, with median DOR 29.6 mo, OS 27.7 mo, and 5-year OS of 33%. Notably, 37% of responders maintained responses at 5 years. Impressive long-term outcomes reinforcing EV/pembro as SOC. @OncoAlert #ESMO26 https://t.co/475v5feIT8
Safety profile was consistent with prior reports, with no new safety signals observed with long-term follow-up1-3
TRAEs, n (%) | EV+P (pooled DE/A/K) n=121 | EV mono (cohort K) n=73
Any TRAE | 119 (98.3) | 68 (93.2)
Any grade ≥3 TRAE | 78 (64.5) | 35 (47.9)
Any serious TRAE | 26 (21.5) | 11 (15.1)
TRAEs leading to discontinuation of EV only | 34 (28.1) | 17 (23.3)
TRAEs leading to discontinuation of P only | 24 (19.8) | –
TRAEs leading to discontinuation of both EV and P | 13 (10.7) | –
TRAE leading to discontinuation of either EV or P | 61 (50.4) | 17 (23.3)
Any TRAE leading to deatha | 4 (3.3) | 2 (2.7)
Data cutoff: February 20, 2026. Treatment relatedness was determined by the investigator, including causality to EV and/or P as applicable.
aCauses of death in the EV+P pooled DE/A/K cohort were pneumonitis (n=1), multiple organ dysfunction syndrome (n=1), respiratory failure (n=1), and sepsis (n=1). Causes of death in the EV mono cohort were respiratory failure (n=1) and multiple organ dysfunction syndrome (n=1).
DE, dose escalation; EV, enfortumab vedotin; P, pembrolizumab; TRAE, treatment-related adverse event.
1. Rosenberg JE, et al. ESMO Open. 2026;11:107700. 2. Friedlander TW, et al. ESMO 2025. Abstract 3074P (Poster). 3. O'Donnell PH, et al. J Clin Oncol. 2023;41:4107-4117.
Presented by: Dr. Jose Pablo Maroto Rey
#GDFatherNEO phase II: Adding GDF-15 inhibitor #visugromab to neoadjuvant nivolumab in MIBC improved pCR (33% vs 8%) and ORR (60% vs 15%). Encouraging early data for overcoming IO resistance, with potential implications for bladder preservation. @OncoAlert #ESMO26 @TiansterZhang https://t.co/remf8lvE8l
[Slide 3]
Event-free survival and bladder preservation
At a median follow-up of 15.7 months, no recurrence was observed after pCR
Individual patient course · All 31 treated patients
N+V (n = 16) | N+P (n = 15)
Legend: Major pathological response | pCR: pT0 | Pathological non-response | Response not assessable | Survival follow-Up
End of trial (EOT) | Recurrence | Re-TURBT | Radical cystectomy | Treatment for recurrence | Adjuvant treatment
Time from initiation of trial treatment [months] 0 2 4 6 8 10 12 14 16 18 20 22 24 26 28 30
Key findings
• No recurrence after pCR: N+V 5/5 · N+P 1/1 without recurrence; Median follow-up 15.7 months (IQR 15.1–16.5)
• Bladder preservation: 4/5 N+V patients with pCR underwent re-TURBT alone and retained their bladder
• EFS in the ITT population: 6 events, 3 per arm; median not reached
• Adjuvant therapy: Received by 5 patients, all in the N+P arm.
Prof. Andrea Necchi
[Slide 4]
Adverse event profile
No new safety signal was identified with the addition of visugromab
Adverse events in all treated patients
Patients, n (%) | N+P n = 15 | N+V n = 16
Any TEAE | 15 (100) | 16 (100)
Grade 3–4 TEAE | 12 (80) | 8 (50)
Any TRAE | 8 (53) | 14 (88)
Grade 3–4 TRAE | 3 (20) | 2 (13)
Serious TRAE | 1 (7) | 2 (13)
Immune-related AE, any grade | 4 (27) | 5 (31)
Immune-related AE, grade 3–4 | 3 (20) | 2 (13)
TRAE leading to discontinuation | 2 (13) | 0
Treatment-related death | 0 | 0
Treatment-related delay of surgery | 0 | 0
Key findings
• Any-grade TRAEs were more frequent with N+V. Grade 3–4 TRAEs and immune-related AE rates were similar between arms
• Two Grade 3–4 TRAEs with N+V, each reported in 1 pt: Immune-mediated hepatic disorder with transaminase increase; interstitial lung disease
• No treatment-related discontinuation, death or surgical delay with N+V. No postoperative complication was attributed to neoadjuvant treatment
• Most frequent TRAEs with N+V, all grade 1–2: asthenia 38%, hypothyroidism 25%, pruritus 19%
Prof. Andrea Necchi
OncoDaily@oncodaily
1) Slide: Distant photo of presented slide · 2) Slide: Partial photo of presented slide · 3) Slide: Partial photo of presented slide
Next up in the OncoDaily Grand Rounds at ESMO 2026: Bladder Cancer Edition
Sara Coca Membribes (@scocmem) presenting on whether there is an optimal duration of ADC and ICI therapy, which biomarkers are needed, and whether combination, rechallenge, or sequencing strategies work. https://t.co/vde1Q6H0CJ
1) Slide: CCTG PR21: Study Population and Questionnaire Completion Rates; Mean baseline FACT-P scores · 2) Slide: CCTG PR21: MCID Response analysis, FACT-P Total and TOI, Lu-PSMA-617 vs docetaxel
CCTG PR21 w/ imp patient-centered data: #177LuPSMA617 showed better patient-reported #QoL vs docetaxel in mCRPC, with stable #FACTP scores and fewer bothersome side effects (15% vs 41%). No significant difference in rPFS. @OncoAlert @TiansterZhang #ESMO26 https://t.co/F8XUMl961k
[Slide 1]
Results
Study Population and Questionnaire Completion rates
Randomized, N=199
n=100: 177Lutetium-PSMA-617 Received Protocol therapy: n = 94
n=99: Docetaxel Received protocol therapy: n = 95
Allocation
Baseline questionnaires: Baseline 91 received / 94 expected (96.8%) | 91 received / 95 expected (95.8%)
On-treatment questionnaire completion rates:
Lu-PSMA-617: Week 6 79.3%; Week 12 81.0%; Week 18 84.3%; Week 24 80.6%; Week 30 74.1%; Week 36 61.2%
Docetaxel: Week 6 89.2%; Week 12 86.0%; Week 18 70.1%; Week 24 75.8%; Week 30 59.0%; Week 36 32.8%
Mean baseline FACT-P Scores
[bar chart, Numerical Score 0.0–120.0; Lu-P vs Doce; Total, TOI, FACT-G, PWB, FWB, PCS, EWB, SWB]
Presenter: Dr. Daniel J. Khalaf
[Slide 3]
Results
MCID* Response analysis
FACT-P Total Score — Improved (%) / Stable (%) / Worse (%) / Missing (%)
Week 12: LU-P 28 / 30 / 28 / 14; DOCE 22 / 36 / 31 / 10
Week 24: LU-P 29 / 34 / 18 / 19; DOCE 15 / 27 / 32 / 26
% patients
Trials Outcomes Index (TOI) — Improved (%) / Stable (%) / Worse (%) / Missing (%)
Week 12: LU-P 16 / 51 / 21 / 12; DOCE 12 / 50 / 29 / 9
Week 24: LU-P 13 / 58 / 10 / 19; DOCE 6 / 42 / 26 / 26
% patients
Improved indicates increase from baseline by ≥ the MCID*
Worse indicates decrease from baseline by ≥ the MCID
MCID for Total FACT-P : 9 points
MCID for TOI: 7 points
*MCID: Minimal Clinically Important Difference
Presenter: Dr. Daniel J. Khalaf
QianJanieQin@QianJanieQin
Trial design schema: Neoadjuvant toripalimab + TIP penile SCC - Study Design & Patients (NCT06415318)
Phase II neoadjuvant #toripalimab + TIP in locally advanced #penile SCC showed promising activity (ORR 84%, pCR 48%), with 12-month EFS of 72%. Encouraging early results in a rare cancer, warranting further study. @TiansterZhang #ESMO26 https://t.co/wn1IB8GIbv
Study Design & Patients
Study Design
• Type: Multicenter, single-arm Phase II (Simon's two-stage)
• Regimen: Toripalimab (240mg d1) + TIP chemo q3w (up to 4 cycles pre-op)
• Primary endpoint: Objective response rate (ORR)
• Maintenance: Toripalimab monotherapy (up to 1 year post-op)
Patient Characteristics (N=25)
• Status: Systematic treatment-naïve
• ECOG PS: 0-2
• Stage: cT4 (1pt) or cN2 (6pts) or cN3 (18pts)
• HPV positive status: 12pts
• PD-L1 positivity (CPS≥1): 23pts
• PD-L1 high expression (CPS≥20): 15pts
The trial is registered at ClinicalTrials.gov: NCT06415318.
OncoDaily@oncodaily
Slide: cT vs pT stage discrepancy table in radical cystectomy for bladder urothelial carcinoma (cropped)
OncoDaily Grand Rounds: Bladder Cancer Edition during ESMO26 happening now!
Félix Guerrero-Ramos (@DrFelixGuerrero) presents the realities of cystectomy, challenges faced by patients and physicians and the future of bladder sparing strategies and the importance of MDT discussions in choosing the right treatment strategies for bladder cancer.
1) Slide: Clonal hematopoiesis in HRR genes on liquid biopsy and PARPi outcomes in prostate cancer · 2) Slide: CH vs HRR liquid biopsy PARPi study - Methods and patient flow - Emmanuel S. Antonarakis, ESMO26 · 3) Slide: Variant origin prediction in HRR genes (prostate cancer, F1LCDx) - Emmanuel S. Antonarakis, ESMO26
Interesting data at #ESMO26: 13% of #HRRa on liquid biopsy were predicted to be #clonal #hematopoiesis (CH). Patients with CH-only HRRa had worse outcomes on PARPi vs tumor-derived HRR alterations. Important reminder to account for CH when interpreting ctDNA in mCRPC. @OncoAlert https://t.co/ssI29dzJCn
[Slide 1]
BACKGROUND:
• CH arises from fitness-enhancing hematopoietic mutations, occasionally involving HRR genes, which may lead to false-positive results in liquid biopsies, leading to PARPi treatment in patients who do not harbor tumor-derived HRR mutations.
• In addition, CH alterations may be linked to increased risk of hematological toxicities after therapy, such as myelodysplastic syndrome and acute myeloid leukemia (MDS/AML).
• An algorithm, called "variant origin prediction" (VOP), leveraging cell-free DNA fragmentomics can help infer CH-derived variants without relying on white blood cell sequencing.
• The VOP algorithm achieves 99%, 94%, 94% sensitivity and 100%, 94%, 95% specificity in classifying germline, tumor-somatic and CH-derived short variants, respectively, at the >0.5 threshold.
AIMS:
(1) Describe the prevalence of mutations predicted of CH origin versus germline/tumor origin in HRR genes
(2) Explore the association between CH-predicted vs. germline/tumor HRR genes and outcomes to PARPi
(3) Assess changes in CH prevalence following PARPi exposure
[Diagram] VARIANT ORIGIN PREDICTION (VOP)
Instance-Specific Features: Sample features; Variant features; Fragment features
Dataset-Learned Features: Origin propensity
-> ML Based Algorithm -> Variant Origin Probabilities: Probability tumor-somatic + Probability germline + Probability clonal hematopoiesis = 100% (Probability tumor)
Brown DW, et al. J Liq Biopsy 2025; 9: 100311.
Emmanuel S. Antonarakis, MD
[Slide 2]
METHODS
• We included patients with prostate cancer and FoundationOne® Liquid CDx (F1LCDx) comprehensive genomic profiling.
• Clinical data were obtained from the US-wide deidentified Flatiron Health-Foundation Medicine clinico-genomic database, from ~280 cancer clinics (~800 sites of care), between 1/2014 - 9/2025.
• Time-to-next treatment (TTNT) and real-world overall survival (rwOS) were compared by Cox models between mCRPC pts receiving PARPi monotherapy with CH-predicted vs. germline/tumor HRR alterations in BRCA1/2, PALB2, RAD51C/D, BARD1, adjusting for clinical covariates.
• CH mutation prevalence in common CH-associated genes was compared pre- vs post- PARPi exposure.
[Flow diagram]
Aim 1. Patients with prostate cancer and F1LCDx N = 18,691
Filtering: 15,766 no clinical data
Clinical data available N = 2,925
Filtering: 1,846 did not receive PARPi
Received PARPi N = 430
Filtering: 7 missing sample collection date
Aim 3. Sample before PARPi N = 366 | Sample after PARPi N = 66*
*9 patients had paired samples
Filtering: 20 mHSPC; 61 missing information; 3 entered after PARPi therapy; 194 with no BRCA1/2, PALB2, RAD51C/D, BARD1 alteration**; 27 PARPi combo
Aim 2. PARPi monotherapy and mCRPC with HRR alteration N = 61
Emmanuel S. Antonarakis, MD
[Slide 3]
VARIANT ORIGIN PREDICTION IN HRR GENES
[Left bar chart] HRR gene alteration prevalence
Total prostate cancer patients, N = 18691
Prevalence among prostate cancer patients:
ATM 13.5% (n=2523); CHEK2 10.3% (n=1922); BRCA2 6.4% (n=1193); CDK12 3.7% (n=685); BRCA1 1.6% (n=298); PALB2 0.9% (n=164); BRIP1 0.5% (n=95); RAD54L 0.3% (n=63); BARD1 0.3% (n=58); RAD51B 0.2% (n=45); CHEK1 0.2% (n=38); FANCL 0.2% (n=34); RAD51D 0.2% (n=33); RAD51C 0.2% (n=30); Overall HRR 32% (n=5975)
[Right stacked bar chart] Variant origin prediction by gene (mutations only)
Patients with an HRR gene mutation, N = 5632
(Germline / Tumor-somatic / CH-predicted only, % as printed)
ATM (n=2423): 9% / 15% / 76%
CHEK2 (n=1905): 8% / 3% / 87%
BRCA2 (n=957): 40% / 53% / 7%
CDK12 (n=644): 2% / 80% / 18%
BRCA1 (n=260): 21% / 47% / 32%
PALB2 (n=156): 31% / 46% / 24%
BRIP1 (n=89): 49% / 33% / 18%
RAD54L (n=57): 74% / 21% / 5%
BARD1 (n=53): 34% / 62% / 4%
RAD51B (n=33): 52% / 33% / 15%
CHEK1 (n=35): 14% / 69% / 17%
FANCL (n=31): 58% / 42% / –
RAD51D (n=28): 43% / 39% / 18%
RAD51C (n=22): 55% / 23% / 23%
Overall HRR (n=5632): 18% / 26% / 56%
Legend: Germline mutation; Tumor-somatic mutation(s), no germline; CH-predicted mutation(s) only; Indeterminate origin
• In prostate cancer patients with detected HRR mutations (n=5,632), 56% had only CH-predicted HRR mutations, including BRCA1 (32%) and PALB2 (24%). In BRCA2, 7% were CH-derived.
Emmanuel S. Antonarakis, MD
🔴 Presented at #ESMO26 | SWOG S2200/PAPMET2 in metastatic papillary RCC
Promising signal for CABO + ATEZO vs CABO alone, but from a small study:
▪️ PFS: 25 vs 10 months, HR=0.46
▪️ ORR: 47% vs 19%
⚠️ Trial closed early due to slow accrual, with only 33 eligible pts
➡️ An encouraging signal for TKI + IO in 1L metastatic pRCC, although the small cohort limits definitive conclusions.
#RCC #KidneyCancer #ESMO2026
Progression Free Survival
Progression-Free Probability
PFS Time (Months)
PFS Events: 14
PFS Events: 9
Treatment Arm Cabo Only Cabo + Atezo
Number at risk
Cabo 10 months
Cabo/Atezo 25 months
HR 0.46
95% CI 0.22 – 0.97
One-sided P-value 0.043
Leading cancer research. Together.
SWOG
Survival table
Endpoint: PFS
Cabo Only | 16 | 10 months
Cabo + Atezo | 17 | 25 months
HR: 0.46
HR CI: 0.22 – 0.97
P: One-sided P-value 0.043
Secondary commentary
KOL infographics 61
Summary graphics that physicians, media and companies designed themselves (branded cards, redraws, watchlists and top-10 lists). They are commentary, not the presented data, so they sit here in compact form. Click a thumbnail to enlarge it on this page.
GU 61
KOL infographic: Summary card: talazoparib + enzalutamide FDA approval for HRR-mutated
FDA APPROVAL · OCTOBER 26, 2026
Talazoparib + enzalutamide approved for HRR-mutated prostate cancer
Adults with metastatic androgen pathway modulation-naïve or -sensitive disease; HRR mutation detected by an FDA-authorized test
PRIMARY ENDPOINT · RPFS
HR 0.48
95% CI 0.36–0.65; p<0.0001
MEDIAN RPFS
Talazoparib + enzalutamide
Not reached
Placebo + enzalutamide
45.8 months
TALAPRO-3
599
patients, randomized 1:1
Double-blind, placebo-controlled; all on ADT
Source: FDA, Oct 26, 2026 · NCT04821622 · OS data immature at time of rPFS analysis
KOL infographic: Phase III perioperative MIBC trials cross-trial
Six phase III trials. Six different stories.
Higher pCR does not guarantee better survival.
In muscle-invasive bladder cancer, EFS and OS matter more than impressive response rates.
Are we measuring what truly matters to patients?
@myESMO @OncoAlert @OpenMedicineHQ #ESMO26 @tompowles1 @urologysummit @Uromigos @Uroweb @urotoday
With VOLGA results coming at #ESMO26, a summary of contemporary phase III perioperative trials in muscle-invasive bladder cancer.
⚠️ Different populations and designs—avoid cross-trial comparisons. VOLGA and EV-303 importantly include surgery-alone control arms without neoadjuvant therapy.
🔑 The next challenge: identifying who truly needs adjuvant ADC therapy—and who can safely avoid it.
#BladderCancer #GUOnc @OncoAlert @BladderCancerUS
Phase III Perioperative Trials in Muscle-Invasive Bladder Cancer
pCR, Event-Free Survival (EFS) and Overall Survival (OS)
Trial (Regimen) | Patient population and treatment details | pCR rate (Experimental vs Control) % | EFS Hazard Ratio (95% CI) | OS Hazard Ratio (95% CI)
EV-303 / KEYNOTE-905 (EV + pembrolizumab) | Cisplatin-ineligible or cisplatin-refusing; cT2-T4aN0M0 or T1-T4aN1M0; Neoadjuvant: EV + pembrolizumab x 3 cycles -> RC; Adjuvant: EV + pembrolizumab x 9 cycles, then pembrolizumab to complete 1 year total | 56% vs 9% | 0.40 (0.31-0.52) | 0.50 (0.38-0.66)
EV-304 / KEYNOTE-B15 (EV + pembrolizumab) | Cisplatin-eligible; cT2-T4aN0M0 or T1-T4aN1M0; Neoadjuvant: EV + pembrolizumab x 4 cycles -> RC; Adjuvant: EV + pembrolizumab x 5 cycles, then pembrolizumab to complete 1 year total | 57% vs 33% | 0.53 (0.43-0.66) | 0.65 (0.50-0.85)
VOLGA (Durvalumab + EV) | Cisplatin-ineligible or cisplatin-refusing; cT2-T4aN0/1M0 or cT1N1M0; Neoadjuvant: Durvalumab + EV x 3 cycles -> RC; Adjuvant: Durvalumab (no adjuvant EV) | 45% vs 10% (Durva + EV vs control) | 0.51 (0.38-0.67) 24-mo rate: 64% vs 45% | 0.58 (0.40-0.83) 24-mo rate: 78% vs 69%
NIAGARA (Durvalumab + gem/cis) | Cisplatin-eligible; cT2-T4aN0M0 or T1-T4aN1M0; Neoadjuvant: Durvalumab + gem/cis x 4 cycles -> RC; Adjuvant: Durvalumab (total of 8 cycles) | 37% vs 28% | 0.68 (0.56-0.82) | 0.75 (0.59-0.96)
ENERGIZE (Nivolumab + gem/cis) [red] | Cisplatin-eligible/ineligible (split-dose allowed, GFR 50-60 mL/min); cT2-T4aN0M0 or T1-T4aN1M0; Neoadjuvant: Nivolumab + gem/cis x 4 cycles -> RC; Adjuvant: Nivolumab (total of 8 cycles) | 39.1% vs 29.6% | 0.94 (0.71-1.25) p = 0.67 | 0.88 (0.64-1.21) (descriptive)
KEYNOTE-866 (Pembrolizumab + gem/cis) [red] | Cisplatin-eligible; cT2-T4aN0M0 or T1-T4aN1M0; Neoadjuvant: Pembrolizumab + gem/cis x 4 cycles -> RC; Adjuvant: Pembrolizumab (total of 8 cycles) | 44.4% vs 35.8% | 0.88 (0.71-1.10) p = 0.14 | 1.00 (0.79-1.27) (descriptive)
Patient populations, chemotherapy regimens (including use of split-dose cisplatin), treatment duration, endpoint definitions and trial designs differ across studies. Cross-trial comparisons should be interpreted with caution.
Abbreviations: pCR, pathologic complete response; EFS, event-free survival; OS, overall survival; RC, radical cystectomy; GFR, glomerular filtration rate.
Sources: EV-303/KEYNOTE-905, EV-304/KEYNOTE-B15, VOLGA (NCT04960709), NIAGARA, ENERGIZE, KEYNOTE-866 (ESMO 2026 presentations/abstracts).
For VOLGA, a durvalumab + tremelimumab + EV arm was also studied (not shown) and met the EFS primary endpoint (HR 0.61 [95% CI, 0.47-0.80]; p = 0.0004) but did not meet OS.
Red = EFS endpoint not met
Schema and summary by Jeffrey Ryckman, MD: (LBA4) study design and 4-y MFS/PSA-PFS - KOL-made
Improved MFS w/ darolutamide in DASL-HiCaP!
📌 1,106 very high-risk prostate cancer pts, incl persistent/rising PSA after RP. Randomised to darolutamide vs placebo w/ ADT + RT.
📌 Median age 71; GS 9-10 73%; CT N+ 29%; prior RP 15%.
📌 4y MFS on conventional imaging: 95% vs 88%, HR 0.42 (95% CI 0.27-0.66). No clear OS benefit yet.
📌 All prescribed prostate/bed AND pelvic nodal RT, w/ 96 wk ADT.
📌 N+ = CT/MRI >10 mm short axis or path confirmation (PSMA PET alone insufficient if ≤10 mm).
Side note: RT dose/fx and PSMA staging use aren't reported in the abstract. #radonc #ESMO26 #PCSM
IO + EV upfront is now the SoC for MIBC!! But how much EV do we need in postOP settings? Eagerly looking forward to more data/discussion on Day 2 #ESMO26! VOLGA as the new SoC!!??!!
#gusm @myESMO #BladderCancer https://t.co/vuu0mlgkY7 https://t.co/TQSEm2YESX
Perioperative Regimens in Muscle-Invasive Bladder Cancer
Study | Population | Design (vs comparator) | N | EFS HR | 24-mo EFS | OS HR | 24-mo OS | pCR*
KEYNOTE-905 / EV-303 | Cisplatin-ineligible or refusing | Periop EV + pembro vs surgery | 344 † | 0.40 | 74.7% vs 39.4% | 0.50 | 79.7% vs 63.1% | 57.1% vs 8.6%
KEYNOTE-B15 / EV-304 | Cisplatin-eligible | Periop EV + pembro vs neoadj cis/gem | 808 | 0.53 | 79.4% vs 66.2% | 0.65 | 86.9% vs 81.3% | 55.8% vs 32.5%
VOLGA | Cisplatin-ineligible or refusing | Durva + EV: periop Durva + neoadj EV vs surgery ± adj | 695 | 0.51 | 64% vs 45% | 0.58 | 78% vs 69% | 45% vs 10%
VOLGA | Cisplatin-ineligible or refusing | Durva + Treme + EV: periop Durva + Treme + neoadj EV vs surgery ± adj | 695 | 0.61 | 60% vs 45% | Not sig. | NR | NR
KOL infographic: MV Onco cartoon infographic: EV + durvalumab
💔 EV has a new partner!
PEMBRO: “Another checkpoint inhibitor?!” 😳
EV: “We have survival data TOO!” ❤️
🔥 VOLGA | ESMO 2026
EFS HR 0.51 | OS HR 0.58
But PEMBRO isn't out of the picture!
KEYNOTE-905: EFS HR 0.40 | OS HR 0.50
Two promising perioperative partnerships in cisplatin-ineligible MIBC.
⚠️ Different trials. No head-to-head comparison.
@myESMO @OncoAlert #MVOnco #ESMO2026 #BladderCancer
EV HAS A NEW PARTNER!
From Pembrolizumab to Durvalumab - The VOLGA Affair!
MV Onco
EV ♥ PEMBRO
[Cartoon: couple labelled EV and PEMBRO at a cafe] CAFÉ
An established partnership!
"EV! You're dating ANOTHER checkpoint inhibitor?!" [PEMBRO]
"What can I say? DURVA and I have survival data TOO!" [EV]
"VOLGA! EFS HR 0.51 OS HR 0.58." [DURVA]
[Cartoon: EV walking with DURVA holding bouquet labelled VOLGA]
VOLGA | ESMO 2026
EV + DURVALUMAB
EFS HR 0.51 | OS HR 0.58
EV LEAVES BEFORE SURGERY - DURVA STAYS AFTER!
KOL infographic: KOL summary card: FDA approval of talazoparib + enzalutamide in HRR gene-mutated
JUST IN: @FDA approved talazoparib plus enzalutamide for adults with HRR gene-mutated metastatic androgen pathway modulation-naïve or -sensitive (mAPMN/S) prostate cancer, with mutations detected by an FDA-authorized test.
Approval based on TALAPRO-3 Trial led by @neerajaiims, now @DanaFarber_GU
52% reduction in the hazard of radiographic progression or death (HR 0.48; 95% CI 0.36–0.65).
5 phase III perioperative MIBC trials, with differing results.
EV-303, EV-304 and NIAGARA improved EFS/OS, while ENERGIZE and KEYNOTE-866 did not meet their EFS endpoints.
Important differences in patient populations, regimens and trial design. Cross-trial comparisons require caution.
#ESMO26 @OncoAlert
Phase III Perioperative Trials in Muscle-Invasive Bladder Cancer
pCR, Event-Free Survival (EFS) and Overall Survival (OS)
| Trial (Regimen) | Patient population (high-level) | pCR rate (Experimental vs Control) % | EFS Hazard Ratio (95% CI) | OS Hazard Ratio (95% CI) |
| EV-303 / KEYNOTE-905 (EV + pembrolizumab) | • cT2–T4a (predominantly T2–3) • Cisplatin-ineligible • EV + pembro x 4 cycles → RC → adjuvant pembro | 56% vs 9% | 0.40 (0.31–0.52) | 0.50 (0.38–0.66) |
| EV-304 / KEYNOTE-B15 (EV + pembrolizumab) | • cT2–T4a (predominantly T2–3) • Cisplatin-eligible/ineligible (cohorts) • EV + pembro x 4 cycles → RC → adjuvant pembro | 57% vs 33% | 0.53 (0.43–0.66) | 0.65 (0.50–0.85) |
| NIAGARA (Durvalumab + gem/cis) | • cT2–T4a (predominantly T2–3) • Cisplatin-eligible • Durvalumab + gem/cis x 4 cycles → RC → adjuvant durvalumab | 37% vs 28% | 0.68 (0.56–0.82) | 0.75 (0.59–0.96) |
| ENERGIZE (Nivolumab + gem/cis) | • cT2–T4a (77% cT2) • Cisplatin-eligible/ineligible (split-dose allowed, GFR 50–60) • Nivolumab + gem/cis x 4 cycles → RC → adjuvant nivolumab | 39.1% vs 29.6% | 0.94 (0.71–1.25) p = 0.67 | 0.88 (0.64–1.21) (descriptive) |
| KEYNOTE-866 (Pembrolizumab + gem/cis) | • cT2–T4a (77% cT2) • Cisplatin-eligible • Pembrolizumab + gem/cis x 4 cycles → RC → adjuvant pembrolizumab | 44.4% vs 35.8% | 0.88 (0.71–1.10) p = 0.14 | 1.00 (0.79–1.27) (descriptive) |
Patient populations, chemotherapy regimens (including use of split-dose cisplatin), treatment duration, endpoint definitions and trial designs differ across studies. Cross-trial comparisons should be interpreted with caution.
Abbreviations: pCR, pathologic complete response; EFS, event-free survival; OS, overall survival; RC, radical cystectomy; GFR, glomerular filtration rate.
Sources: EV-303/KEYNOTE-905, EV-304/KEYNOTE-B15, NIAGARA, ENERGIZE, KEYNOTE-866 (ESMO 2026 presentations).
Red = EFS endpoint not met
KOL infographic: S2419 BioFront trial schema: live biotherapeutic MO-03 vs placebo added to frontline
Sumanta K. Pal, MD, FASCO@montypal
Post text
Congrats @drchoueiri @danafarber on a very well delivered presentation, encompassing a lot of the data we need to understand the "why" (i.e., toxicity burden, discontinuation, etc.).
I personally think the next phase of 1L drug development with #kidneycancer (if we are to proceed with triplets) will have to involve agents with a wide therapeutic index so administration of Drug 3 does not cause delays/interruptions w Drug 1 + 2.
In this regard, hopeful for @SWOG #S2419 (#BIOFRONT) led by @PBarataMD, investigating IO-backbone +/- #MO03 (a live bacterial product). #ESMO26 @oncoalert @brian_rini @tompowles1
S2419 | BioFront Trial
Live biotherapeutic MO-03 vs placebo added to investigator-selected frontline IO-based therapy
N = 718
1:1 randomized • double-blind
ELIGIBLE POPULATION
Advanced/metastatic RCC
Clear-cell component; not amenable to curative surgery or radiotherapy
Frontline setting
No prior systemic therapy for advanced/metastatic RCC
Assessable disease
Measurable/evaluable per RECIST 1.1
Clinical fitness
Age ≥18; Zubrod PS 0–2; adequate organ and marrow function
Key restrictions
No OTC probiotics; no systemic antibiotics within 7 days
REGISTRATION
Investigator selects the intended SOC regimen before registration
Regimen cannot be switched on study
1:1 RANDOMIZATION
Dynamic balancing
Double-blind
ARM A
SOC frontline IO-based regimen
+ blinded MO-03
Oral live biotherapeutic
ARM B
SOC frontline IO-based regimen
+ blinded placebo
Matching oral placebo
PRIMARY ENDPOINT • Investigator-assessed PFS
INVESTIGATOR-SELECTED SOC OPTIONS
IO–IO: ipilimumab + nivolumab
IO–TKI: axitinib + pembrolizumab • cabozantinib + nivolumab • lenvatinib + pembrolizumab
Favorable-risk participants may not select ipilimumab + nivolumab
STRATIFICATION • IMDC risk • sarcomatoid/rhabdoid features • intended SOC type (IO–IO vs IO–TKI)
TREATMENT
Until progression, unacceptable toxicity, consent withdrawal, or protocol-defined completion
Blinded agent: up to 3 years
Follow-up for survival and long-term outcomes: up to 5 years
KOL infographic: KOL-made (LBA88) schema: MDT with or without perioperative pembrolizumab in oligometastatic
PE-PE is a fantastic study, giving us randomized data on adding pembrolizumab to MDT in oligometastatic RCC!
Phase II, open-label, multicenter trial: 85 pts with prior nephrectomy and ≤3 mets within 5y of nephrectomy or previous metastasectomy, all amenable to surgery or SABR. Randomized 2:1 favoring pembro: MDT alone (n=29) vs pembro + MDT (n=56).
Pembro 400 mg q6w x9c (1y). First dose BEFORE MDT; registry specifies MDT on C1d21-42.
At MFU 17.5 mo, median RFS was 11→ 25.4 mo (HR 0.47, 95CI 0.24-0.92, p=0.024), MDT alone→ pembro + MDT. 35 RFS events, 16→ 19.
SABR 72→ 73%; surgery 28→ 23%. SABR dose/fx and per-site data weren't reported. I'd like to see those details along with local vs distant relapse.
Any AE 21→ 80%; G3 AEs 3→ 7%. The 21% control rate is with no study systemic therapy. Pembro-related AEs occurred in 59%, including G3 in 2 pts; no G4/5 pembro-related events were reported. Four pts stopped pembro for AEs.
Both groups received MDT, so the randomized question is what pembro adds. This doesn't establish the benefit of MDT itself or RT-ICI synergy. With 1 death/arm and no QoL results reported, an OS/QoL benefit remains unestablished.
I'd also like the prior systemic therapy history and the timing/burden at first metastatic presentation. The eligibility window alone doesn't tell us whether these pts were oligometastatic from the outset.
Congratulations to the investigators on this important work!
https://t.co/i8P1uvW9y4
#radonc #ESMO26 #RCC
KEYNOTE-905 vs VOLGA | EV has two partners in MIBC!
Both perioperative strategies improve EFS and OS in cisplatin-ineligible MIBC.
🔹 KEYNOTE-905: EV + pembrolizumab, with postoperative EV.
🔹 VOLGA: EV + durvalumab, without postoperative EV.
The key difference? Postoperative EV — 6 cycles vs NONE!
⚠️ Different trials, different designs. Cross-trial comparisons cannot establish superiority.
@myESMO @OncoAlert #ESMO26 #BladderCancer #MIBC #MVOnco
My one-slide summary of the key GU oncology trials presented at #ESMO26!
Lots of exciting data and important discussion points across UC, RCC, and prostate cancer.
My personal TOP 3:
🥇 VOLGA
🥈 LITESPARK-011 & 012
🥉 JNJ-6143
What were your highlights from ESMO 2026? https://t.co/JEg2kYYhDB
🚨 Perioperative immunotherapy in MIBC at #ESMO2026. Three phase III trials, three different answers, and one uncomfortable lesson for those of us who report pCR. 🔬
📊 NIAGARA (durvalumab + GC, n=1,063): pCR 37.3%, EFS HR 0.68 (0.56–0.82), OS HR 0.75 (0.59–0.95) ✅
📊 KEYNOTE-866 (pembrolizumab + GC, n=907): pCR 44.4%, EFS HR 0.88 (0.71–1.10), OS HR 1.00 (0.76–1.27) ❌
📊 CA017-078 (nivolumab + GC, n=653): pCR 39.1%, EFS HR 0.94 (0.71–1.25), OS HR 0.88 (0.64–1.21), OS immature ❌
Cross-trial, not head to head. Populations, schedules, follow-up (34 to 55 months) and statistical design all differ, so the ranking is exploratory.
But look at the direction. The trial with the highest pCR returned an OS hazard ratio of exactly 1.00. 🧠
Three points from the pathology side:
1️⃣ pCR is a response marker, not a surrogate. Comparable absolute pCR gains of roughly 9 to 10 points across all three, divergent survival. If pCR tracked cure, that pattern should not be possible. pCR remains elusive at least for standard chemotherapy plus IO.
2. And pCR itself is not standardised across trials. ypT0N0 depends on sampling protocol, block numbers, regression assessment and whether review is central or local. The NIAGARA figure quoted here comes from a reanalysis, which tells you the endpoint moved on re-review. A 9-point difference is not comfortably above that measurement noise.
Also worth noting: NIAGARA and KEYNOTE-866 both gave adjuvant IO, CA017-078 did not. So adjuvant continuation alone does not explain the split either. We genuinely do not know why these diverged. 🎯
Which is the real message. We are comparing trials on an endpoint we produce, that is not validated, not standardised, and not stratified by biology. Fixing that is a pathology job, and it is overdue. We need that now more than ever with neoadjuvant systemic phase becoming SOC.
@OncoAlert @DrChoueiri @tompowles1 @apolo_andrea @neerajaiims @montypal @Silke_Gillessen @AOmlin @brian_rini @PGrivasMDPhD @TiansterZhang @amerseburger @DrDanielHeng @HHammersMD @scocmem @AndreaNecchi @AmandaNizamMD @drenriquegrande @nataliagandur @AlbigesL @cdanicas @declangmurphy @seanmmcbride @shilpaonc @DrRanaMcKay @scserendipity1 @DrYukselUrun @ravikanesvaran @BraunMDPhD @EfstathiouEleni @mzugman @crisbergerot
#Uropathology #BladderCancer #blcsm #MIBC #pathtwitter
Great summary below from Niklas Klümper.
Perioperative immunotherapy in MIBC
Phase III cross-trial comparison (non-head-to-head)
Similar study populations, but important differences in design, treatment arms and follow-up.
Cross-trial comparisons are exploratory and should be interpreted with caution.
NIAGARA Durvalumab
N = 1,063
cT2–T4a, N0/N1, M0 (resectable MIBC)
D + GC (4 cycles) | RC | Adjuvant D (up to 1 year)
pCR 37.3% (reanalysis) 95% CI 32.6–42.0
EFS HR 0.68 (95% CI 0.56–0.82) ↓ 32% risk reduction
OS HR 0.75 (95% CI 0.59–0.95) ↓ 25% risk reduction
KEYNOTE-866 Pembrolizumab
N = 907
cT2–T4a, N0/N1, M0 (resectable MIBC)
P + GC (4 cycles) | RC | Adjuvant P (up to 1 year)
pCR 44.4% 95% CI 40.3–48.6
EFS HR 0.88 (95% CI 0.71–1.10) → not significant
OS HR 1.00 (95% CI 0.76–1.27) → not significant
CA017-078 Nivolumab
N = 653
cT2–T4a, N0, M0 (resectable MIBC)
N + GC (4 cycles) | RC | No adjuvant nivolumab
pCR 39.1% 95% CI not shown
EFS HR 0.94 (95% CI 0.71–1.25) → not significant
OS HR 0.88 (95% CI 0.64–1.21) → not significantᵃ
Selected trial characteristics
Adjuvant immunotherapy | Yes (durvalumab) | Yes (pembrolizumab) | No
Primary endpoints | EFS and OS (positive) | EFS and OS (not significant) | EFS and pCR (not significant)
Median follow-up | ~34 months | ~41 months | ~55 months
Key takeaway: similar ~9–10 percentage-point pCR gains across trials, but only NIAGARA demonstrated statistically significant EFS and OS benefit.
Cross-trial comparison; not head-to-head. Trial designs, patient populations and follow-up differ.
pCR = pathological complete response; EFS = event-free survival; OS = overall survival; RC = radical cystectomy; GC = gemcitabine/cisplatin.
ᵃ OS immature at the EFS final analysis.
Sources: NIAGARA (Powles et al., NEJM 2024; reanalysis data), KEYNOTE-866 (ESMO 2026, LBA), CA017-078 (ESMO 2026).
@niklas_kluemper
KOL infographic: KEYNOTE-905 'what does EV add to pembrolizumab?' summary graphic
🔬 Great summary by @niklas_kluemper on KEYNOTE-905/EV-303 at #ESMO2026. Let me add the pathology angle, because his key question is ours to answer.
The ad hoc analysis, 255 concurrently randomised, cisplatin-ineligible:
📊 2-yr EFS 41% / 56% / 76% (cystectomy / pembro / EV+P) 🔬 pCR 10% / 25% / 59% 📉 EFS HR 0.71 (0.47–1.07) for pembro, 0.40 (0.25–0.65) for EV+P ⚠️ Grade ≥3 TEAEs 42% / 70% / 69%
Two things I keep coming back to 🧠
1️⃣ The toxicity numbers look reassuring and are not. 70 vs 69% grade ≥3 says EV adds no extra severe events, but a single rate collapses two very different profiles. Neuropathy, skin and metabolic toxicity in a curative-intent setting are not interchangeable with immune-related events, and they persist in survivors. Equal rates, unequal consequences.
2️⃣ 41% of patients on EV+P still have residual disease. We will not find them just with a IHC cutoff. Membranous Nectin-4, read on the membrane only, together with histological subtype and divergent squamous differentiation, is the most informative combination we already have and routinely leave unmeasured.
And a pathology point that follows directly: once pCR carries this much weight, ypT0N0 at cystectomy becomes a high-stakes diagnosis. Thus, Sampling protocols and regression assessment need to be standardised and centrally reviewed, not left to local practice. 🎯
Also worth stating plainly: this is an ad hoc comparison, not a powered head-to-head. Pembro alone did not separate from surgery here (CI crosses 1). Interpret the three-arm ranking accordingly.
Looking forward to Sunday's symposium. 🎤
ESMO 2026 | KEYNOTE-905/EV-303 | Abstract 4733O
@niklas_kluemper @OncoAlert @DrChoueiri @tompowles1 @apolo_andrea @neerajaiims @montypal @Silke_Gillessen @AOmlin @brian_rini @PGrivasMDPhD @TiansterZhang @amerseburger @DrDanielHeng @HHammersMD @scocmem @AndreaNecchi @AmandaNizamMD @drenriquegrande @nataliagandur @AlbigesL @cdanicas @declangmurphy @seanmmcbride @shilpaonc @DrRanaMcKay @scserendipity1 @DrYukselUrun @ravikanesvaran @BraunMDPhD @EfstathiouEleni @mzugman @crisbergerot
#Uropathology #BladderCancer #blcsm #pathtwitter
KEYNOTE-905: what does EV add to pembrolizumab?
ESMO 2026 ad hoc analysis: 255 patients concurrently randomised to all three arms
% of patients - Cystectomy alone / Pembrolizumab / EV + pembrolizumab
2-year EFS: 41 / 56 / 76
pCR (pT0N0): 10 / 25 / 59
Downstaging (<pT2N0): 15 / 34 / 66
0.71 EFS HR pembro vs control (0.47-1.07)
0.40 EFS HR EV-P vs control (0.25-0.65)
15.7 / 28.7 / NR median EFS (months): control / pembro / EV-P
42 / 70 / 69% grade ≥3 TEAEs: control / pembro / EV-P
Pembrolizumab alone is active - but EV more than doubles pCR (59% vs 25%) at a similar grade ≥3 AE rate
Niklas Klümper, X: @niklas_kluemper
1) KOL infographic: Part 1/4 - trial design (MV Onco infographic) · 2) KOL infographic: Part 2/4 - efficacy, 4-year MFS HR 0.42 (MV Onco infographic) · 3) KOL infographic: Part 3/4 - safety, grade >=3 AEs 43% vs 36% (MV Onco infographic) · 4) KOL infographic: Part 4/4 - cross-trial comparison vs STAMPEDE and ENZARAD
✈️ En route to Madrid for #ESMO26, landing just in time for the data to start Friday morning. Most excited for: VOLGA LBA2 in bladder cancer, INTerpath-001's first phase 3 neoantigen win, LITESPARK-011 final in kidney cancer, and DASL-HiCaP in prostate. What a week ahead 🔬 #GUonc
ESMO CONGRESS 2026
Anticipated Highlights
Madrid · October 23-27
1 INTerpath-001 · LBA1 · Sat Presidential I
Intismeran plus pembrolizumab, resected IIB-IV melanoma. First phase 3 individualized neoantigen win: recurrence risk cut 42%.
2 VOLGA · LBA2 · Sat Presidential I
Perioperative durvalumab plus neoadjuvant EV in cisplatin-ineligible MIBC. EFS/OS positive at interim; FDA priority review.
3 LITESPARK-011 · 3587O · Renal proffered
Final: belzutifan plus lenvatinib held PFS post-immunotherapy in ccRCC; OS non-significant. QoL 3595RO may shape sequencing.
4 LITESPARK-012 · 3586O · Renal proffered
First-line belzutifan combinations vs pembrolizumab plus lenvatinib in ccRCC. Missed PFS and OS endpoints.
5 DASL-HiCaP · LBA4 · Prostate late-breaking
Interim: darolutamide plus ADT with radiotherapy in very-high-risk localized prostate cancer.
6 CAPItello-281 · LBA56 · Prostate late-breaking
Updated OS: capivasertib plus abiraterone in PTEN-deficient metastatic hormone-sensitive prostate cancer.
7 Perioperative bladder cancer · Fri orals
KEYNOTE-866, ENERGIZE, and KEYNOTE-905 ad hoc: refining immunotherapy around cystectomy.
8 AI in oncology · Fri 10:15 AM + LBA20 Sat
Educational session on digital health and AI, Barcelona Hall 9 Friday morning, plus the Agendia AI digital pathology late-breaker, Bilbao Hall 3 Saturday 2:45 PM.
Cross-tumor practice changers first, then GU depth · ESMO 2026, Madrid
KOL infographic: Self-made AI-style trial highlights summary graphic
#ESMO2026 #ESMO26 @myESMO
השנתי של ESMO במדריד מציג גם השנה תמונה מורכבת של התקדמות באונקולוגיה, לצד תוצאות שעשויות לשנות את הטיפול בחלק מהגידולים, מתפרסמים גם מחקרים שליליים המזכירים לנו שלא כל שילוב טיפולי חדש אכן משפר את התוצאות הקליניות.
🏆 אונקולוגיה 🦀 הזוכים 🎉 עד כה...
1. DeLLphi-305 | סרטן ריאה מסוג תאים קטנים, מחלה נרחבת (ES-SCLC)
אחת התוצאות הבולטות היא ממחקר פאזה III שבחן הוספת tarlatamab, נוגדן דו־ספציפי המכוון ל־DLL3, ל־durvalumab כטיפול אחזקה לאחר טיפול ראשוני במחלה שלא התקדמה.
ההבדלים היו משמעותיים:
חציון ההישרדות הכוללת (mOS): 21.1 לעומת 12.7 חודשים (HR 0.42).
חציון ההישרדות ללא התקדמות (mPFS): 7.4 לעומת 1.9 חודשים (HR 0.34).
המשמעות: תוצאה מרשימה, שעשויה לבסס אפשרות טיפולית חדשה באחזקה בקו הראשון בסרטן ריאה מסוג תאים קטנים. לצד עוצמת התועלת, יהיה חשוב להעריך גם את פרופיל הרעילות, ובפרט CRS ורעילות נוירולוגית, ואת היכולת ליישם את הטיפול בשגרה.
2. VOLGA | סרטן שלפוחית השתן החודר לשריר (MIBC)
במחקר פאזה III נבחן טיפול פרי־אופרטיבי ב־enfortumab vedotin (EV) וב־durvalumab בחולים שאינם מתאימים לציספלטין או מסרבים לקבלו.
דווח על שיפור בהישרדות ללא אירוע (EFS; HR 0.55) ובהישרדות הכוללת (OS; HR 0.58), לצד שיעור גבוה יותר של תגובה פתולוגית מלאה (pCR): 45% לעומת 10%.
המשמעות: מדובר בתוצאה חשובה באוכלוסייה עם אפשרויות טיפול מוגבלות. היא מחזקת את מקומם של שילובים המבוססים על ADC ואימונותרפיה במחלה הניתנת לטיפול בכוונה מרפאת. עם זאת, חשוב להבחין בין זרועות הטיפול השונות במחקר, ובפרט בין משטר המבוסס על durvalumab לבין הוספת tremelimumab, שבה לא הודגם עדיין יתרון מובהק בהישרדות הכוללת.
3. STARBOARD | מלנומה מתקדמת עם מוטציית BRAF V600
המחקר בדק שילוב של encorafenib ו־binimetinib עם pembrolizumab לעומת pembrolizumab בלבד בקו הראשון.
התוצאות הצביעו על שיפור משמעותי:
שיעור התגובה האובייקטיבית (ORR): 70% לעומת 32.7%.
חציון PFS: 33 לעומת 3.4 חודשים (HR 0.33).
התועלת ב־PFS ובשיעור התגובה בולטת, אך הרעילות הייתה גבוהה יותר: תופעות לוואי בדרגות 3–4 דווחו ב־70% לעומת 39%. נתוני ההישרדות הכוללת עדיין אינם בשלים.
המשמעות: שילוב מבטיח במיוחד, אך עדיין נותרו שאלות לגבי מיקומו ביחס לאפשרויות אימונותרפיה משולבת אחרות ולגבי מאזן התועלת והרעילות.
4. HERIZON-GEA-01 ו־G-HOPE-001 |
טיפולים חדשים בסרטן הקיבה וה־GEJ
שני מחקרים בולטים בתחום שבו הצורך בטיפולים יעילים עדיין גדול:
HERIZON-GEA-01:
zanidatamab בשילוב כימותרפיה, עם או בלי tislelizumab, בחולים עם מחלה מתקדמת HER2
חיובית.
בזרוע הטיפול המשולש חציון OS הגיע ל־27 חודשים (HR 0.65), וכ־40% מהמטופלים היו בחיים לאחר שלוש שנים.
G-HOPE-001:
ה־ADC arcotatug tavatecan, המכוון ל־CLDN18.2, הראה שיפור בהישרדות הכוללת לעומת טיפול לבחירת הרופא: 10.2 לעומת 6.9 חודשים (HR 0.57). גם ההישרדות ללא התקדמות השתפרה.
המשמעות: שתי התוצאות מחזקות את הפוטנציאל של טיפולים ממוקדים ושל ADCs בסרטן הקיבה וה־GEJ. חשוב לזכור שמדובר באוכלוסיות שונות ובקו טיפול שונה, ולכן אין להסיק מהן על יתרון ישיר של תרופה אחת על פני האחרת.
❌ המאכזב 😞
5. KEYNOTE-866 | סרטן שלפוחית השתן החודר לשריר
במחקר נבחנה הוספת pembrolizumab לכימותרפיה מבוססת cisplatin ו־gemcitabine סביב הניתוח, בחולים המתאימים לציספלטין.
המחקר לא השיג שיפור מובהק ב־EFS (HR 0.88; p=0.1366), ולא הודגם יתרון בהישרדות הכוללת.
המשמעות: תוצאה שלילית עבור המשטר שנבדק. היא מדגישה שלא ניתן להסיק על הצלחת טיפול פרי־אופרטיבי אחד מהצלחת שילוב אחר, גם כאשר שניהם מבוססים על אימונותרפיה.
🔍 החשוד 🤨
6. INTerpath-001 | חיסון mRNA אישי במלנומה
זהו מחקר חיובי מבחינת הישרדות ללא הישנות (RFS) והישרדות
☢️ רדיותרפיה: המחקרים העיקרים 🎯
7. DASL-HiCaP | סרטן ערמונית מקומי בסיכון גבוה מאוד
במחקר פאזה III נבחנה תוספת darolutamide לטיפול הכולל דיכוי אנדרוגני (ADT) והקרנות, בחולים עם סרטן ערמונית מקומי בסיכון גבוה מאוד.
דווח על הפחתה של כ־58% בסיכון לגרורות או למוות. שיעור ההישרדות ללא גרורות (MFS) לאחר ארבע שנים היה 95% לעומת 88%.
המשמעות: תוצאה משמעותית התומכת בהעצמת הטיפול הסיסטמי בחולים המתאימים, על גבי טיפול הכולל הקרנות ו־ADT. חשוב להדגיש שהמחקר בוחן את תוספת darolutamide, ולא את יעילות ההקרנות לבדן.
8. MASTERPLAN | סרטן לבלב מקומי בסיכון גבוה
מחקר פאזה II אקראי בחן הוספת SBRT במינון 40 Gy בחמש פרקציות לכימותרפיה בחולים עם סרטן לבלב מקומי בסיכון גבוה, לרבות מחלה גבולית לנתיחות ומחלה מקומית מתקדמת.
התוצאות היו מעודדות:
חציון OS: 22 לעומת 14 חודשים (HR 0.45).
שיפור גם בהישרדות ללא התקדמות ובשליטה המקומית.
לא זוהתה עלייה ברורה ברעילות החמורה שיוחסה ל־SBRT.
המשמעות: זהו אות חיובי חשוב לתפקידה האפשרי של רדיותרפיה סטריאוטקטית בסרטן לבלב מקומי. עם זאת, המחקר כלל 74 מטופלים בלבד, ונדרש מחקר פאזה III כדי לאשר את התועלת, ובפרט את השפעתה על ההישרדות הכוללת.
9. SARON | סרטן ריאה אוליגומטסטטי
המחקר בחן הוספת רדיותרפיה קונסולידטיבית לטיפול הסיסטמי בחולים עם NSCLC אוליגומטסטטי סינכרוני ללא שינויים גנומיים בני־מטרה (AGA-negative).
נמצא שיפור בהישרדות ללא התקדמות: חציון PFS של 13.9 לעומת 8.9 חודשים (HR 0.64). גם השליטה המקומית השתפרה, עם שיעור כישלון מקומי לאחר 12 חודשים של 13% לעומת 39.5%.
אולם, לא הודגם יתרון בהישרדות הכוללת: חציון OS של 31 לעומת 28 חודשים (HR 0.99).
המשמעות: המחקר מדגים היטב את ההבדל בין שיפור בשליטה המקומית ובהישרדות ללא התקדמות לבין הארכת חיים. התוצאות אינן מבטלות את ערכה של הרדיותרפיה בחולים נבחרים, אך אינן תומכות בקביעה שתוספת טיפול מקומי משפרת OS באוכלוסייה שנבדקה.
לסיכום: לצד ההתלהבות מתוצאות חיוביות, צריך להקפיד להבחין בין מחקר פאזה III למחקר פאזה II, בין ניתוחי ביניים לתוצאות בשלות, ובין שיפור במדדי המחלה לבין הוכחה להארכת חיים.
*הסקירה משקפת את הנתונים שדווחו עד 24 באוקטובר 2026; חלק מהמחקרים עדיין דורשים מעקב נוסף ואימות של התועלת ארוכת הטווח.
[ESMO logo] ESMO 2026 Highlights – Oncology & Radiotherapy
Key Trial Results from Madrid
MADRID 2026 Shaping the future of cancer care
POSITIVE SURPRISES
DeLLphi-305 | ES-SCLC | tarlatamab + durvalumab | Large OS benefit | HR 0.42
VOLGA | MIBC | EV + durvalumab | Strong EFS/OS and pCR
STARBOARD | BRAF melanoma | Triplet therapy | Dramatic PFS and ORR
HERIZON-GEA-01 + G-HOPE-001 | Gastric / GEJ adenocarcinoma | Targeted and ADC OS gains
MIXED & DISAPPOINTING
KEYNOTE-866 | Perioperative setting | No EFS benefit
INTerpath-001 | mRNA vaccine (adjuvant) | RFS benefit observed | OS data immature
RADIOTHERAPY HIGHLIGHTS
DASL-HiCaP | Prostate cancer | darolutamide + ADT + RT | MFS benefit
MASTERPLAN | Pancreatic cancer | SBRT (in multidisciplinary approach) | Phase II | OS improvement
SARON | NSCLC (oligometastatic) | SBRT + systemic therapy | Better local control and PFS | No OS benefit
Radiotherapy remains a cornerstone of personalized, multimodal care.
Madrid, Spain | ESMO 2026 • 17–21 October
Practice-changing data. Better outcomes for patients.
KOL infographic: Bladder Cancer at a Turning Point - Rapid Oral 1 discussant summary card (Ribal, ESMO 2026)
Maria J. Ribal@MariaJRibal
Post text
Great discussions at #ESMO2026!
A pleasure to participate as an invited discussant in today’s Rapid Oral session on #BladderCancer.
From NMIBC to metastatic disease: ADCs, immunotherapy, biomarkers and patient-reported outcomes. The therapeutic landscape is changing rapidly!
But presenting new evidence is only part of the story. Putting results into context and critically assessing their clinical value is essential to understand what should change in daily practice.
Great to share the session with Britt Suelmann and @ProfSyedHussain.
Thank you @myESMO for the invitation and to all the investigators for their outstanding research! And above all : thank you to our patients for their trust.!
#UroOncology #GUOncology
ESMO CONGRESS 2026 / MADRID
Bladder Cancer at a Turning Point
RAPID ORAL 1 · THREE ABSTRACTS, THREE READINGS
01 | PHASE III · SUBGROUP | POTOMAC | Papillary-only subgroup | Consistent with the overall trial. Does not change the benefit-risk balance.
02 | PHASE III · PROs | KEYNOTE-B15 | Quality of life | Reassuring supportive evidence. Informs shared treatment decisions.
03 | PHASE II · SINGLE ARM | Disitamab vedotin + gemcitabine | Promising signal; a confirmatory randomised trial is needed.
What truly changes clinical practice?
MARIA J. RIBAL
KOL infographic: KOL-branded evidence-notes summary graphic
Seven more men in a hundred stay metastasis-free at 4 years — if circulating DASL-HiCaP rates hold.
Very high-risk localised prostate cancer: darolutamide + ADT + RT vs placebo + ADT + RT (n=1,106). 4-yr MFS 95% vs 88% (HR 0.42, 95% CI 0.27–0.66); OS not clear at interim. Absolute Δ +7 pp · NNT ≈14. Confirm at PS I (Niazi). #ESMO26 #LBA4 @zklaassen_md @jryckman3 @niazi_Dr7
drozdogan.com · Evidence Notes #ESMO26 · LBA4
DASL-HiCaP
Very high-risk localised prostate cancer
darolutamide + ADT + RT vs placebo + ADT + RT
⚠ Circulating LBA figures · confirm at PS I (Niazi)
DESIGN
n = 1,106 · ANZUP1801 · mFU 3.8 yr · 85% definitive RT
96 wk ADT · prostate/bed + pelvic nodal RT · presenter Niazi
WHO WAS IN
GS 9–10 73% | cN+ 29% | prior RP 15% | median age 71
PRIMARY · 4-YEAR MFS (conventional imaging)
Daro 95%
PBO 88%
ABSOLUTE Δ +7 pp at 4 years
RELATIVE (MFS) HR 0.42 · risk ↓ ~58%
HAZARD RATIO · MFS
0.42 (95% CI 0.27–0.66)
0.25 0.5 0.75 1.0
← favours darolutamide
CONTEXT
OS at interim: Not clear yet — await mature survival
Imaging rule: Conventional MFS — PSMA-alone N+ limited
Open question: 96 wk intensity — benefit vs toxicity
READ FRAME
Relative metastasis risk ↓~58% · absolute 4-yr MFS +7 pp
NNT ≈ 14 to prevent one metastasis by 4 yr — if rates hold.
Independent commentary · INN only · Not peer-reviewed presentation data until confirmed
@ozdogan_md
1) KOL infographic: POTOMAC study design - redrawn graphic (suspect AI-generated) posted · 2) KOL infographic: POTOMAC DFS (ITT) - redrawn graphic (suspect AI-generated) posted · 3) KOL infographic: POTOMAC cystectomy-free survival - redrawn graphic (suspect AI-generated) · 4) KOL infographic: POTOMAC (durvalumab + BCG, BCG-naive high-risk NMIBC): early high-risk events
David H Aggen, MD PhD@Dr_Aggen
Post text
Updated POTOMAC data at #ESMO26 in BCG-naïve high-risk NMIBC from Maria De Santos:
Adding durvalumab to BCG improved DFS (HR 0.68), with encouraging results in T1 disease (HR 0.48) and cystectomy-free survival (HR 0.45).
Key question: Is the incremental benefit worth the added toxicity and treatment burden? #ESMO2026 @OncoAlert
Neoadjuvant MIBC Trials: KEYNOTE-866 (pembro) and ENERGIZE (nivo)negative. NIAGARA (durva) stands alone. Adjuvant is split too. ICI benefit in MIBC is real but marginal, and likely lives in a subset we have yet to identify. Utilit of chemo+IO less clear in EVP era. #ESMO26 https://t.co/1lIvphS2MF
ENERGIZE
(CA017-078)
Phase III Trial
NEGATIVE TRIAL
Perioperative nivolumab + gemcitabine–cisplatin in muscle-invasive bladder cancer
N = 653 | Annals of Oncology (2026) | https://doi.org/10.1016/j.annonc.2026.10.096
Study Design
Nivolumab + GC (n = 325): Nivolumab + GC (4 cycles) → Radical cystectomy → Adjuvant nivolumab (9 cycles, Q4W)
GC alone (n = 328): GC (4 cycles) → Radical cystectomy
Key Results
Pathologic Complete Response (pCR): 39.1% vs 29.6% — Not statistically significant
Event-Free Survival (EFS): HR 0.94 (95.74% CI: 0.71–1.25) P = 0.6697 — Median EFS: Not reached vs 67.6 mo
Overall Survival (OS): HR 0.88 (95% CI: 0.64–1.21) Descriptive only — Median OS: Not reached vs Not reached
Grade 3–4 TRAEs: 50.0% vs 49.5% — Serious TRAEs: 15.7% vs 9.8% — Discontinuation: 22.3% vs 14.2%
Exploratory ctDNA Analysis
• Pretreatment ctDNA detection and persistent ctDNA at cycle 4 day 1 associated with worse EFS and OS.
Prognostic, but not validated as a predictive biomarker.
Take Home Message
• Failed to meet both co-primary endpoints (pCR and EFS).
• No statistically established OS benefit.
• Not all perioperative PD-(L)1 strategies improve survival in resectable MIBC.
@DrRishabhOnco
[AI-style cartoon doctor illustration and bladder graphic]
Schema and summary by Jeffrey Ryckman, MD: (2215O) summary card: abiraterone and prostate RT added to ADT ± docetaxel in de novo
Long-term OS benefit w/ abiraterone in PEACE-1 (2215O). Note this is triplet vs ADT + docetaxel, not vs ADT + ARPI.
📌 Randomized phase 3, 2x2 factorial, 1,173 men w/ de novo mCSPC. High / low volume 57 / 43%.
📌 R 1:1:1:1 to SoC (ADT ± docetaxel), SoC + prostate RT 74/37, SoC + abi/prednisone, or SoC + abi/prednisone + RT.
📌 Median follow-up 7.7y. Among control-arm pts whose disease progressed, 86% received an ARPI.
📌 Adding abi to SoC: OS HR 0.75 (95% CI 0.65-0.87; p=0.0001). Pooled mOS 4.6→ 6.1y (ESMO press release).
📌 ADT + docetaxel ± abi (n=710): mOS 4.4→ 6.2y; HR 0.68 (95% CI 0.56-0.82). 8y OS 27.1→ 40.3%. This was not triplet vs ADT + ARPI doublet.
📌 High-volume mOS 3.5→ 4.6y, HR 0.68 (95% CI 0.54-0.85); low-volume 6.2→ 7.8y, HR 0.74 (95% CI 0.52-1.05). No detected volume interaction (p=0.56); low-volume OS not independently significant.
📌 G3-4 AEs, doublet→ triplet without RT (press release): HTN 14→ 21%; hypokalemia 1→ 4%. No new long-term safety signal reported.
Side note on RT: in the 2024 Lancet RT analysis, prostate RT did not improve OS, but improved CRPC-free survival regardless of burden (HR 0.79, 95% CI 0.69-0.90), low-volume rPFS w/ abi (4.4→ 7.5y; aHR 0.65, 99.9% CI 0.36-1.19; RT effect p=0.019; no rPFS gain w/o abi; RT x abi interaction p=0.026), and reduced serious GU events (22.3→ 12.2%). ESMO 2026 reports RT only through four-arm mOS: SoC / SoC + RT / SoC + abi / SoC + abi + RT 4.6 / 4.6 / 5.7 / 6.4y. No new CRPC-free or GU-event RT data.
https://t.co/q9jg8xElSt
#ESMO26 #PCSM #radonc
PEACE-1
Abiraterone and prostate RT added to ADT ± docetaxel
De novo mCSPC
n=1,173
High-volume 57%
Low-volume 43%
R
1:1:1:1
(2x2)
SoC
SoC + RT
SoC + abi
SoC + abi + RT
Pooled comparisons
Add abiraterone to SoC
OS HR 0.75
95% CI 0.65-0.87
Across RT groups; MFU 7.7y
ADT + docetaxel ± abi
OS HR 0.68
95% CI 0.56-0.82
Docetaxel subgroup, n=710
RT: OS not improved
Prior CRPC-free + serious GU-event benefit
Low-volume rPFS w/ abi: aHR 0.65 (99.9% CI 0.36-1.19)
SoC = ADT ± docetaxel. Abi includes prednisone. RT = prostate 74/37.
Coprimary endpoints: rPFS and OS. Triplet vs ADT + ARPI doublet not tested.
Fizazi, ESMO 2026 #2215O; Bossi, Lancet 2024. No new RT CRPC-free or GU-event data.
KOL infographic: Perioperative EV in MIBC: vs KEYNOTE-905 cross-trial comparison
🚨 VOLGA is positive! But how much perioperative EV do we really need in MIBC?
Interesting comparison with KEYNOTE-905 at #ESMO26:
🔹 VOLGA (EV + durvalumab): 2-year EFS 64%, OS 78%, pCR 45%. EFS HR 0.51.
🔹 KEYNOTE-905 (EV + pembrolizumab): 2-year EFS 74.7%, OS 79.7%, pCR 57.1%. EFS HR 0.40.
Numerically lower EFS and pCR in VOLGA. Why?
Different patient populations and tumor characteristics? Different study designs? It seems premature to attribute these differences to pembrolizumab vs durvalumab.
But the most intriguing question is how much benefit does adjuvant EV actually add?
VOLGA achieved a significant OS benefit with just 3 neoadjuvant EV cycles and NO adjuvant EV, whereas KEYNOTE-905 planned 9 EV cycles (3 neoadjuvant + 6 adjuvant)—and fewer than half of patients reportedly completed the full planned EV course.
Could pCR and ctDNA clearance help us safely omit adjuvant EV and reduce cumulative toxicity?
⚠️ Cross-trial comparisons are hypothesis-generating, not evidence of superiority or equivalence. Only prospective trials can establish the incremental benefit of adjuvant EV.
More EV ≠ necessarily better outcomes. Let’s identify who really needs it! 🔬
@OncoAlert @weoncologists @tompowles1 @urotoday @Uromigos
@OncoAlert Faculty @DrChoueiri , @tompowles1 , @apolo_andrea , @neerajaiims , @montypal , @Silke_Gillessen , @AOmlin , @brian_rini , @PGrivasMDPhD , @TiansterZhang , @amerseburger , @DrDanielHeng , @HHammersMD , @scocmem , @AndreaNecchi , @AmandaNizamMD , @drenriquegrande , @nataliagandur , @AlbigesL , @cdanicas , @declangmurphy , @seanmmcbride , @shilpaonc , @DrRanaMcKay , @scserendipity1 , @DrYukselUrun , @ravikanesvaran , @BraunMDPhD , @EfstathiouEleni , @mzugman , @crisbergerot @Markuseckstein3
Perioperative EV in MIBC: VOLGA vs KEYNOTE-905
Similar EFS benefit - different regimens, populations and EV exposure
VOLGA (NCT04960709)
Phase 3 (ESMO 2026, LBA2)
N = 695
cT2-T4aN0/1M0 MIBC
cisplatin-ineligible or refusing
Treatment regimen (D + EV arm)
Durvalumab + Enfortumab vedotin 3 neoadjuvant cycles -> Radical cystectomy -> Durvalumab 9 adjuvant cycles No adjuvant EV
Key results (D + EV vs control)
Event-free survival (EFS) HR 0.51 (95% CI 0.38-0.67) P < 0.0001 | 2-year EFS rate D + EV 64% Control 45%
Overall survival (OS) HR 0.58 (95% CI 0.40-0.83) P = 0.0027 | 2-year OS rate D + EV 78% Control 69%
Pathological complete response (pCR) | D + EV 45% Control 10%
Safety (grade 3/4 treatment-related AEs) 30% (D + EV)
KEYNOTE-905 / EV-303
Phase 3 (NEJM 2026, doi:10.1056/NEJMoa2511674)
N = 344
cT2-T4aN0/1M0 MIBC
cisplatin-ineligible or declining
Treatment regimen (EV + pembrolizumab arm)
Enfortumab vedotin + Pembrolizumab 3 neoadjuvant cycles -> Radical cystectomy -> Enfortumab vedotin + Pembrolizumab 6 adjuvant cycles
Key results (EV + pembro vs control)
Event-free survival (EFS) HR 0.40 (95% CI 0.28-0.57) | 2-year EFS rate EV + P 74.7% Control 39.4%
Overall survival (OS) HR 0.50 (95% CI 0.33-0.74) | 2-year OS rate EV + P 79.7% Control 63.1%
Pathological complete response (pCR) | EV + P 57.1% Control 8.6%
Safety (grade 3/4 treatment-related AEs) 69% (EV + P) | Completed all 9 adjuvant EV doses < 50% of patients^1
EFS and pCR numerically lower in VOLGA - why?
• Different populations (VOLGA: cisplatin-ineligible/refusing vs KEYNOTE-905: cisplatin-eligible or declining).
• Different immunotherapy backbone (durvalumab vs pembrolizumab) does not appear to fully explain the differences.
• Other factors (patient characteristics, tumor biology, study design) may contribute.
How much does adjuvant EV add?
• Both trials show major survival benefits.
• VOLGA achieves this with only 3 neoadjuvant EV cycles and no adjuvant EV.
• In KEYNOTE-905, <50% received all 9 adjuvant EV doses, leaving the incremental benefit of adjuvant EV uncertain.
Key questions for the future
• Can pCR and ctDNA clearance identify patients who can safely omit adjuvant EV?
• Do we need different strategies for cisplatin-ineligible vs cisplatin-eligible patients?
• Prospective biomarker-guided de-escalation trials are needed.
Both VOLGA and KEYNOTE-905 show substantial survival benefits in cisplatin-ineligible/refusing MIBC.
The optimal amount and timing of perioperative EV - and which patients truly need adjuvant EV - remain open questions.
^1 <50% of patients in KEYNOTE-905 received all 9 planned adjuvant EV doses (NEJM 2026).
Cross-trial descriptive comparison; not a head-to-head analysis. Different patient populations, treatment regimens and follow-up. VOLGA: ESMO 2026 LBA2 (preplanned interimanalysis, median EFS follow-up 22.9 months); KEYNOTE-905: NEJM 2026, doi:10.1056/NEJMoa2511674.
[X logo] @niklas_kluemper
KOL infographic: KOL-branded designed summary card of five LBAs
drozdogan.com · Evidence Notes #ESMO26 · Day 1
WHAT TO REMEMBER
Five signals that should stick after Day 1
LBA highlights · absolute Δ + relative effect · confirm circulating rates at PS I
01 SANO · LBA78
Similar OS — but +17 pp distant mets
5-yr OS 50% vs 54% (HR 1.17, NS) · DM 46% vs 29% (sHR 2.04)
43% avoided oesophagectomy · NS ≠ equivalence · strategy trial
02 INTerpath-001 · LBA1 [confirm]
+12 pp RFS at 2 years — on top of pembro
24-mo RFS 82.2% vs 70.0% (HR 0.58) · DMFS HR 0.62 · n=1,137
intismeran + pembrolizumab · early release · confirm at PS I
03 VOLGA · LBA2 [confirm]
Cisplatin-ineligible MIBC: EFS jump
2-yr EFS 64% vs 45% (HR 0.51) · 2-yr OS 78% vs 69% (HR 0.58)
EV + peri-op durvalumab · circulating · confirm at PS I (Powles)
04 DASL-HiCaP · LBA4 [confirm]
+7 pp metastasis-free at 4 years
4-yr MFS 95% vs 88% (HR 0.42) · very high-risk prostate · n=1,106
darolutamide + ADT + RT · OS interim unclear · confirm at PS I
05 DeLLphi-305 · LBA3 [confirm]
ES-SCLC maintenance: OS nearly doubled
OS 21.1 vs 12.7 mo (HR 0.42) · 12-mo OS 79.4% vs 53.3%
tarlatamab + durvalumab · CRS frequent, G≥3 rare · confirm at PS I
HOW TO READ DAY 1
Sticky = absolute difference. HR = relative effect. Amber "confirm" = circulating / early release — verify at Presidential Symposium I.
Independent commentary · INN only · not a substitute for full abstracts
@ozdogan_md
KOL infographic: in context: substudy vs NEJM main trial vs LMU real-world cohort comparison table
PROTEUS at #ESMO26: first randomized data vs. upfront RP. 1 yr APA+ADT: EFS HR 0.38, MFS (conv./PSMA PET) HR 0.49, subsequent therapy at 3 yrs 35% vs 68%. Table: substudy, NEJM main trial, LMU real-world benchmark.
Three questions 🧵 https://t.co/uRc6zfa4L2
PROTEUS in context: perioperative apalutamide + ADT in high-risk PCa
ESMO 2026 substudy · NEJM 2026 main trial · LMU Munich real-world upfront RP cohort
End point | PROTEUS substudy (ESMO 2026 · open-label) | PROTEUS main trial (NEJM 2026 · double-blind) | LMU Munich cohort (Eur Urol Open Sci 2026 · retrospective)
Design & arms | 1:3 randomized, n = 408; 1 yr APA+ADT + RP (n = 102); Upfront RP (n = 306) | 1:1 randomized, n = 2,109; 1 yr APA+ADT + RP (n = 1,057); 1 yr PBO+ADT + RP (n = 1,052) | Single center, n = 1,392 (2009–2024); Upfront RP + PLND, then adjuvant or salvage care as indicated
Follow-up & baseline | Median FU 37.8 mo; PSA 14.1 · GS ≥8 97%; cT3/4 29% · cN1 7% | Median FU 61.7 mo; PSA 14.8 · GS ≥8 96%; cT3/4 36% · cN1 12% | Median FU 60 mo; PSA 11.4 · GS ≥8 100%; pT3/4 78% · pN1 28% (pathologic)
Pathology at RP | Not reported in abstract | pCR/MRD 8.9% vs 1.0%; Low RCB 30.6% vs 11.7%; R1 20.9% vs 42.7%; ypN1 23.3% vs 24.4% | R1 20% (local pathology, not comparable); pN1 28%; PSA persistence 30%
Event-free survival | Primary end point; Median NR vs 19.1 mo; HR 0.38 (0.26–0.55) | Secondary end point; Median 57.1 vs 38.4 mo; HR 0.71 (0.63–0.80); NED at 4 yrs 21.9% vs 18.3% | Secondary end point; 3 yrs 56% · 5 yrs 40%; 5-yr BCR-free survival 44%
Metastasis-free survival | Conventional or PSMA PET; HR 0.49 (0.26–0.90) | Dual primary (conv. or PSMA PET); 5 yrs 78.2% vs 73.5%, HR 0.80 (0.67–0.96); Conventional only: HR 0.84 (0.67–1.07), n.s. | Mostly conventional imaging; 3 yrs 79% · 5 yrs 71%; 5-yr cancer-specific survival 92%
Subsequent therapy & RT | Subsequent tx at 3 yrs 35% vs 68% (HR 0.29); Post-op RT 19.6% vs 42.2% | Median time to tx 74.2 vs 41.5 mo (HR 0.65); Post-op RT 26.6% vs 36.8% | Post-op RT 67% (adjuvant 24%, salvage 43%)
Safety, testosterone & OS | Grade 3/4 AEs 30.7% vs 21.7%; OS not yet reported | Grade 3/4 AEs 39.6% vs 31.0%; T recovery from baseline 19.4 vs 18.7 mo; PSA-free survival with T recovery HR 0.83; OS HR 1.08 (immature, safety measure) | No neoadjuvant therapy by design; Toxicity not reported
Sources: Taplin et al., N Engl J Med 2026; PROTEUS substudy, ESMO 2026 (abstract); Aydogdu et al., Eur Urol Open Sci 2026. Values: experimental vs control. Different designs, eras, staging (clinical vs pathologic) and time origins (randomization vs RP): no formal cross-trial comparison. R1 rates in particular differ in pathology review, era and case mix. NR = not reached; NED = no evidence of disease; RCB = residual cancer burden; T = testosterone.
@tobiasmbuettner
1) KOL infographic: MV Onco AI-illustrated cartoon: 'EV Helps Durva Win - Then Leaves!' · 2) KOL infographic: MV Onco infographic: ESMO 2026 LBA2 Part 1 - design and key results · 3) KOL infographic: MV Onco infographic: ESMO 2026 LBA2 Part 2 - tremelimumab, pCR, surgery, safety · 4) KOL infographic: MV Onco infographic: ESMO 2026 LBA2 Part 3 - interpretation and open questions
🚨 VOLGA | ESMO 2026 | LBA2
A major advance in cisplatin-ineligible muscle-invasive bladder cancer!
💚 EV + durvalumab significantly improved survival:
📊 EFS: HR 0.51 | 24-month 64% vs 45%
📊 OS: HR 0.58 | 24-month 78% vs 69%
🔥 The key distinction: EV was given ONLY before surgery — NO postoperative EV!
🤔 Does tremelimumab add meaningful benefit? Is adjuvant durvalumab essential? Can treatment eventually be de-escalated?
Impressive survival benefit. Important questions remain.
@myESMO @OncoAlert @larvol
#ESMO26 #VOLGA #BladderCancer #MVOnco
[Slide 1]
[AI-generated watercolor cartoon: woman in green dress labeled 'EV' and man in maroon suit labeled 'DURVA' walking out of a 'RADICAL CYSTECTOMY' building]
EV HELPS DURVA WIN -
THEN LEAVES!
MV Onco
[Sign] EFS HR 0.51
[Sign] OS HR 0.58
[Speech bubble, EV] I only do the neoadjuvant part!
[Speech bubble, Durva] I'll handle the adjuvant part!
RADICAL CYSTECTOMY
[Sign] ADJUVANT DURVALUMAB ->
[Suitcase] TREMELIMUMAB?
[Note] More toxicity. Uncertain added benefit.
✓ EFS HR 0.51 | OS HR 0.58
✓ EV = PREOPERATIVE ONLY!
✓ Adjuvant durvalumab: essential? Still unanswered.
[Slide 2]
VOLGA | ESMO 2026 (LBA2)
PERIOPERATIVE DURVALUMAB ± TREMELIMUMAB + ENFORTUMAB VEDOTIN IN MUSCLE-INVASIVE BLADDER CANCER
MV Onco
01 WHO WAS INCLUDED?
- Muscle-invasive bladder cancer cT2-T4aN0/1M0 or cT1N1M0
- Cisplatin-ineligible or refused cisplatin
- Planned for radical cystectomy
- Randomised phase III (open-label)
[Bladder illustration] Resectable MIBC in cisplatin-ineligible patients
02 STUDY DESIGN
695 patients (1:1:1)
Arm A (n = 233): Neoadjuvant 3 cycles Durvalumab + EV -> Radical cystectomy -> Adjuvant 9 cycles Durvalumab (no EV)
Arm B (n = 233): Neoadjuvant 3 cycles D + EV + 2 cycles T + EV -> Radical cystectomy -> Adjuvant 9 cycles D + 1 cycle T (no EV)
Control (n = 229): Radical cystectomy -> Observation or locally approved adjuvant treatment
EV = PREOPERATIVE ONLY! NO ADJUVANT EV IN VOLGA.
03 PRIMARY ENDPOINTS
- Event-free survival (EFS)
- D + EV vs control
- D + T + EV vs control
- Key secondary endpoint Overall survival (OS)
- Safety also assessed
04 KEY RESULTS
DURVALUMAB + EV vs CONTROL
EVENT-FREE SURVIVAL: HR 0.51 (95% CI 0.38-0.67) P < 0.0001; 24-month EFS 64% vs 45%
OVERALL SURVIVAL: HR 0.58 (95% CI 0.40-0.83) P = 0.0027; 24-month OS 78% vs 69%
05 WHAT DOES THIS MEAN?
- First randomised phase III trial showing statistically significant improvement in both EFS and OS with a chemotherapy-free perioperative regimen in cisplatin-ineligible MIBC.
- Large improvement in 24-month survival.
- Provides a new potential standard approach for this population.
06 TAKE-HOME (PART 1)
✓ EV + durvalumab improved EFS and OS versus control.
✓ EFS HR 0.51 | OS HR 0.58.
✓ EV GIVEN ONLY BEFORE SURGERY!
✓ Postoperative treatment = immunotherapy alone.
✓ Survival benefit demonstrated without adjuvant EV.
! Does not establish whether postoperative durvalumab can be omitted.
[Slide 3]
VOLGA | ESMO 2026 (LBA2) - Part 2
Perioperative Durvalumab ± Tremelimumab + Enfortumab Vedotin in Muscle-Invasive Bladder Cancer
01 DOES TREMELIMUMAB ADD ANYTHING?
EFFICACY vs CONTROL
EVENT-FREE SURVIVAL
D + EV: HR 0.51 (0.38-0.67) P < 0.0001; 24-mo EFS 64% vs 45%
D + T + EV: HR 0.61 (0.47-0.80) P = 0.0004; 24-mo EFS 60% vs 45%
OVERALL SURVIVAL
D + EV: HR 0.58 (0.40-0.83) P = 0.0027; 24-mo OS 78% vs 69%
D + T + EV: Not significant (follow-up ongoing)
02 PATHOLOGICAL COMPLETE RESPONSE
pCR by local review
D + EV 45% (95% CI 38.6-51.7) | D + T + EV Not reported - | Control 10% (95% CI 6.1-14.2)
Large improvement in pCR with EV + durvalumab vs control.
03 SURGERY GETS DONE
Radical cystectomy completion rate
D + EV 85% | D + T + EV 79% | Control 78%
High and comparable cystectomy completion rates across all arms.
04 ADJUVANT TREATMENT COMPLETION
Completed adjuvant treatment
D + EV 55% | D + T + EV 42%
Many patients could not complete adjuvant immunotherapy.
05 SAFETY
Maximum grade 3/4 treatment-related AEs
D + EV 30% | D + T + EV 42%
Higher toxicity with addition of tremelimumab. No new safety signals.
06 KEY POINTS
- Tremelimumab added to durvalumab + EV improved EFS vs control, but no significant OS benefit at this analysis.
- Greater grade 3/4 toxicity with triple combination (42% vs 30%).
- Surgery was feasible with high completion rates.
- Only 55% and 42% completed adjuvant treatment in the two experimental arms.
07 TAKE-HOME (PART 2)
✓ EV + durvalumab shows meaningful and statistically significant improvement in EFS and OS.
✓ Adding tremelimumab does not clearly improve outcomes and increases toxicity.
✓ Cystectomy completion rates are high and comparable.
✓ Many patients did not complete adjuvant immunotherapy.
✓ EV WAS GIVEN ONLY BEFORE SURGERY. NO ADJUVANT EV IN VOLGA.
CLINICAL INTERPRETATION
- EV + durvalumab is a promising perioperative, chemotherapy-free option for cisplatin-ineligible MIBC.
- No established incremental benefit with tremelimumab.
- Follow-up is ongoing for OS in the triple combination arm.
- Results support a perioperative strategy without postoperative EV.
- The study does not establish whether adjuvant durvalumab can be omitted.
[Slide 4]
VOLGA | ESMO 2026 (LBA2) - Part 3
Perioperative Durvalumab ± Tremelimumab + Enfortumab Vedotin in Muscle-Invasive Bladder Cancer
MV Onco
01 WHAT MAKES VOLGA IMPORTANT?
- Phase III trial in cisplatin-ineligible / refusing MIBC.
- Significant improvement in both EFS and OS.
- EFS HR 0.51 | OS HR 0.58.
- 24-month absolute gains: EFS +19% | OS +9%.
- EV given ONLY before surgery!
02 CAN WE OMIT CYSTECTOMY?
NO - NOT BASED ON VOLGA.
- Radical cystectomy was part of the treatment strategy.
- High pCR (45%) is encouraging but does not establish that surgery can be safely omitted.
- Bladder preservation remains investigational.
PATHOLOGICAL COMPLETE RESPONSE
pCR by local review
D + EV 45% (95% CI 38.6-51.7) | Control 10% (95% CI 6.1-14.2)
Large improvement in pCR but does not establish surgery omission.
03 IS ADJUVANT DURVALUMAB ESSENTIAL?
- Only 55% (D + EV) and 42% (D + T + EV) completed adjuvant treatment.
- Survival benefit observed despite incomplete adjuvant therapy.
- The independent contribution of adjuvant durvalumab cannot be determined.
- Can it safely be omitted? Unanswered.
04 WHAT REMAINS UNANSWERED?
- Long-term survival and recurrence outcomes.
- Optimal role of tremelimumab.
- ctDNA-guided treatment selection.
- Whether adjuvant durvalumab can be de-escalated.
TAKE-HOME (PART 3)
✓ VOLGA improved both EFS and OS.
✓ EV was exclusively neoadjuvant.
✓ NO POSTOPERATIVE EV!
✓ Cystectomy remains integral to the tested strategy.
✓ Adjuvant durvalumab cannot yet be safely omitted based on these data.
1) KOL infographic: MV Onco infographic: KEYNOTE-365 pembrolizumab in neuroendocrine prostate cancer · 2) KOL infographic: MV Onco infographic Part 1: KEYNOTE-365 NEPC design and OS/PFS results · 3) KOL infographic: MV Onco infographic Part 2: KEYNOTE-365 NEPC PD-L1 subgroups and safety
MV Chandrakanth@ChandrakanthMv
Post text
KEYNOTE-365 | #ESMO26 | 2217RO
Pembrolizumab in Neuroendocrine Prostate Cancer — A Survival Breakthrough?
Pembro + carboplatin/etoposide vs chemotherapy alone (N=70):
• OS: 10.2 vs 7.1 months | HR 0.33
• rPFS: 5.1 vs 4.0 months | HR 0.66
• ORR: 28% vs 15%
• PD-L1 CPS ≥1: OS HR 0.16
A striking survival signal, particularly in PD-L1-positive disease.
But small numbers, post hoc subgroup analysis and no formal hypothesis testing.
Promising, not yet practice-changing.
@myESMO @OncoAlert
#MVOnco #ESMO26 #KEYNOTE365 #ProstateCancer
[Slide 1]
KEYNOTE-365 | ESMO 2026 | 2217RO
PEMBROLIZUMAB IN NEUROENDOCRINE PROSTATE CANCER
MV Onco
OS HR 0.33 — TOO GOOD TO IGNORE?
[Balance scale illustration]
OS HR 0.33 10.2 vs 7.1 MONTHS +3.1 MONTHS MEDIAN OS
ONLY 70 PATIENTS PHASE Ib/II NO FORMAL HYPOTHESIS TESTING CONFIRMATION NEEDED
01 OVERALL SURVIVAL Pembrolizumab + carboplatin-etoposide versus carboplatin-etoposide alone 10.2 vs 7.1 months | HR 0.33
02 RADIOGRAPHIC PFS 5.1 vs 4.0 months | HR 0.66 | OS signal much stronger than PFS gain.
03 PD-L1 CPS ≥1 OS: 11.0 vs 4.8 months | HR 0.16 | Exploratory subgroup — NOT a validated biomarker.
IMPRESSIVE SURVIVAL SIGNAL. SMALL TRIAL. BIG QUESTION.
NOT YET PRACTICE-CHANGING.
[Slide 2]
KEYNOTE-365 | ESMO 2026 | 2217RO
MV Onco
Part 1 — Pembrolizumab in Neuroendocrine Prostate Cancer
OS HR 0.33 — A Survival Breakthrough?
01. WHY THIS TRIAL?
• Metastatic neuroendocrine prostate cancer (NEPC).
• Aggressive disease. Poor prognosis.
• De novo or treatment-emergent NEPC.
• Can pembrolizumab improve survival when added to platinum-etoposide?
• Phase Ib/II randomized cohort | N = 70
02. WHAT WAS COMPARED?
PEMBRO + CHEMO | n = 40
• Pembrolizumab 200 mg Q3W
• + Carboplatin AUC 5 D1
• + Etoposide 100 mg/m² D1-3
VERSUS
CHEMO ALONE | n = 30
• Carboplatin + etoposide
• Chemotherapy Q3W × 4-6 cycles.
• Pembrolizumab up to 35 cycles.
• Median follow-up: 15.4 months.
03. THE BIG SURVIVAL SIGNAL
MEDIAN OVERALL SURVIVAL
10.2 MONTHS vs 7.1 MONTHS
Pembrolizumab + chemo vs chemo alone
HR 0.33 95% CI 0.17-0.63
+3.1 MONTHS MEDIAN OS
67% lower estimated hazard of death.
04. DID PFS AND RESPONSE IMPROVE?
RADIOGRAPHIC PFS 5.1 vs 4.0 months HR 0.66 (95% CI 0.36-1.21)
6-MONTH rPFS 49% vs 26%
OBJECTIVE RESPONSE RATE 28% vs 15%
OS HR 0.33. PFS HR 0.66.
PROMISING — NOT YET PRACTICE-CHANGING.
[Slide 3]
KEYNOTE-365 | ESMO 2026 | 2217RO
Part 2 — Does PD-L1 Predict Benefit in Neuroendocrine Prostate Cancer?
OS HR 0.16 — But Is It Practice-Changing?
MV Onco
01 — PD-L1 POSITIVE: A STRIKING SIGNAL
PD-L1 CPS ≥1
Pembrolizumab + chemo vs chemo alone
MEDIAN OS
11.0 vs 4.8 MONTHS
HR 0.16 (95% CI 0.05-0.49)
ORR: 40% vs 18%
Post hoc subgroup | Small numbers
02 — PD-L1 NEGATIVE: LESS CONVINCING
PD-L1 CPS <1
Pembrolizumab + chemo vs chemo alone
MEDIAN OS
8.1 vs 7.1 MONTHS
HR 0.49 (95% CI 0.21-1.11)
ORR: 15% vs 13%
No convincing response advantage.
PD-L1 is NOT yet a validated predictive biomarker in NEPC.
03 — WHAT ABOUT SAFETY?
GRADE 3-5 TREATMENT-RELATED AEs
63% vs 80%
Pembrolizumab + chemo vs chemo alone
Grade 5 TRAEs
0% vs 3%
No unexpected safety signals reported.
Do NOT interpret this as pembrolizumab reducing chemotherapy toxicity.
Small exploratory cohort.
04 — CAN THIS CHANGE PRACTICE?
WHY CAUTION IS NEEDED
• Only 70 patients.
• Exploratory phase Ib/II randomized cohort.
• No formal hypothesis testing.
• PD-L1 analysis was post hoc.
• OS benefit much larger than PFS benefit.
TAKE-HOME
PROMISING OS SIGNAL.
PD-L1 CPS ≥1 MAY ENRICH BENEFIT.
NOT YET A NEW STANDARD OF CARE.
Confirmatory randomized evidence needed.
KOL infographic: Presidential Symposium I four LBAs summary infographic
#ESMO26 PS I wrap-up, 4 LBAs, all positive:
• INTerpath-001 RFS HR 0.58
• VOLGA EFS HR 0.51
• DeLLphi-305 OS HR 0.42 (21.1 vs 12.7 mo)
• DASL-HiCaP MFS HR 0.42
Safety definitions differ. Which one made you think most? https://t.co/294mwvfK2H
drozdogan.com · Evidence Notes | #ESMO26 · PS I · LBA1–4
PS I: FOUR LBAs
INTerpath-001 · VOLGA · DeLLphi-305 · DASL-HiCaP
Relative, absolute and safety side by side · primary endpoints as reported
All four positive · absolute gains and safety trade-offs differ
INTerpath-001 | LBA1 · Melanoma
Resected stage IIB–IV · intismeran + pembrolizumab vs pembrolizumab · n = 1,137
Relative: RFS HR 0.58 | 95% CI 0.45–0.75
Absolute: 2-yr RFS +12.2 pts | 82.2% vs 70.0%
Safety: 14.2% vs 13.4% | grade 3–5 TRAE
VOLGA | LBA2 · Bladder
Cisplatin-ineligible MIBC · durvalumab + enfortumab vedotin vs cystectomy · n = 233 vs 229
Relative: EFS HR 0.51 | 0.38–0.67 · OS HR 0.58 (0.40–0.83)
Absolute: 24-mo EFS +19 pts | 64% vs 45% · OS 78% vs 69%
Safety: 64% vs 44% | grade 3–4 AE, any cause
DeLLphi-305 | LBA3 · SCLC
ES-SCLC first-line maintenance · tarlatamab + durvalumab vs durvalumab · n = 563
Relative: OS HR 0.42 | 0.32–0.54 · PFS HR 0.34 (0.28–0.42)
Absolute: Median OS +8.4 mo | 21.1 vs 12.7 · PFS 7.4 vs 1.9
Safety: 20.9% vs 10.8% | grade ≥3 TRAE · CRS 49.6%
DASL-HiCaP | LBA4 · Prostate
Localized very high-risk · darolutamide vs placebo + RT + ADT · n = 1,106
Relative: MFS HR 0.42 | 0.27–0.66 · OS HR 0.88 (0.49–1.59)
Absolute: 4-yr MFS +7 pts | 95% vs 88% · mFU 3.8 yr
Safety: 43% vs 36% | grade ≥3 AE
HOW TO READ
Safety definitions differ by trial (any-cause vs treatment-related, grade 3–4 vs ≥3). Compare within a row, not across rows. DASL-HiCaP OS is still immature.
Independent commentary · INN only · figures as reported at ESMO 2026
@ozdogan_md
KOL infographic: GDFATHER-NEO trial design graphic (redrawn)
David H Aggen, MD PhD@Dr_Aggen
Post text
Great discussion by Syed Hussain highlighting study out now from @AndreaNecchi
🚨 Now published in Nature Medicine: GDFATHER-NEO, a phase 2a study evaluating GDF-15 blockade with visugromab + nivolumab in cisplatin-ineligible MIBC.
Encouraging pathologic and radiographic responses without new safety signals. Small, nonrandomized study (N=31)—randomized validation needed.
#ESMO26 #BladderCancer
https://t.co/OKxs17xvVs
HOW MUCH PERI-OP EV? VOLGA vs KEYNOTE-905 — intensity, not whether. Cisplatin-ineligible/declining MIBC (cross-trial).
VOLGA: EV ×3 neo + peri-op durva (no adj EV) → 2-yr EFS +19 pp (HR 0.51); OS +9 pp (HR 0.58); pCR ~45% vs ~10%.
KEYNOTE-905: EV ×9 peri-op + pembro ×17 → 2-yr EFS +35.3 pp (HR 0.40); OS +16.6 pp (HR 0.50); pCR +48.3 pp.
Clinic ask: who needs adjuvant EV vs neoadjuvant-only EV + peri-op PD-(L)1? Partners differ — not head-to-head. #ESMO26 @myESMO @OncoAlert
drozdogan.com · Evidence Notes
#ESMO26 · dual-trial
HOW MUCH PERI-OP EV?
VOLGA vs KEYNOTE-905 — intensity, not whether
Cisplatin-ineligible / declining MIBC · absolute landmarks
⚠ Cross-trial · not head-to-head · control arms & partners differ
PATHWAY · Randomize → RC ± peri-op systemic therapy
RAND → VOLGA · EV ×3 neo only vs KN-905 · EV ×9 peri-op
ENFORTUMAB VEDOTIN INTENSITY
VOLGA · short EV
Neoadjuvant only · no adjuvant EV
×1 ×2 ×3 EV ×3
+ peri-op durvalumab (doublet focus)
KEYNOTE-905 · longer EV
Neoadjuvant + adjuvant EV kept
RC
EV ×3 neo → RC → EV ×6 adj (= ×9) + pembrolizumab
ABSOLUTE LANDMARKS (each vs own control)
VOLGA
LBA2 · Powles · NEJM
n≈695 (1:1:1) · cis-inelig/declining
EV + durvalumab (doublet)
EV ×3 neo only · peri-op durva
2-yr EFS HR 0.51 | +19 pp | 64% | 45%
2-yr OS HR 0.58 | +9 pp | 78% | 69%
pCR | ~+35 pp | 45% | 10%
Short EV course = the story
KEYNOTE-905
EV-303 · NEJM · Ph3
n=344 · cis-inelig/declining
EV + pembrolizumab
EV ×9 peri-op · pembro ×17
2-yr EFS HR 0.40 | +35.3 pp | 74.7% | 39.4%
2-yr OS HR 0.50 | +16.6 pp | 79.7% | 63.1%
pCR | +48.3 pp | 57.1% | 8.6%
Longer EV + adjuvant EV kept
VOLGA tremelimumab triplet amber: EFS HR 0.61 · OS NS (HR 0.77 interim) · more tox, less EV delivered
CLINIC ASK
Cisplatin-ineligible MIBC — who needs adjuvant EV vs neoadjuvant-only EV + peri-op PD-(L)1? Cross-trial; partners differ (durvalumab vs pembrolizumab).
Independent commentary · International Nonproprietary Names only · Not a head-to-head
@ozdogan_md
1) KOL infographic: KEYNOTE-B15: ctDNA-Evaluable Population at the Adjuvant · 2) KOL infographic: EV-304/KEYNOTE-B15: EFS by baseline ctDNA status and ctDNA
Interesting exploratory ctDNA data from EV-304/KEYNOTE-B15 at #ESMO26 in cisplatin-eligible MIBC.
🔹 ctDNA clearance: 82.1% with EV+P vs 66.7% with gem/cis
🔹 Baseline ctDNA+ patients derived substantial EFS benefit from EV+P (HR 0.54)
🔹 Persistent ctDNA positivity after surgery was associated with poor outcomes regardless of treatment.
ctDNA is a powerful prognostic biomarker, but can it guide treatment selection or bladder preservation? More work is needed.
#BladderCancer #ctDNA
drozdogan.com · Evidence Notes
#ESMO26 · LBA2
VOLGA
Cisplatin-ineligible/refusing MIBC
neoadjuvant enfortumab vedotin + peri-op durvalumab vs control
⚠ Circulating LBA figures · confirm at PS I presentation
DESIGN
n = 695 · 1:1:1 · presenter Powles · Presidential Symposium I
EFFICACY (EV + durvalumab arm · unverified absolute rates)
Endpoint | EV + Durva vs Control | HR
EFS (2-yr) | 64% vs 45% | 0.51
OS (2-yr) | 78% vs 69% | 0.58
pCR | ~45% vs ~10% | —
CONTEXT
Tremelimumab arm: EFS HR ~0.61; OS NS at interim
EV exposure: Neoadjuvant only; No adjuvant EV
READ FRAME
Relative EFS risk ↓~49% · absolute 2-yr EFS Δ ~19 pp
Open Q: where does this sit vs recent EC peri-op EV + pembrolizumab (EV-304 / KN-905) as today's SoC?
Independent commentary · INN only · Not peer-reviewed presentation data until confirmed
@ozdogan_md
Schema and summary by Jeffrey Ryckman, MD: KOL-made summary graphic: belzutifan + lenvatinib vs cabozantinib (3587O)
LITESPARK-011 (3587O):
Randomized phase 3, 747 pts w/ advanced ccRCC after anti-PD-(L)1: belzutifan + lenvatinib vs cabozantinib.
mPFS 14.8 vs 10.8 mo (HR 0.74).
Final mOS 33.7 vs 28.6 mo (HR 0.85; one-sided p=0.047, boundary 0.0223).
#ESMO26 @urotoday
https://t.co/5TvfSrLwl5
Five absolute signals after PS I #ESMO26
DeLLphi: +8.4 mo OS
VOLGA: +19 pp 2-yr EFS (treme OS NS)
INTerpath: +12.2 pp 2-yr RFS
DASL: +7 pp 4-yr MFS (OS interim)
B49: +0.7 mo PFS — no OS
Absolute Δ first. INN only.
@myESMO @OncoAlert https://t.co/9CrIctKpph
VOLGA (LBA2): perioperative durva ± tremelimumab + neoadjuvant EV vs cystectomy control in cisplatin-ineligible/refusing MIBC.
24-mo EFS 64% vs 45% with durva + EV, HR 0.51 (95% CI 0.38-0.67); 60% vs 45% with the triplet, HR 0.61 (95% CI 0.47-0.80).
No trimodality arm. This doesn't answer the bladder-preservation comparison.
#ESMO26 #radonc
https://t.co/3skudJjr5t
VOLGA
Perioperative D ± T + neoadjuvant EV vs cystectomy control
MIBC; Cisplatin unfit or refusing; Cystectomy planned; n=229/233/233 -> RANDOMIZE
| 24-mo EFS* | EFS HR* | CI
Control cystectomy | 45% | Reference |
D+EV | 64% | 0.51 | 0.38-0.67
D+T+EV | 60% | 0.61 | 0.47-0.80
Powles. ESMO 2026, LBA2. D: durvalumab; T: tremelimumab; EV: enfortumab vedotin.
*Dual primary: EFS for each regimen vs control. All arms planned for cystectomy.
D+T+EV OS not significant; follow-up ongoing.
1) Schema and summary by Jeffrey Ryckman, MD: SWOG S2427 (BRIGHT) trial schema: RT + pembrolizumab after response to neoadjuvant · 2) Schema and summary by Jeffrey Ryckman, MD: NRG-GU015 (ARCHER) trial schema: hypofractionated RT vs SBRT with chemo in MIBC
Jeff Ryckman@jryckman3
Post text
@zklaassen_md @urotoday Also important (but ongoing): S2427 (BRIGHT) and NRG-GU015 (ARCHER)! #ESMO26 https://t.co/XR3RF12t5b
▸ ENZARAD: Enzalutamide added no MFS or OS benefit over older antiandrogen with ADT/RT
▸ VOLGA: perioperative durvalumab plus enfortumab vedotin improves EFS and OS in cisplatin-ineligible MIBC
This evening on UrologyWatch, Oct 26: https://t.co/UQYtlKv0L7 https://t.co/XX59vtvjxX
UrologyWatch.com
THIS EVENING Mon, Oct 26
1 Prostate Phase 3 RCT
ENZARAD: Enzalutamide added no MFS or OS benefit over older antiandrogen with ADT/RT
2 VOLGA: perioperative durvalumab plus enfortumab vedotin improves EFS and OS in...
3 Adding belzutifan or quavonlimab to pembrolizumab-lenvatinib fails to improve PFS or OS in...
Built by urologists, for urologists
urologywatch.com
KOL infographic: KOL-shared infographic (Turkish): LBA2 perioperative EV + durvalumab +
ESMO 2026 | MADRID 23–27 Ekim 2026
LBA2
VOLGA
Kas invaziv mesane kanserinde perioperatif tedavi
Faz III, çok merkezli, randomize çalışma
Sisplatin alamayan veya sisplatini reddeden kas invaziv mesane kanseri hastaları (n=695)
Amaç
Perioperatif enfortumab vedotin (EV) + durvalumab ± tremelimumab yaklaşımını değerlendirmek.
Çalışma kolları
1 Neoadjuvan EV + durvalumab: Neoadjuvan EV + durvalumab → Radikal sistektomi → Adjuvan durvalumab
2 Neoadjuvan EV + durvalumab + tremelimumab: Neoadjuvan EV + durvalumab + tremelimumab → Radikal sistektomi → Adjuvan durvalumab + tremelimumab
3 Kontrol: Radikal sistektomi → ± uygun adjuvan tedavi
Başlıca sonuçlar (ESMO 2026, LBA2)
2 yıllık EFS: %64 EV + durvalumab grubunda | %45 Kontrol grubunda | HR 0,51
2 yıllık OS: %78 EV + durvalumab grubunda | %69 Kontrol grubunda | HR 0,58
pCR (patolojik tam yanıt): %45 EV + durvalumab grubunda | %10 Kontrol grubunda
Tremelimumab eklenen üçlü kombinasyon (EV + durvalumab + tremelimumab)
• EFS’de anlamlı iyileşme sağladı.
• Ara analizde OS farkı istatistiksel olarak anlamlı değildi.
Klinik mesaj
Sisplatin uygun olmayan veya sisplatini reddeden kas invaziv mesane kanseri hastalarında neoadjuvan EV + durvalumab, perioperatif tedavide güçlü ve yeni bir seçenek sunmaktadır.
1) KOL infographic: POTOMAC disease-free survival KM: durvalumab + BCG (I+M) vs BCG (I+M) · 2) KOL infographic: POTOMAC cystectomy-free survival KM: durvalumab + BCG (I+M) vs BCG (I+M)
Diane Delattre, MD, PhD@DrDelattre
Post text
Updated POTOMAC data at #ESMO26 in BCG-naïve high-risk NMIBC
Adding durvalumab to BCG improved DFS (HR
0.68), with encouraging results in T1 disease (HR 0.48) and cystectomy-free survival HR
0.45). https://t.co/xDjyamyfJL
Cisplatin-ineligible bladder cancer, VOLGA (ESMO 2026, NEJM): 3 cycles of enfortumab vedotin + durvalumab before cystectomy. 2-year survival 78% vs 69% with surgery straight away.
The surgeon's fear with drugs-first is losing patients before theatre. 85% still reached cystectomy vs 78%. Delayed 4%, cancelled 0.9%.
Drugs first. Did they still get to theatre?
Cystectomy
Reached cystectomy
Drugs first: 85%
Surgery straight away: 78%
Surgery delayed 4%
Cancelled 0.9%
VOLGA, ESMO 2026, cisplatin-ineligible bladder cancer
KOL infographic: KOL-made overlay of and PR 22 metastasis-free survival KM curves
At ESMO 2026, hosted by the European Society for Medical Oncology @myESMO, four phase 3 LBAs reported positive results across four tumors.
• INTerpath-001: 2-year RFS reached 82.2% vs 70.0% with intismeran plus pembrolizumab (HR 0.58).
• VOLGA: durvalumab plus enfortumab vedotin improved EFS (HR 0.51) and OS (HR 0.58).
• DeLLphi-305: tarlatamab plus durvalumab extended median OS to 21.1 vs 12.7 months (HR 0.42).
• DASL-HiCaP: darolutamide plus ADT and radiotherapy raised 4-year MFS to 95% vs 88% (HR 0.42); OS remains immature.
NEJM credits Ying Cheng of Jilin Cancer Hospital as DeLLphi-305’s China leading PI. These data extend individualized and combination strategies across disease settings.
🔗 Read the full article via the link in the comments below.
#MedJ #ESMO26 #Oncology #Melanoma #BladderCancer #SCLC #ProstateCancer
MEDJ | ESMO 2026 HIGHLIGHTS
PROF. YING CHEN
Four Phase 3 ESMO LBAs Advance Treatment Across Four Tumors
Key Points:
1. INTerpath-001 raised 2-year RFS to 82.2% versus 70.0% in resected melanoma.
2. VOLGA improved EFS and OS with perioperative durvalumab plus neoadjuvant enfortumab vedotin in MIBC.
3. DeLLphi-305 extended median OS to 21.1 versus 12.7 months in first-line ES-SCLC maintenance.
4. DASL-HiCaP raised 4-year MFS to 95% versus 88%, while OS remained immature.
5. Ying Cheng led DeLLphi-305 in China; grade ≥3 TRAEs were 46.8% versus 40.6%.
MedJ
ESMO
KOL infographic: ESMO Insights card: neoadjuvant EV + peri-operative durvalumab improves EFS and OS
#ESMO26: Neoadjuvant enfortumab vedotin significantly improved event-free and overall survival when added to peri-operative durvalumab for muscle-invasive #BladderCancer (#MIBC) in the phase III VOLGA #ClinicalTrial
🔗 https://t.co/FwSVzhef3B
#InsightsbyESMO #ADC https://t.co/zrnrjVsk8m
MADRID 2026 ESMO congress
Neoadjuvant enfortumab vedotin added to peri-operative durvalumab significantly improved event-free and overall survival
#InsightsbyESMO
ESMO
1) KOL infographic: OncoAlert 4Sight title card: 4736O perioperative nivolumab in MIBC - Andrea Necchi · 2) KOL infographic: OncoAlert 4Sight 4736O Methods (perioperative nivolumab MIBC) · 3) KOL infographic: OncoAlert 4Sight 4736O Results (perioperative nivolumab MIBC) · 4) KOL infographic: OncoAlert 4Sight 4736O Conclusion
OncoAlert@OncoAlert
Post text
OncoAlert 4Sight Abstracts to be Presented at #ESMO26
Results From a Phase 3 Trial of Neoadjuvant Chemotherapy Alone vs in Combination With Nivolumab Followed by Postsurgical Adjuvant Nivolumab in Patients With Muscle-Invasive Bladder Cancer (MIBC)
🔬 Phase 3 (n=653): neoadjuvant nivolumab + gemcitabine/cisplatin then adjuvant nivolumab vs neoadjuvant GC in MIBC. Primary endpoints: EFS and pCR.
➡️ EFS HR 0.94 (95.74% CI 0.71–1.25); P=0.67
➡️ pCR 39.1% vs 29.6%; OR 1.54 (99.91% CI 0.88–2.69)
➡️ OS immature: HR 0.88 (0.64–1.21); grade ≥3 TRAEs 45.9% vs 49.5%
✅ No statistically significant differences in EFS or pCR; safety of nivolumab + GC consistent with the individual agents.
🎙️ Andrea Necchi
(4Sight Made from Abstracts publicly available at the ESMO website)
Pinging Our Faculty
@DrChoueiri, @tompowles1, @apolo_andrea, @neerajaiims, @montypal, @Silke_Gillessen, @AOmlin, @brian_rini, @PGrivasMDPhD, @TiansterZhang, @amerseburger, @DrDanielHeng, @HHammersMD, @scocmem, @AndreaNecchi, @AmandaNizamMD, @drenriquegrande, @nataliagandur, @AlbigesL, @cdanicas, @declangmurphy, @seanmmcbride, @shilpaonc, @DrRanaMcKay, @scserendipity1, @DrYukselUrun, @ravikanesvaran, @BraunMDPhD, @EfstathiouEleni, @mzugman, @crisbergerot, @niklas_kluemper @Markuseckstein3
OncoAlert 4Sight Abstracts to be Presented at #ESMO26
Darolutamide With Androgen Deprivation Therapy (ADT) and Definitive or Salvage Locoregional Radiation Therapy (RT) for Localised, Very High-Risk Prostate Cancer: Interim Analysis of an International, Placebo-Controlled, Randomised Phase 3 Trial (DASL-HiCaP; ANZUP1801)
@niazi_Dr7 @seanmmcbride @DocJarad @RayMcDermott1
🔬 Phase 3 (n=1106): darolutamide vs placebo added to 96 weeks of ADT plus prostate/pelvic RT in very high-risk localized or post-prostatectomy persistent/recurrent prostate cancer. Interim analysis; median follow-up 3.8 years.
➡️ 4-yr MFS 95% vs 88%; HR 0.42 (0.27–0.66); p=0.0001
➡️ PSA-PFS HR 0.47 (0.33–0.67); OS HR 0.88 (0.49–1.59)
➡️ Grade ≥3 AEs 43% vs 36%
✅ Darolutamide significantly improved MFS-CI; follow-up is ongoing to confirm MFS-CI surrogacy for OS. #ProstateCancer
🎙️ Tamim Niazi
👥 Sean McBride · Scott Williams · Ian Davis · Martin Stockler · Andrew Martin · Karen Bracken · Felicia Roncolato · Lisa Horvath · Shomik Sengupta · Jarad Martin · Tee Lim · Simon Hughes · Raymond McDermott · James Catto · Paul Kelly · Wendy Parulekar · Scott Morgan · Ricardo Rendon · Christopher Sweeney
(4Sight Made from Abstracts publicly available at the ESMO website)
Pinging Our Faculty
@DrChoueiri, @tompowles1, @apolo_andrea, @neerajaiims, @montypal, @Silke_Gillessen, @AOmlin, @brian_rini, @PGrivasMDPhD, @TiansterZhang, @amerseburger, @DrDanielHeng, @HHammersMD, @scocmem, @AndreaNecchi, @AmandaNizamMD, @drenriquegrande, @nataliagandur, @AlbigesL, @cdanicas, @declangmurphy, @seanmmcbride, @shilpaonc, @DrRanaMcKay, @scserendipity1, @DrYukselUrun, @ravikanesvaran, @BraunMDPhD, @EfstathiouEleni, @mzugman, @crisbergerot, @niklas_kluemper @Markuseckstein3
OncoAlert 4Sight Abstracts to be Presented at #ESMO26
Perioperative Durvalumab With or Without Tremelimumab Plus Neoadjuvant Enfortumab Vedotin in Muscle-Invasive Bladder Cancer: Results From the Phase 3 VOLGA Trial
@tompowles1 @jteoh_hk @CPRT65
🔬 Phase 3 (n=695): perioperative durvalumab ± tremelimumab + neoadjuvant enfortumab vedotin vs control (RC, then observation or approved adjuvant therapy) in cisplatin-ineligible MIBC. Interim analysis; median EFS follow-up 22.9 mo.
➡️ D+EV: EFS HR 0.51 (0.38–0.67); OS HR 0.58 (0.40–0.83)
➡️ D+T+EV: EFS HR 0.61 (0.47–0.80); OS did not meet significance
➡️ pCR 45% (D+EV) vs 10% (control); grade 3/4 TRAEs 30% and 42%
✅ Both EFS primary endpoints met; perioperative durvalumab plus 3 cycles of neoadjuvant EV also significantly improved OS.
🎙️ Thomas Powles
👥 Alexandra Drakaki · Jeremy Teoh · Enrique Grande · Mario Fontes-Sousa · Camillo Porta · Esther Wu · Erik Goluboff · Svetlana Ho · Stephan Hois · Ashok Gupta · James Catto
(4Sight Made from Abstracts publicly available at the ESMO website)
@DrChoueiri, @tompowles1, @apolo_andrea, @neerajaiims, @montypal, @Silke_Gillessen, @AOmlin, @brian_rini, @PGrivasMDPhD, @TiansterZhang, @amerseburger, @DrDanielHeng, @HHammersMD, @scocmem, @AndreaNecchi, @AmandaNizamMD, @drenriquegrande, @nataliagandur, @AlbigesL, @cdanicas, @declangmurphy, @seanmmcbride, @shilpaonc, @DrRanaMcKay, @scserendipity1, @DrYukselUrun, @ravikanesvaran, @BraunMDPhD, @EfstathiouEleni, @mzugman, @crisbergerot, @niklas_kluemper @Markuseckstein3
ESMO 2026 KEY TRIALS | DAY 2 PREVIEW | 24 OCT
[Columns: Location/time | Tumor | Trial / regimen / abstract | Title | Presenter | sponsor logo]
Alicante Auditorium - Hall 6, 08:30-08:40 | Breast Cancer | KEYNOTE-B49, Pembro + Chemo, Abs: LBA51 | Results from KEYNOTE-B49: A phase 3, randomized, double-blind study of pembrolizumab (pembro) vs placebo (pbo) plus chemotherapy (CT) in participants (pts) with HR+/HER2- advanced breast cancer (ABC) | Hope S. Rugo | [Merck logo]
Alicante Auditorium - Hall 6, 08:50-09:00 | Breast Cancer | FOURLIGHT-1, Atirmo + Fulve, Abs: 1842O | Efficacy and safety of atirmociclib (ATI) + fulvestrant (FUL) in patients (pts) with HR+/HER2- advanced/metastatic breast cancer (mBC) who progressed on prior CDK4/6 inhibitor (CDK4/6i) in a randomized phase 2 study (FOURLIGHT-1) | Antonio Giordano | [Pfizer logo]
Almeria Auditorium - Hall 9, 08:35-08:40 | Lung Cancer | FLAURA2, Osi ± Plat-Pem, Abs: 2719RO | FLAURA2: Analysis of on-treatment plasma EGFRm dynamics and associated clinical outcomes in patients (pts) with EGFRm advanced NSCLC treated with first-line (1L) osimertinib (osi) ± platinum-pemetrexed (plat-pem) | David Planchard | [AstraZeneca logo]
Alicante Auditorium - Hall 6, 10:15-10:25 | GI Cancer | COMPANION-002, Tovecimig ± Pacli, Abs: 459O | A randomized trial of paclitaxel ± tovecimig in previously treated patients with advanced biliary tract cancer | Nilofer S. Azad | [logo]
Alicante Auditorium - Hall 6, 10:25-10:35 | GI Cancer | ACTICCA-1, Gem + Cis vs SoC, Abs: LBA21 | Adjuvant chemotherapy with gemcitabine and cisplatin compared to standard of care after curative intent resection of cholangiocarcinoma and gallbladder carcinoma (ACTICCA-1 trial) | Henning Wege | [UKE Hamburg logo]
Barcelona Auditorium - Hall 9, 10:15-10:25 | GU Cancer | PEACE-1, Abira + Pred, Abs: 2215O | Long-term overall survival with abiraterone acetate plus prednisone in the PEACE-1 phase 3 trial for de novo metastatic castration-sensitive prostate cancer (mCSPC) | Karim Fizazi | [logo]
Barcelona Auditorium - Hall 9, 11:00-11:10 | GU Cancer | PROTEUS, Apa + ADT + RP + PLND, Abs: LBA53 | Perioperative apalutamide (APA) plus androgen-deprivation therapy (ADT) with radical prostatectomy plus pelvic lymph node dissection (RP + PLND) vs RP + PLND alone in patients (pts) with high-risk localized or locally advanced prostate cancer (HR LPC/LAPC): PROTEUS substudy | Alberto Briganti | [J&J logo]
Almeria Auditorium - Hall 9, 10:59-11:04 | Breast Cancer | postMONARCH, Abema + Fulve, Abs: 1RO | Overall survival from the phase 3 postMONARCH trial of abemaciclib + fulvestrant vs placebo + fulvestrant for HR+, HER2- advanced breast cancer following progression on a prior CDK4/6 inhibitor + endocrine therapy | Kevin Kalinsky | [Lilly logo]
Barcelona Auditorium - Hall 9, 14:45-14:55 | GYN Cancer | NRG-GY020, Pembro ± RT, Abs: 1239O | NRG-GY020: Phase III randomized trial of radiation +/- MK-3475 (pembrolizumab) for newly diagnosed early-stage high intermediate risk (HIR) mismatch repair deficient (dMMR) endometrioid endometrial cancer | Floor Backes | [NIH logo]
Alicante Auditorium - Hall 6, 14:50-14:55 | GI Cancer | ECLYPSe, Encor + Cetu + FOLFIRI, Abs: 788RO | Encorafenib plus cetuximab (EC) beyond progression in combination with FOLFIRI in BRAF V600E metastatic colorectal cancer (mCRC) patients (pts) progressing on EC: Results from the ECLYPSe phase II trial | Maria Alessandra Calegari | [logo]
Alicante Auditorium - Hall 6, 14:55-15:00 | GI Cancer | TRIDENTE, Encor + Bini + Cetu, Abs: 789RO | TRIDENTE: A phase II study of rechallenge with encorafenib (ENCO), binimetinib (BINI), and cetuximab (CET) in BRAF V600E-mutant metastatic colorectal cancer (mCRC) | Daisuke Kotani | [logo]
Alicante Auditorium - Hall 6, 15:42-15:47 | GI Cancer | CheckMate 8HW, Nivo + Ipi vs Nivo or Chemo, Abs: LBA32 | Final overall survival results from CheckMate 8HW: Nivolumab plus ipilimumab versus nivolumab or chemotherapy in MSI-H/dMMR metastatic colorectal cancer | Sara Lonardi | [logo]
Alicante Auditorium - Hall 6, 16:30-16:42 | Melanoma | INTerpath-001, Intismeran + Pembro, Abs: LBA1 | INTerpath-001: Phase 3 study of the mRNA-based individualized neoantigen therapy (INT) intismeran autogene (intismeran) plus pembrolizumab (pembro) vs pembro alone for adjuvant treatment of resected stage IIB-IV melanoma (MEL) | Georgina V. Long | [Merck logo]
Alicante Auditorium - Hall 6, 16:54-17:06 | GU Cancer | VOLGA, Durva ± Treme + EV, Abs: LBA2 | Perioperative durvalumab with or without tremelimumab plus neoadjuvant enfortumab vedotin in muscle-invasive bladder cancer: Results from the phase 3 VOLGA trial | Thomas B. Powles | [AstraZeneca logo]
Alicante Auditorium - Hall 6, 17:18-17:30 | Lung Cancer | DeLLphi-305, Tarla + Durva -> Durva + EP, Abs: LBA3 | Tarlatamab plus durvalumab (durva) vs durva as 1L maintenance (1LM) therapy following durva, platinum, and etoposide (1L durva + EP) in extensive-stage small cell lung cancer (ES-SCLC): Primary analysis of the phase 3 DeLLphi-305 trial | Jacob Sands | [Amgen logo]
Alicante Auditorium - Hall 6, 17:42-17:54 | GU Cancer | DASL-HiCaP, Darolu + ADT + RT, Abs: LBA4 | Darolutamide with androgen deprivation therapy (ADT) and definitive or salvage locoregional radiation therapy (RT) for localised, very high-risk prostate cancer: Interim analysis of an international, placebo-controlled, randomised phase 3 trial (DASL-HiCaP; ANZUP1801) | Tamim Niazi | [logo]
LARVOL
KOL infographic: OncLive summary graphic - 4-yr MFS 95% vs 88%, HR 0.42
🎯 4-year MFS of 95% vs 88% (HR, 0.42; P = .0001): adding darolutamide to ADT and primary or salvage RT cut the risk of metastasis or death in very high-risk localized prostate cancer. Phase 3 DASL-HiCaP data from #ESMO26 👇 @mcgillu @niazi_Dr7 @myESMO #pcsm https://t.co/MFgAwahFZl
DASL-HiCaP | PHASE 3
Darolutamide + ADT + RT Improves Metastasis-Free Survival
Very high-risk localized prostate cancer
4-YEAR METASTASIS-FREE SURVIVAL
95% Darolutamide + ADT + RT
88% Placebo + ADT + RT
58% lower hazard of metastasis or death
HR 0.42 (95% CI 0.27–0.66); P = .0001
This represents a relative hazard reduction, not an absolute risk reduction.
4-year PSA progression-free survival
91% Darolutamide + ADT + RT
83% Placebo + ADT + RT
HR 0.47
Randomized phase 3; N = 1,106; interim analysis.
Overall survival data immature. No new safety signals.
KOL infographic: OncLive infographic: ixotatug vedotin in recurrent germ cell tumors (CATALINA-1, ESMO 2026)
OncLive.com@OncLive
Post text
🧬 In phase 1 CATALINA-1, ixotatug vedotin achieved a 45.5% response rate in 11 patients with heavily pretreated germ cell tumors. Half of those previously treated with HDCT/ASCT responded.
Read more about the findings presented at @myESMO
#ESMO26 @DrDarrenFeldman @MSKCancerCenter: https://t.co/NgLnGKtauY
Could a new mechanism change how we target prostate cancer?
Live from #ESMO2026, Dr. Ben Garmezy joins Brian and Tom to discuss Phase 1 data on RIPTAC, a novel approach that uses the androgen receptor (AR) to target BRD4 and disrupt cancer cell transcription.
🎙️ Episode 524 of The Uromigos Podcast is now live: https://t.co/NNMiWRJWFC
#Uromigos #ProstateCancer #GUOncology
The Uromigos™
MADRID 2026 ESMO congress
NEW EPISODE LISTEN NOW
A new way to target prostate cancer?
Phase 1 data on JNJ-6143, a novel RIPTAC in metastatic castration-resistant prostate cancer (mCRPC).
EPISODE 524
WITH DR. BEN GARMEZY
KOL infographic: OncLive card: KEYNOTE-B15 ctDNA clearance and prognosis
Exploratory data from KEYNOTE-B15 showed enfortumab vedotin/pembrolizumab improved ctDNA clearance in cisplatin-eligible MIBC #blcsm #oncology
Check out the findings presented at @myESMO #ESMO26: https://t.co/Apc8DSP7UZ https://t.co/xzceHFJ3IE
OncLive®
PHASE 3 DATA · 2026 ESMO CONGRESS
KEYNOTE-B15: ctDNA Clearance and Prognosis in Cisplatin-Eligible MIBC
In an exploratory analysis of the phase 3 KEYNOTE-B15 trial (NCT04700124), perioperative enfortumab vedotin-ejfv (Padcev) plus pembrolizumab (Keytruda) led to higher presurgical ctDNA clearance than neoadjuvant gemcitabine plus cisplatin, and ctDNA status was prognostic for event-free survival in both arms, according to data presented at the 2026 ESMO Congress.
Enfortumab vedotin plus pembrolizumab vs gemcitabine plus cisplatin
Presurgical ctDNA clearance: 82.1% vs 66.7% - 69/84 vs 68/102 patients with detectable ctDNA at baseline
24-mo EFS after ctDNA clearance: 81.1% vs 63.2% - Positive at baseline, negative presurgery (n = 69 vs 68)
pCR if ctDNA negative presurgery: 72.4% vs 43.7% - 131/181 vs 80/183 patients who underwent RC
24-mo EFS if ctDNA+ postsurgery: 10.0% vs 10.0% - HR, 0.63; 95% CI, 0.30-1.35 (n = 10 vs 30)
ctDNA negative postsurgery: 24-mo EFS 89.9% vs 82.2% - HR, 0.48; 95% CI, 0.29-0.81 (n = 199 vs 193)
Source: Chatzkel J, et al. 2026 ESMO Congress; October 23-27, 2026; Madrid, Spain. Abstract 4734O. EFS, event-free survival; pCR, pathologic complete response; RC, radical cystectomy.
OncLive.com
KOL infographic: OncLive-style infographic: pembrolizumab + chemo misses EFS in cisplatin-eligible MIBC
Perioperative pembrolizumab plus neoadjuvant chemo did not improve EFS vs placebo plus chemo in pts w/ cisplatin-eligible MIBC undergoing radical cystectomy with pelvic lymph node dissection, according to KEYNOTE-866. @myESMO #ESMO2026 #blcsm #oncology
https://t.co/2bVpSGT3Xj https://t.co/1MqmicyF0J
🧬 Could combining 2 antibody-drug conjugates with immunotherapy offer a new approach to treatment-naive metastatic urothelial cancer?
At @myESMO #ESMO26, interim TROPHY-U-01 findings shed light on the potential of sacituzumab govitecan, enfortumab vedotin, and zimberelimab. @UChicago
Read more: https://t.co/T7GCxtf0FX #medtwitter #oncology
Ad hoc data from KEYNOTE-905/EV-303 showed consistent efficacy contributions for both enfortumab vedotin and pembrolizumab in cisplatin-ineligible MIBC #blcsm #oncology
Read more from @myESMO #ESMO26: https://t.co/hE5t4QtKph https://t.co/LX5XkxbrWG
OncLive®
PHASE 3 DATA · 2026 ESMO CONGRESS
KEYNOTE-905: 3-Arm Analysis in Cisplatin-Ineligible MIBC
In a descriptive ad hoc analysis of the phase 3 KEYNOTE-905/EV-303 trial (NCT03924895), perioperative enfortumab vedotin-ejfv (Padcev; EV) plus pembrolizumab (Keytruda; pembro) produced the most favorable outcomes vs pembro alone or RC + PLND alone in patients with MIBC.
36-month EFS rate: 69.5% EV + pembro; Pembro alone 49.6%; RC + PLND alone 37.4%; HR vs control: 0.40 (EV + pembro); 0.71 (pembro)
36-month OS rate: 74.5% EV + pembro; Pembro alone 61.4%; RC + PLND alone 55.7%; HR vs control: 0.48 (EV + pembro); 0.76 (pembro)
Pathologic complete response: 58.8% EV + pembro; Pembro alone 25.3%; RC + PLND alone 10.3%; Difference vs control: 48.6% and 15.7%
Pathologic downstaging: 65.9% EV + pembro; Pembro alone 33.7%; RC + PLND alone 14.9%; Difference vs control: 51.0% and 19.6%
n = 255 (EV + pembro, n = 85; pembro, n = 83; RC + PLND alone, n = 87); median time from randomization to data cutoff, 42.0 months. Comparisons were descriptive; no formal testing.
Source: Ullén A, et al. 2026 ESMO Congress; Madrid, Spain. Abstract 4733O.
OncLive.com
RC + PLND, radical cystectomy with pelvic lymph node dissection; EFS, event-free survival; OS, overall survival.
KOL infographic: OncLive infographic: durvalumab + enfortumab vedotin vs upfront cystectomy
💥 Survival was improved with durvalumab plus enfortumab vedotin in patients with MIBC according to new data from the phase 3 VOLGA trial
Full details ➡️: https://t.co/E06ad1TLto
#oncology #blcsm #ESMO26 @myESMO https://t.co/awzL71ztzo
Data from the phase 3 ENERGIZE trial showed the addition of perioperative nivolumab to neoadjuvant chemo did not yield a statistically significant improvement in pCR rate or EFS vs neoadjuvant chemo alone in muscle-invasive bladder cancer #blcsm #oncology
Dive into the @myESMO #ESMO26 data here: https://t.co/xlQiLhaCOA
OncLive®
PHASE 3 DATA · 2026 ESMO CONGRESS
ENERGIZE: Perioperative Nivolumab Plus Neoadjuvant Chemotherapy Misses Co-Primary End Points in MIBC
Adding perioperative nivolumab (Opdivo) to neoadjuvant gemcitabine/cisplatin (GC) did not significantly improve pCR or EFS vs GC alone in previously untreated muscle-invasive bladder cancer, according to final results from the phase 3 ENERGIZE trial (NCT03661320).
PATHOLOGIC COMPLETE RESPONSE
39.1% vs 29.6%
Nivolumab + GC (n = 325) vs GC (n = 328); difference, 9.5%
Multiplicity-adjusted threshold not met
EVENT-FREE SURVIVAL
HR, 0.94
95% CI, 0.72–1.24; P = .6697
Median, NR vs 67.6 months
Co-primary end point not met
OVERALL SURVIVAL
HR, 0.88
95% CI, 0.64–1.21
Median not reached in either arm
Analyzed descriptively
ctDNA CLEARANCE
81.3% vs 71.7%
Among patients ctDNA positive at baseline (exploratory)
Prognostic for EFS and OS in both arms
SAFETY AND FOLLOW-UP
Grade ≥3 treatment-related adverse effects (TRAEs): 50.0% vs 49.5%
1 treatment-related death (0.3%) with nivolumab · Median follow-up, 54.5 mo
Source: Necchi A, et al. 2026 ESMO Congress. Abstract 4736O. OncLive.com
EFS, event-free survival; HR, hazard ratio; NR, not reached; OS, overall survival; pCR, pathologic complete response.
KOL infographic: Cancer Therapy Advisor key takeaways: KEYNOTE-564 84-month OS and DFS
CancerTherapyAdvisor@CancerTherAdvsr
Post text
🆕 The final prespecified analysis of the KEYNOTE-564 trial demonstrated continued efficacy benefits with adjuvant pembrolizumab therapy for patients with ccRCC
Presented by @DrChoueiri (@DanaFarber) at #ESMO26 @myESMO
More data: https://t.co/xWhFtvk8oG https://t.co/691tZrIbaq
ESMO Oct 23-27
1 KEYNOTE-564 trial demonstrated continued efficacy benefits with adjuvant pembrolizumab therapy compared with placebo for patients with ccRCC.
2 At 84 months, the OS rate was 82.3% in the pembrolizumab arm and 76.6% in the placebo arm.
3 The 84-month DFS rates were 57.2% and 44.6%, respectively.
KEY TAKEAWAYS
Cancer Therapy Advisor
KOL infographic: OncoHub.ai infographic: ESMO 2026 Highlights of the Second Day (24.10.2026)
ESMO 2026 Highlights of the Second Day (24.10.2026)
Practice changing findings by tumour group — statistics exactly as presented. full day reports : https://t.co/BrjqVEmevJ @myESMO @onkolojidernegi @ASCO
#ESMO26 #bcsm #BreastCancer #LCSM #LungCancer #GUCancer #Melanoma https://t.co/IrU5K4AwH6
OncoHub.ai
ONCOLOGY SCIENTIFIC BULLETIN
ESMO 2026 — Highlights of the Second Day (24.10.2026)
practice-changing findings, ranked
MELANOMA & SKIN CANCERS
INTerpath-001 (LBA1)
First positive phase 3 of individualized mRNA neoantigen therapy.
resected stage IIB–IV melanoma — 24-mo RFS 82.2% vs 70.0%; HR 0.58 (0.45–0.75), p<0.001; DMFS HR 0.62 (0.45–0.85), p=0.002
THORACIC / LUNG CANCER
DeLLphi-305 (LBA3)
Potential new SOC 1L maintenance in ES-SCLC.
ES-SCLC 1L maintenance — mOS 21.1 vs 12.7 mo; HR 0.42 (0.32–0.54), p<0.001; mPFS 7.4 vs 1.9 mo; HR 0.34, p<0.001
MIBC
VOLGA (LBA2)
MIBC — D+EV EFS HR 0.51 (0.38–0.67), p<0.0001; OS HR 0.58 (0.40–0.83), p=0.0027; pCR 45% vs 10%
VERY HIGH-RISK LOCALISED PC
DASL-HiCaP (LBA4)
very high-risk localised PC — 4-y MFS-CI 95% vs 88%; HR 0.42 (0.27–0.66), p=0.0001
DE NOVO MCSPC
PEACE-1 (2215O)
de novo mCSPC — mOS 5.7 vs 4.6 y; HR 0.75 (0.65–0.87), p=0.0001; triplet mOS 6.2 vs 4.4 y; HR 0.68 (0.56–0.82)
GASTROINTESTINAL CANCERS
CheckMate 8HW (LBA32)
Reinforces NIVO+IPI as 1L SOC in MSI-H/dMMR mCRC.
MSI-H/dMMR mCRC — NIVO+IPI vs NIVO OS HR 0.61 (0.46–0.82), p=0.0009; vs chemo 1L HR 0.37 (0.24–0.57), p<0.0001
BREAST CANCER
KEYNOTE-B49 (LBA51)
Significant PFS gain but no OS benefit; unlikely practice-changing per expert comment.
HR+/HER2- CPS≥1 ABC — mPFS 6.7 vs 6.0 mo; HR 0.74 (0.58–0.95), p=0.0089; OS HR 1.04 (0.81–1.33), p=0.6185 (no benefit)
BREAST CANCER
FOURLIGHT-1 (1842O)
First next-gen CDK4-selective inhibitor with significant PFS gain after CDK4/6i.
HR+/HER2- post-CDK4/6i mBC — mPFS 9.4 vs 6.6 mo; HR 0.60 (0.440–0.825), p=0.0007; ORR 19.3% vs 11.3%
#ESMO26 #bcsm #BreastCancer #LCSM #LungCancer #GICancer #Melanoma
oncohub.ai
FAQ
About this page
What is on the ESMO 2026 GU Cancer slides page?
The 453 GU Cancer slide photos, abstract screenshots and data graphics plus 61 KOL-made infographics that oncologists, societies, media and companies posted on X from the ESMO 2026 embargo lift (October 22) through the congress in Madrid (October 23–27), compiled by KOL Pulse. Each card links to the original post and keeps the author's full text. It is one tumor-type page of the ESMO 2026 slide library: https://kolpulse.com/kol-pulse-esmo26-slides
Which GU Cancer trials are covered?
Trials with their own slide groups, by number of slide posts: VOLGA (22), DASL-HiCaP (20), KEYNOTE-B15 / EV-304 (16), LITESPARK-011 (15), LITESPARK-012 (13), TALAPRO-3 (12), ENERGIZE (12), KEYNOTE-866 (10), KEYNOTE-905 / EV-303 (9), PEACE-1 (9), TROPHY-U-01 (9), PROTEUS (8), JNJ-6143 Phase 1 (8), XmAb819 Phase 1 (8), PE-PE (7). Slides that compare several trials sit in a Cross-trial group, and slides not tied to a tracked trial come last. Physician posts come first in every group.
How do I filter by trial or KOL?
Use the trial chips in each section, the Trial menu (which also finds cross-trial slides that name that trial) and the KOL menu or the Built by avatars. Filters combine; counts only offer combinations that have results, and Clear filters or the Escape key resets. Every state has a shareable link, for example #tag=volga.
What are the OCR text and the source notes?
View OCR Text opens a verbatim transcription of the slide image; survival curves are captured as the printed numbers only, never read off the curve. Where it helps, a short context note gives the figures printed on the presented slide or abstract (for example, a different data cut or analysis). The author's caption is never edited.
Where are the other tumor types and the pre-congress archive?
Breast Cancer: https://kolpulse.com/kol-pulse-esmo26-slides-breast; Lung Cancer: https://kolpulse.com/kol-pulse-esmo26-slides-lung; GI Cancer: https://kolpulse.com/kol-pulse-esmo26-slides-gi; Melanoma: https://kolpulse.com/kol-pulse-esmo26-slides-melanoma; Gyn Cancer: https://kolpulse.com/kol-pulse-esmo26-slides-gyn; Heme & Other: https://kolpulse.com/kol-pulse-esmo26-slides-other. Pre-congress previews, watchlists and top-10 lists: https://kolpulse.com/kol-pulse-esmo26-slides-archive
Can I use this page with my own AI assistant (NotebookLM, Perplexity, Claude, ChatGPT)?
Yes. Paste the page URL, or a filtered link, into your assistant and ask questions against it. Example prompt: "From the slide transcriptions on this page, list each trial's primary endpoint result with the hazard ratio and data cut exactly as printed on the slide, and the physician who posted it."
Compiled and reviewed by the KOL Pulse research team, led by Brian Shields, Founder, KOL Pulse. Last updated October 29, 2026. Every card links to its original post; slide text is a verbatim transcription.
Free access — track oncology’s top KOLs in your specialty: profiles, pharma influence, ad-board patterns & 2025 Open Payments analysis.KOL Pulse Insider























































































































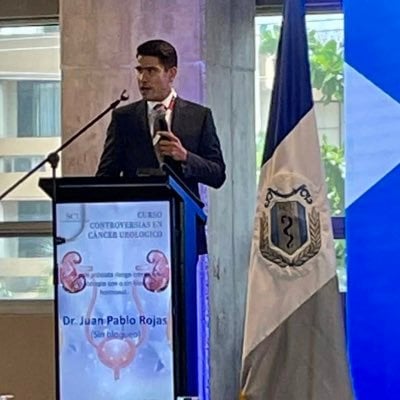



















































































































 Jeff Ryckman @jryckman3


 MV Chandrakanth @ChandrakanthMv


 Markus Eckstein @Markuseckstein3


 Dr. Poetic 🩺 Oncology 🇮🇱 @Dr_Doc_


 Mustafa Özdoğan, MD @ozdogan_md


 Max Kates @MaxKates


 Tobias Büttner @tobiasmbuettner


 UrologyWatch.com @UrologyWatchHQ

 Prof.Dr. Tümay İpekçi @tumayipekci


 Kevin Tay @KVTay316

 Andre G, MD, Rad Onc ⚽️ 🇮🇹 🇨🇦 @RadioOncologia

 MedJ @MedJ0401

 ESMO - Eur. Oncology @myESMO


 OncoAlert @OncoAlert


 LARVOL @Larvol


 Uromigos @Uromigos


 Dr. Robert F. Siegmund, MBA @robertfsiegmund


 CancerTherapyAdvisor @CancerTherAdvsr

 OncoHub @oncohubai